21 Dec 2020 Power BI: Smart Narratives
Story-telling is one of the key points in the creation of a dashboard: it’s valuable to bring additional information and hints that could be missed in a quick view of the story.
Smart narrative visualization in Power BI helps you to summarize reports by showing relevant out-of-the-box key values.
1. Smart Narrative
Smart narrative is a new visual added to Power BI in the September 2020 update. This visualization allows developers to create quick insights into the story explained in the dashboard.
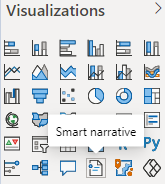
Figure 1: Smart narratives Icon.
This new feature is in preview; to be able to use it you will first need to activate it in the option panel in Power BI.
Go to File > Options and Settings > Options > Preview features > Smart Narrative ✓
Once this feature has been added it will appear in the visualization menu as shown below:
1.1. Smart Narrative Default
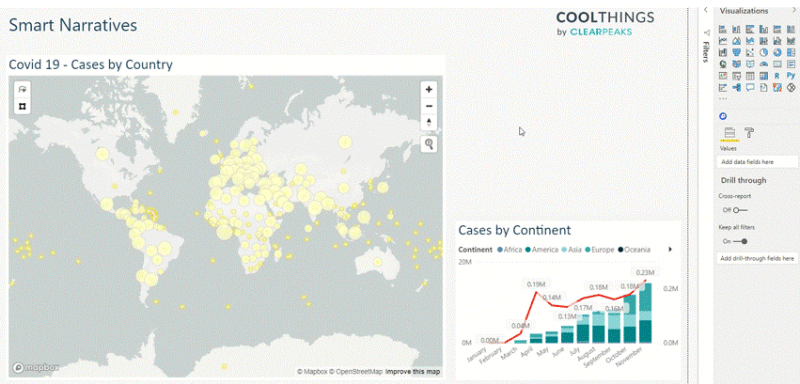
Figure 2: Autogenerated Smart Narrative.
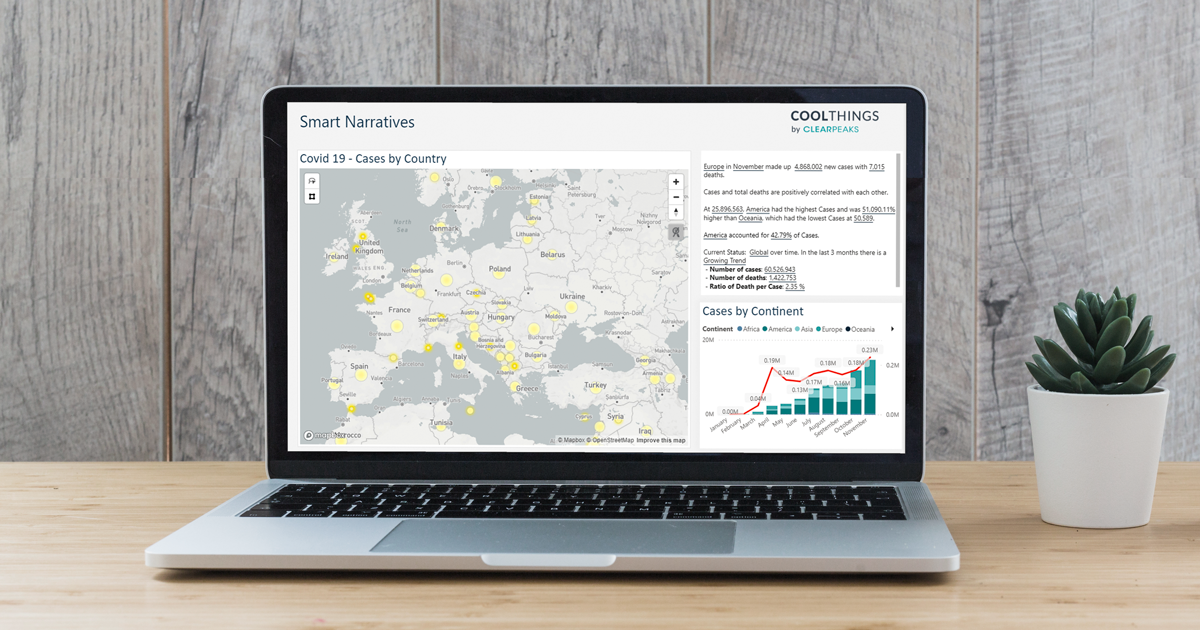
In this POC we worked with some COVID-19 data, obtained from the EU Open Portal Data. In this dashboard we have only created two charts, the map with Covid Cases by Country and the Cases by Continent. With this information Power BI can create this smart narrative:
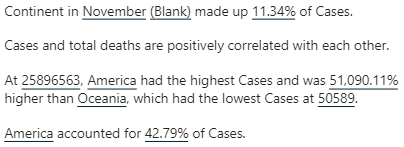
Figure 3: Smart Narrative.
This information offers us some interesting hints; but what really makes this new tool powerful is the text customization – you can easily change everything about the look (font, colour, size…), and you can also create new measures using Power BI custom metrics.
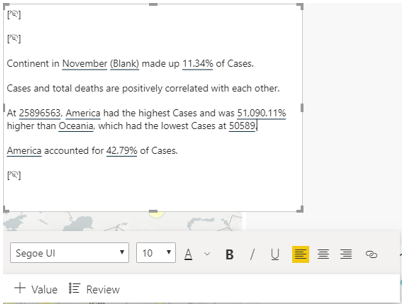
Figure 4: Smart Narrative configuration.
1.2. Custom Smart Narrative
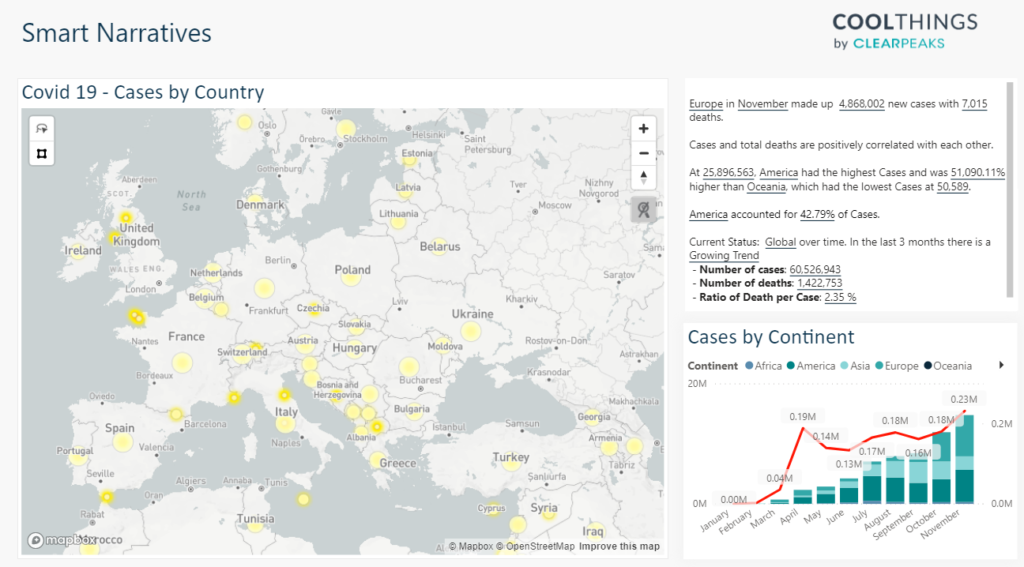
Figure 5: Custom Smart Narrative.
In this new dashboard we have created some custom fields and fixed some of the default values of the smart narrative visualization. These fields had been created with custom measures and added to the text. When the user is selecting one country everything will be recalculated for this visual.
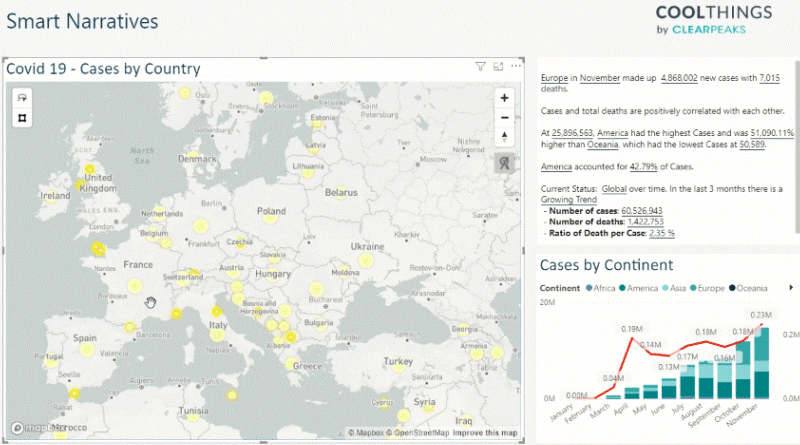
Figure 6: Smart Narrative Custom: Filtering.
1.3. Work in progress implementations
- Doesn’t allow cross filtering functions that Power BI allows.
- Doesn’t allow Support on Azure.
Conclusion
Smart narrative is a powerful tool that must be considered when we want to summarize and give some out-of-the-box insights to the user.
The default version of the visualization is sometimes not enough: in this case we can add some custom values to give more key information to the user.
If you are interested in smart narratives that satisfy your clients’ needs contact us, and we will give you a helping hand!