
03 Jun 2021 What’s New in Dataiku 9.0
Dataiku is an Enterprise AI platform enabling organisations to build scalable advanced analytics applications. The platform Dataiku DSS (Data Science Studio) is focused on enterprise-class collaboration, governance, and explainability. The Dataiku DSS platform has many capabilities, including Data preparation, Visualisation, Machine Learning, Data Ops, ML Ops, and Analytics Apps.
At ClearPeaks, we are an implementation partner of Dataiku, and guide our customers along their Advanced Analytics journey, no matter at which stage they might be. In this article, we cover some of the cool new features of the new Dataiku DSS version 9.0.
1. ML Diagnostics
When building machine learning problems, you might potentially run into issues like data leakage, overfitting, pitfalls in interpreting evaluation metrics, etc. Through the Visual ML Diagnostics feature enabled in the ‘Design’ tab, Dataiku does a set of checks and helps you identify and correct common problems:
- Dataset Sanity Checks – Checks whether train and test datasets are too small, imbalanced, or if the target variable distribution in the test data is not the same as that in the training data, which might lead to misleading performance evaluation.
- Modeling Parameters – Checks on modeling parameters with respect to the characteristics of the data, which can otherwise lead to issues like slower training time and overfitting.
- Training Speed – Reports a warning if training speed is not optimal due to factors like hyperparameter search strategy, runtime environment bottlenecks, etc.
- Overfit Detection – Checks on trained model attributes to identify overfitting.
- Leakage Detection – Checks on performance metrics and feature importance to detect possible data leakage.
- Model Check – Checks to ensure that the model outperforms a random or baseline model.
- ML Assertions – Checks whether the model satisfies ML assertions and will report if assertions could not be computed or failed.
While training a model in a Dataiku visual analysis, diagnostics are displayed in real time on the ‘Results’ tab. You can review the warning and decide whether to continue or abort the training. The summary of the diagnostics will be available after the training of the model, and can be found by clicking on ‘Diagnostics’ or by viewing the ‘Training information’ section of the model.
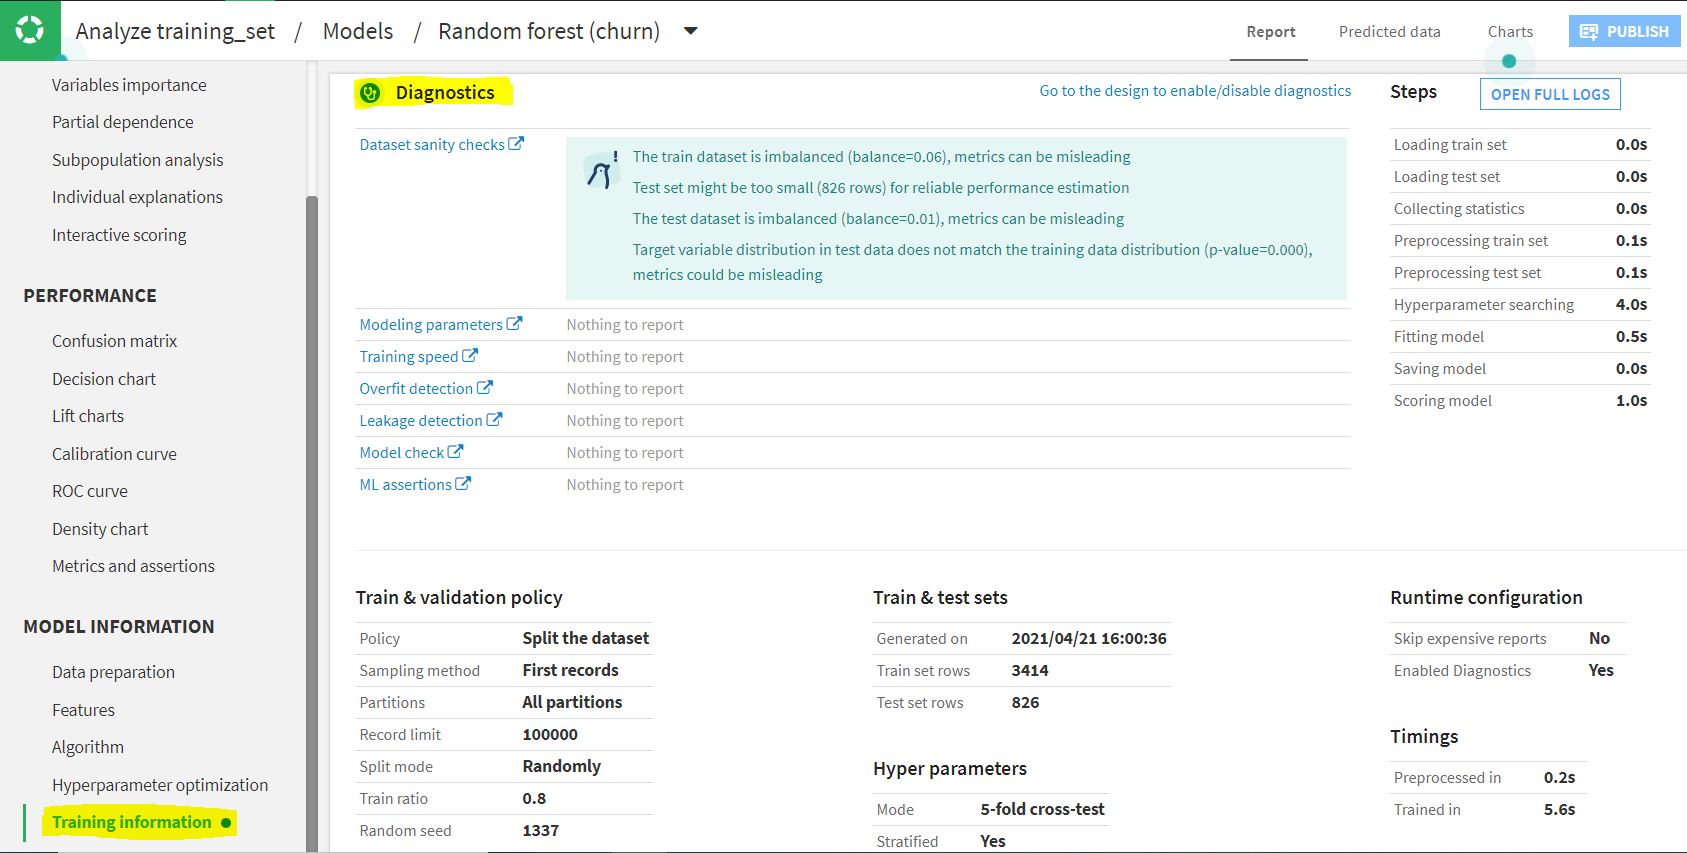
In the example above, there are 4 warnings under Data sanity checks. Train & test sets are highly imbalanced, test set size is too small, and the target variable distribution in the test does not match with that in the training set. All these can lead to misleading evaluation metrics, due to which a reliable performance estimation is not possible. With this example, we can see how Dataiku makes it easy to catch and address these issues.
2. ML Assertions
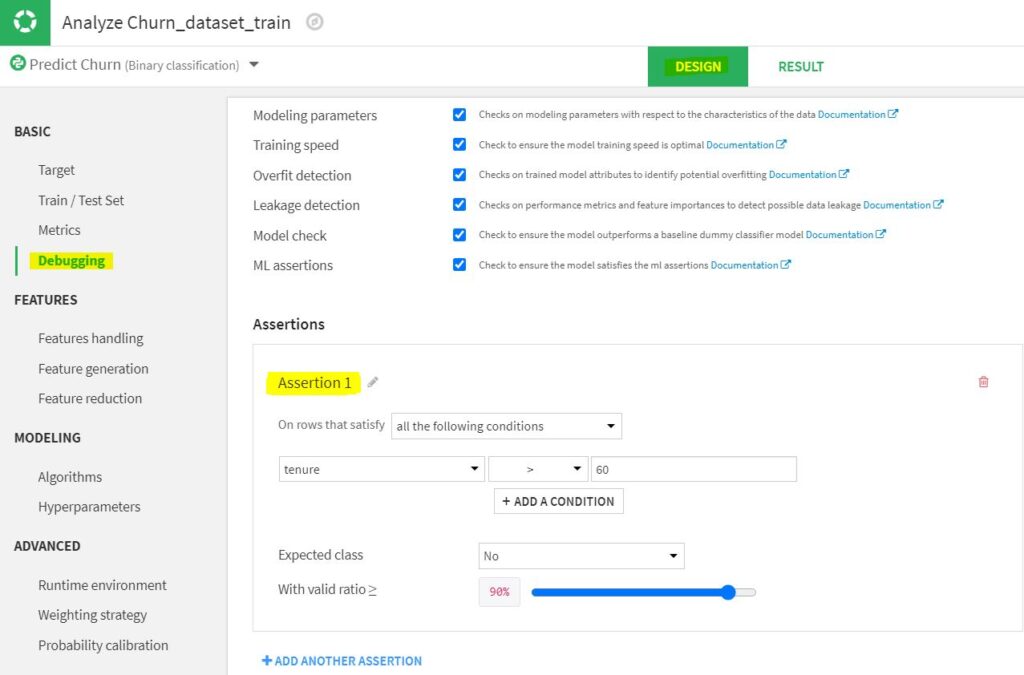
When validating models, domain experts can insert expectations as assertions before the training of the model in the design phase. In the example below for predicting churn, we set this definition: if the ‘tenure’ >60, expected class is ‘No’ with valid ratio >= 90%, i.e., there is only 10% or less probability that the customers who stayed with the company for more than 60 months are likely to churn.
After training and testing the model, you can see whether the model satisfies the ML assertion under the ‘Performance metrics’ of the model as shown in the image below:
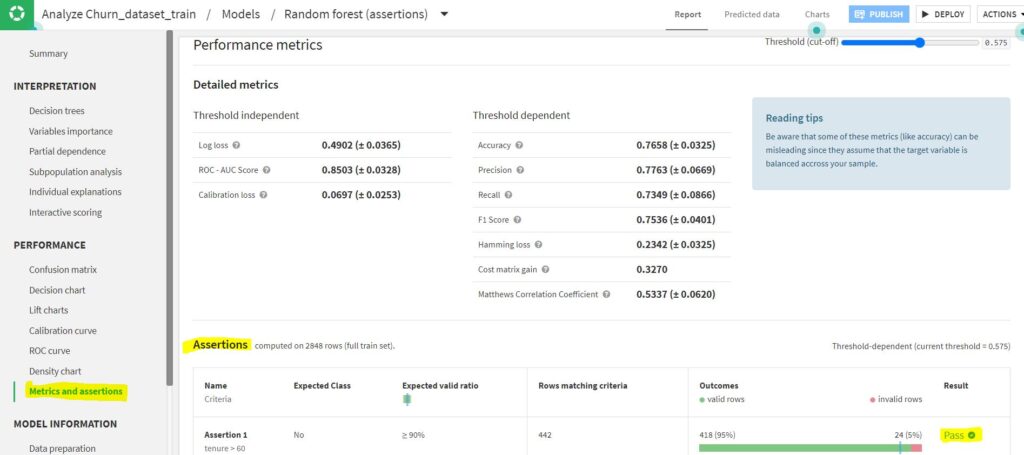
In the example above, 95% of the rows satisfy the condition and it’s a ‘Pass’! If ‘ML Assertions’ has been checked under ML Diagnostics, in case the assertion fails, it will also be reported under ‘Diagnostics’.
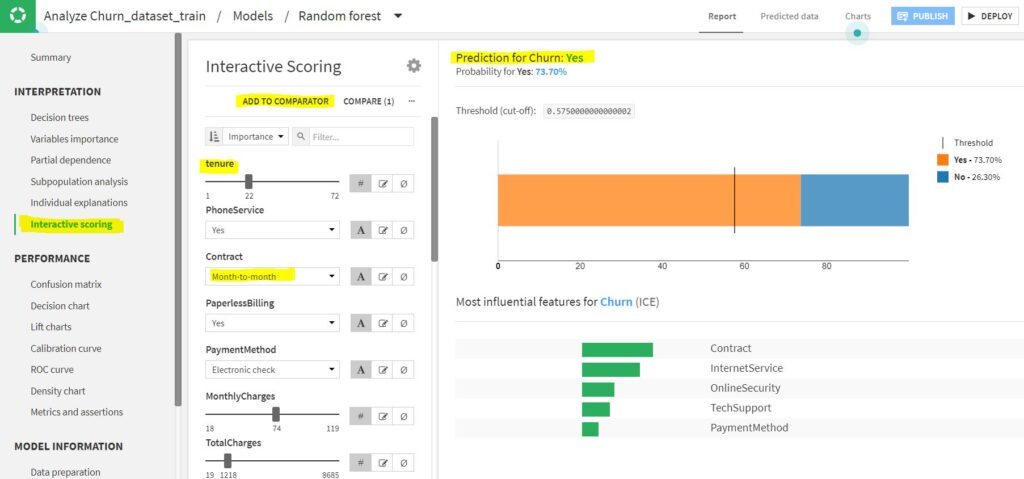
3. Interactive Scoring
Dataiku’s latest version introduces ‘Interactive Scoring’ to let users try out different combination of input values (what-if analysis) and see the output prediction. You can perform a comparison of the simulation inputs by adding them to ‘Comparator’ through the ‘Add to Comparator’ option. You can also copy and paste input values from the dataset for comparison.
Once the model is deployed, Interactive Scoring can also be published to a dashboard for broader use.
4. Interactive Date Filters
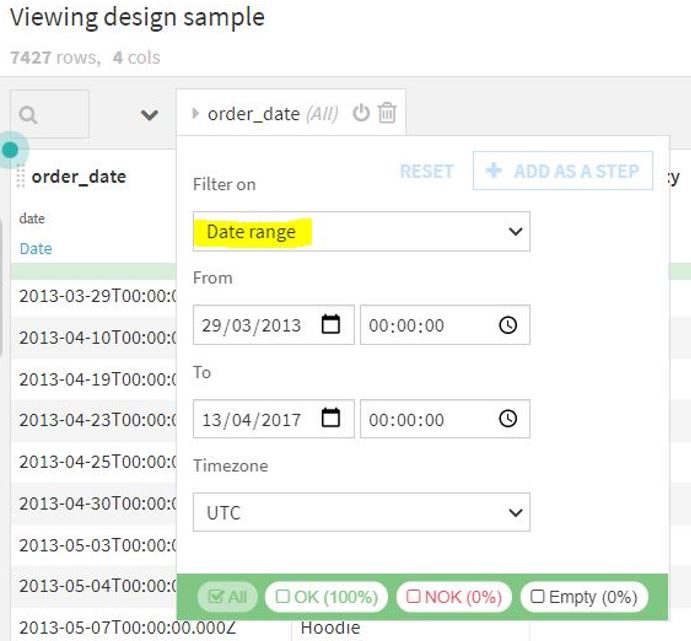
Dataiku DSS now allows date filtering based on:
- Date range – filter using static start and end date with time zone.
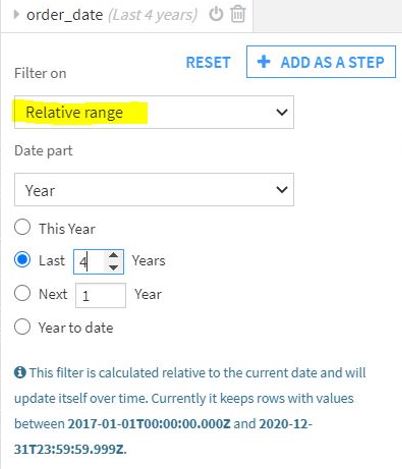
- Relative range – filter year, quarter, month, day, or hour relative to the current.
- Date Part – filter based on specific part of the date. For example, filter 3rd quarter of all the years.
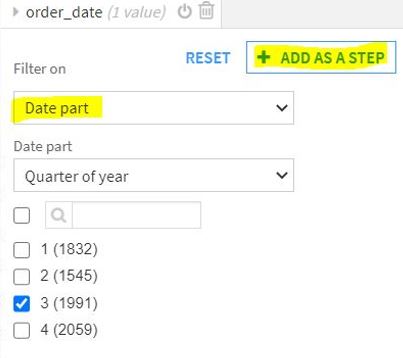
By clicking on ‘Add as a Step’, that custom data filtering will be added as a processing step of the Prepare recipe.
There are two new processors available for date preparations: ‘Increment date with a specified value’ which can be used to increment dates by number of days, weeks, months, or quarters; and ‘truncate date at a specified value’ which is useful in discarding the parts of the date or timestamp that are not required.
5. Fuzzy Join
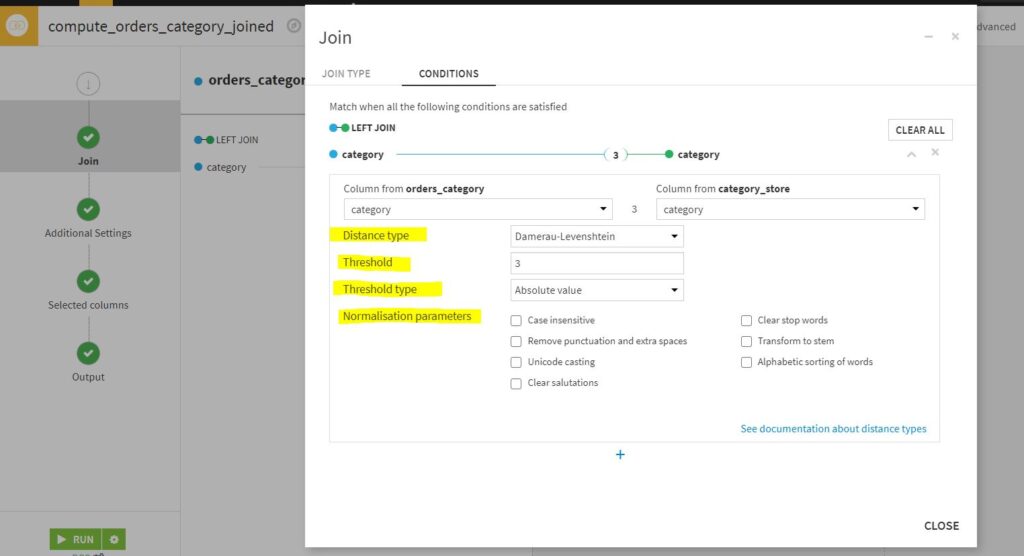
Dataiku now introduces the ‘Fuzzy Join’ recipe, which allows to join datasets even if the matching strings are not exactly equal. The example below shows a fuzzy join of 2 datasets on ‘category’:
‘Distance type’ can be chosen depending on the type of data, such as ‘Damerau-Levenstein’ distance, ‘Cosine’ similarity for strings, Euclidean distance for numbers, ‘Geospatial’ distance for geo-points based on latitude and longitude coordinates, etc.
Distance ‘threshold’ and ‘threshold type’ can be chosen to define matching tolerance i.e., how fuzzy the match should be.
To simplify texts in both datasets, there are options under ‘Normalization parameters’ to clear stop words, transform to stem, sort words alphabetically, etc.
6. Smart Pattern Builder
If you are struggling to build regular expressions to extract a pattern from the text, Dataiku comes to your rescue with one of it coolest features, ‘Smart Pattern Builder’!
Let us take a simple example of extracting domain names from email addresses. Under the ‘Extract with regular expression’ process of the Prepare recipe, select the input column ‘email’ and click on ‘Generate with Smart Pattern’.
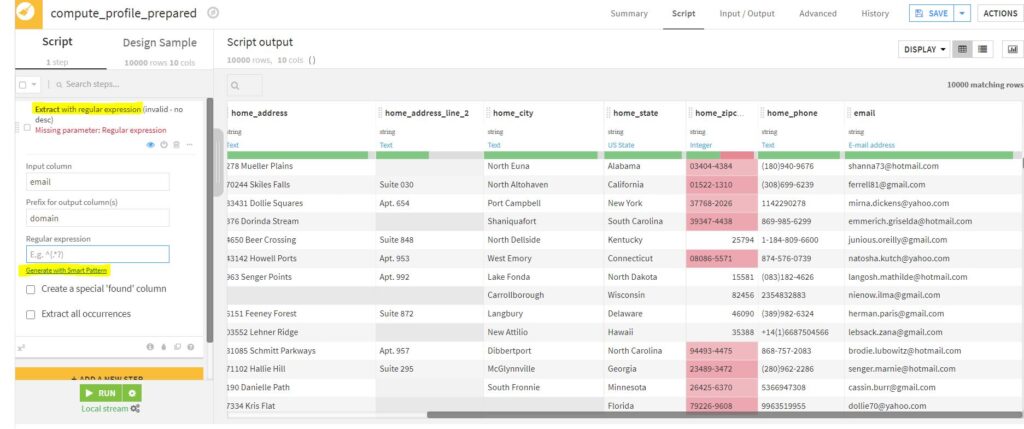
Now the values (gmail.com, hotmail.com, yahoo.com) can be selected from the ‘Input sample’ to the ‘Selections’ for which a corresponding regular expression will be detected.
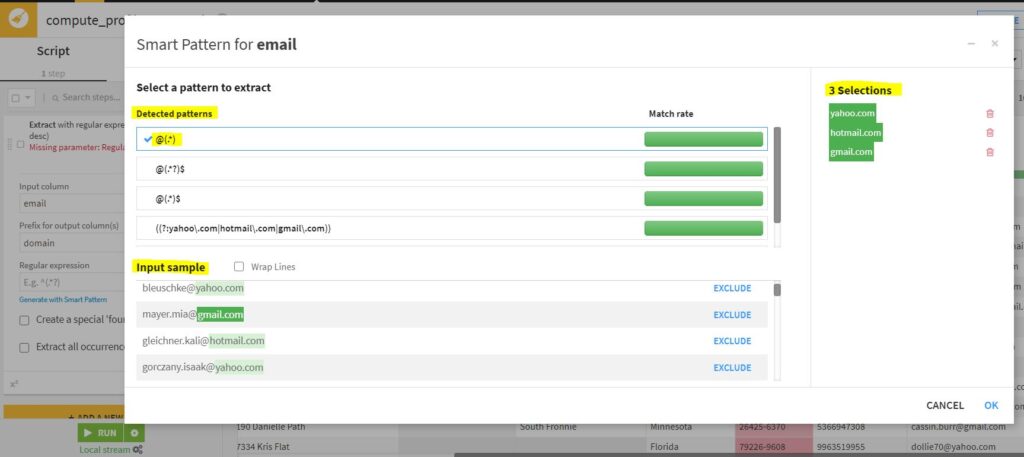
Regular expressions can thus be selected from the detected patterns.
This new ‘Smart pattern’ feature can also be used in the ‘Fold multiple columns by pattern’ processor.
In addition to the features mentioned in this blog, there are numerous features available as part of this new release, such as:
- ‘Distributed Hyperparameters Search’ to train models on multiple containers leveraging Kubernetes
- ‘Git Push and Pull’ that makes it possible to import Jupyter notebooks to DSS projects from Git repositories and push them back to their origin
- ‘Wiki Export’ which enables wikis (project documentations) to be exported to PDF
- And more!
Conclusion
Having data diagnostics information and an emphasis on assertions enables data scientists to build robust models. On top of this, Dataiku’s out of the box interactive scoring is a great feature that enables users to understand what needs to be done to maximise profits or efficiency.
When it comes to improvisation, adding new features, and listening to the customer feedback, Dataiku is always ahead of the game. Send us an email and find out how our certified expert ClearPeaks consultants can help you in your advanced analytics journey with Dataiku!
