
23 Apr 2019 Big Data made easy
Article 4: Working with Datameer to ease end-to-end operations in a Cloudera cluster
This is the fourth post in our series of blog articles “Big Data made easy”, in which we explore the tools that help us to manage Big Data and Big Data platforms such as Cloudera, the most popular Hadoop distribution. In our previous blog articles, we demonstrated Talend Open Studio for Big Data and StreamSets for ingesting and transforming data in Cloudera in batch and real time respectively; both tools also support other Big Data platforms. We had a look at Zoomdata and Arcadia Data too, excellent choices for visualizing data in Cloudera or other platforms.
As in the other articles in the series, here we’ll be using data from CitiBike NYC, a bike-sharing service operating in New York that chose to make their data openly available online. There are two types of data sources: first, the anonymized historical data of all the trips from 2013 to 2017, and second, the real-time data feed provided via a HTTP REST API that delivers JSON files with information about the current status of each station, their parking docks, the number of available bikes and other parameters.
In this article we’ll only use the anonymized historical data. As in the first post, we placed the data in different data sources:
- 2013-2014 trips: Excel files
- 2015-2016 trips and weather data: MySQL server
- 2017 trips: HDFS
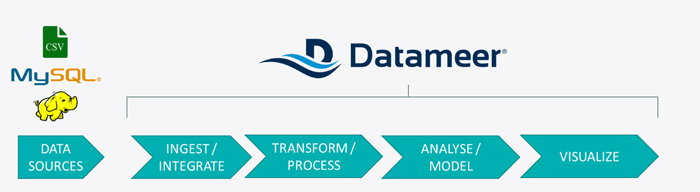
In this article we’ll work with Datameer, a tool that offers an alternative when you do not wish to have multiple tools and are looking for a single end-to-end solution for the typical stages of (Big) Data pipelines, i.e. ingestion/integration, transformation/processing, analysis/modeling, and visualization. Please note that an end-to-end tool will not be as feature-rich as dedicated tools focusing on particular stages of the pipeline: for example, the ingestion and transformation capabilities of Datameer are not comparable to Talend Open Studio for Big Data, and neither are Datameer’s visualization capabilities in the same league as Zoomdata and Arcadia Data. As we’ll see later in the article, we would not recommend Datameer for all types of pipelines: for highly complex pipelines, a dedicated tool may be more advisable.
1. Introduction to Datameer
Datameer is built on top of a Hadoop distribution such as Cloudera and its ultimate goal is to make Big Data pipelines as easy as possible; Datameer positions itself as an end-to-end, easy-to-use and agile data analytics platform. By covering all the stages of Big Data pipelines (“end-to-end”), Datameer unifies all data operations in a single view and interface.
It integrates well in the modern data ecosystem, and can be deployed on open-source Hadoop, Cloudera or Hortonworks and in most popular Cloud vendors (AWS, Azure and Google Cloud). It is compatible with streaming tools such as Flume, Kakfa, Nifi and StreamSets. On the visualization side, Datameer ships with some visualization capabilities and you can also use other BI/reporting tools such as PowerBI, Qlik, Tableau, Arcadia Data or Zoomdata.
Datameer makes it easy to ingest and integrate data from a lot of sources and in a lot of formats. You can upload data directly, or use data links to pull data on demand. With its robust sampling, parsing, scheduling tools and data integration features, Datameer helps you to access the data you need.
Datameer gives you a set of advanced data-preparation functions to help you easily cleanse, blend and organize your data for analysis; with Datameer´s visual exploration capabilities, you can generate preparation steps at the click of button. See what’s happening with your data at every stage, and tailor your workflow accordingly!
Visual Explorer delivers truly interactive data exploration at scale. It´s unique, schema-less architecture enables unconstrained exploration, letting you focus on what is important and extract real value from your data.
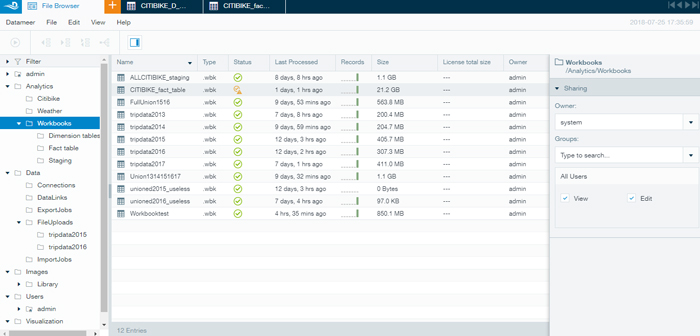
Datameer offers a clear, simple interface, allowing you to organize your work properly: workbooks folder, data folder split into connections, datalinks, export job, import job and filed uploads folders, images folder, visualization folder, etc.
2. Solution overview
For the demonstrations presented in this blog post and in the rest of the series, we deployed a 4-node Cloudera cluster in Microsoft Azure. To install Datameer on top of our Cloudera cluster, we basically followed the instructions detailed in the Datameer webpage.
Using Datameer, it was easy to make the three required connections to our data sources, i.e. one for HDFS, one for Excel files and one for MySQL. We were able to do import jobs to upload our data in a single place, and we merged the imported data into one table (workbooks sheet); then we defined an export job to HDFS, saving this data in the staging area.
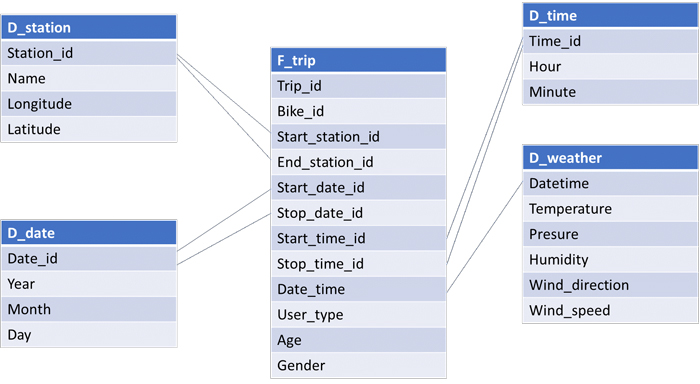
Thanks to Datameer´s advanced tools, options and functions, we could make the necessary transformations to our data. In order to define a star schema model for our data, we created dimension and fact tables and then, using the connections made before, we defined the export job to HDFS and saved the final tables in the final area. The resulting star schema looks like this:
In the next section we’ll detail the ingestion and transformation procedure we carried out with Datameer. Once this is done and the data is ready for analytical consumption, we can also use Datameer to visualize the data – but remember that it was built for simple visualizations and is not meant to be a full BI solution – it lacks filtering capabilities, derived columns, etc. Since we already recommended (and used) Zoomdata and Arcadia Data as more complete BI solutions, we focused on the ingestion and transformation capabilities of Datameer.
3. Steps taken with Datameer
- Create the required connections, i.e. for HDFS, MySQL and SSH, with the simple and intuitive interface. You can create a connection in 3 simple steps:
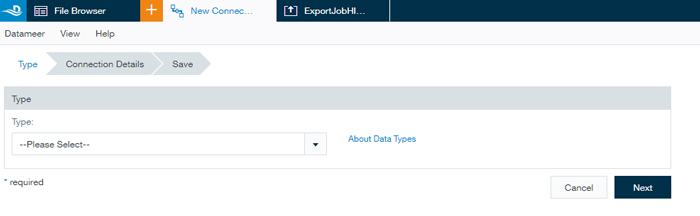
- Choose the type of connection from those available natively in Datameer (more can be added if needed).
- Specify the connection details (host, port, etc.).
- Add a description and click on Save to add the connection to the Connections
- Create the various import jobs to upload all the required data to Datameer, one for every table/file in the various connections. You can create an import job in 5 steps:
- Choose the connection from the list or create it on-the-fly, then choose the file type.
- Enter the path to a file or folder where data resides.
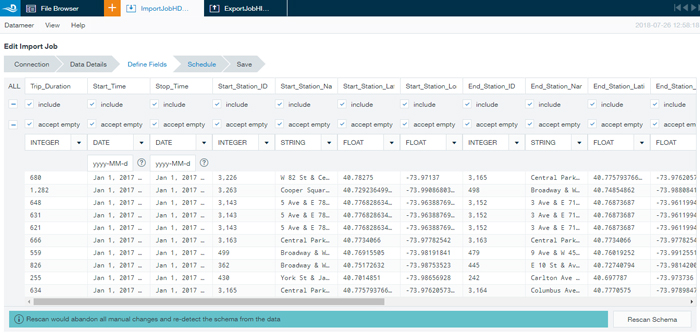
- Provide data details by checking a sample of the table and specifying the field types, if empty values are accepted, etc. You can also choose which columns are to be ignored.
- Schedule the job to be run on a defined frequency in order to update the data.
- Finally, save the job in the ImportJobs folder.
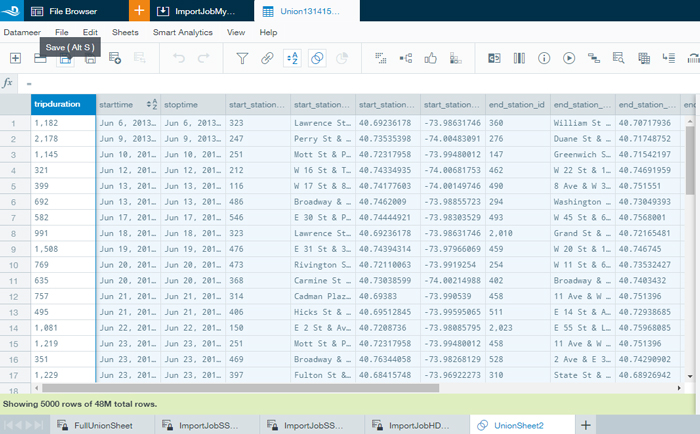
- Explore the loaded data by creating a workbook. A workbook is split into sheets, and every sheet is a table (like in Excel). We loaded the different tables with weather information as well as the various tables with historical bike trips.
- Merge the historical bike trip data spread across different sources: as we received the data from different sources, we had to merge it all into one single table (sheet in workbook). To do this, we had to add as many sheets as data files we wanted to merge, and then join them in this workbook.
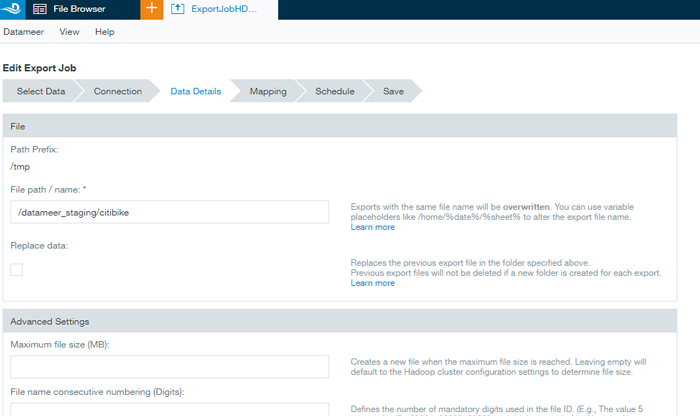
- Export the merged data. Once we obtained the merged table for all CitiBike historical trips as well as the tables for weather data, we exported them to a staging area in HDFS using Export Jobs. You can create an export job in 6 steps:
- Choose a sheet from a workbook to be exported.
- Choose the connection. As in the import job, you can make a new one or select one from the connections you have already made; you also need to choose the file type.
- Indicate the destination file path as well as other export options.
- Check the table that will be exported and configure the settings related to exported data field types (string, float, etc.) and which columns to include.
- Configure the scheduling if required.
- Finally, save the job in the ExportJobs
- Transform the data into dimension and fact tables. As with any other transformation exercise, we faced challenges due to non-desired data quality (our daily bread in ClearPeaks!). For the various dimension and fact tables we encountered issues and below we’ll explain how we solved them with Datameer’s help.
- We started with the D_station dimension table. This table lists the various stations, and for every station we need its identifier, name and geographical position (latitude and longitude). While working on generating this table we were met by a problem: when trying to get the unique stations from the big (merged) table with the historical trips, we saw that various bike trips had the same station identifier but different station names (or the other way around); some stations had different latitude-longitude pairs. In consequence, we decided to use the most recent records as the versions of truth in order to have a unique entry for every station. We used Datameer’s transformation features to group the trips by station id and to select the most recent trip as the reference to obtain the station information.
- Then we made the D_date dimension table. This table lists the various days when there are bike trips, and for every day we need an identifier, the year, month and day. This was a piece of cake with Datameer!
- Doing the D_time dimension table was simple too. With Excel we could programmatically create this table (with 1,440 rows) and then import it to Datameer.
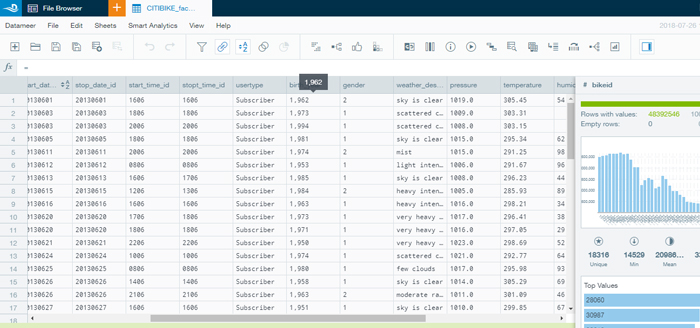
- The last dimension table was D_weather, essentially the same table we imported from MySQL. For every datetime it has temperature, pressure, humidity, wind direction and speed.
- Finally, we worked on the fact table F_trip. Our initial table was the big table with all the trips and after some basic transformations we obtained all the columns; links with the dimension tables were using identifiers that were already there or that were straightforward to compute.
- Export the dimension and fact tables to their final location in HDFS. We did an export job following the same steps as before.
- Visualize the data. We explored the visualization capabilities of Datameer, which offers some quick but limited visualizations: no filtering, no derived columns, etc. An alternative that we also explored was to create an export job to Hive (this required creating a new connection) and once the data was exported, it could be visualized with other tools such as Zoomdata, Arcadia Data, Tableau, etc.
Conclusions
Datameer is simple to use and has a nice-looking, clear interface; it helps to organize work into workbooks, jobs, connections, etc. It has built-in connections to web services, databases, file stores, Hadoop, etc., and it is very easy to create connections. Once a connection is created, it is also easy to import and export jobs (to/from a Hadoop cluster). There is also the option (not covered in this article) to use Data Link to copy the data into Hadoop only at analysis runtime (so no data is stored in Hadoop). The workbooks concept is a very intuitive way to interact with and to manipulate data.
Datameer is an ideal tool for quick data manipulations: simple ETL is very fast which, in an organization seeking to be more agile, can yield significant benefits. It is an end-to-end tool that allows Big Data engineering and analysis in a quick and easy way, and it is also possible to visualize the data for quick exploration. However, bear in mind that Datameer targets non-complex end-to-end pipelines, so if you have complex requirements in any stage of Big Data analytic pipelines, a more specialized tool would be recommended, like Talend for ingestion and transformation and Zoomdata or Arcadia Data for visualization.
If you are wondering which set of tools is the best for you and for your business, don’t hesitate to contact us – we will be happy to review your situation and recommend the tools that suit you best.