13 Dec 2023 AI-Powered Power BI Chart Generation
Data can be a goldmine for insights, but digging through it all is not everyone’s cup of tea. Enter the chatbot, our friendly new assistant! Imagine having a conversation about the data you want to visualise. You ask, and the chatbot listens, understanding your request perfectly.
In today’s data-driven world, countless companies are leveraging the strengths of Power BI in data visualisation and analysis, significantly contributing to informed decision-making within organisations.
Nevertheless, accessing this information isn’t easy. Non-technical users often get lost in complex datasets, missing essential points due to the lack of user-friendly access. This hinders full resource utilisation, consequently limiting potential insights and impacting the decision-making process. We have created a solution for this by integrating OpenAI’s GPT with Power BI.
How Our Solution Works
- The user asks a question or makes a data-related request through the chat interface.
- OpenAI’s technology acts as an intermediary, interpreting the query and combining it with a pre-scripted prompt that contains essential dataset information and generates a precise instruction.
- This instruction is sent to Power BI’s chart generation tools, which subsequently produce a relevant, comprehensible, and accurate visual representation of the requested data.
- GPT technology has evolved impressively and can now generate visual charts from given data. However, using ChatGPT to create charts means the manual input of data, which can be time-consuming and ultimately inefficient. In contrast, Power BI hoards a wealth of consistently updated data, and by integrating OpenAI’s GPT with Power BI, we can avoid manual data entry. Users can interact with ChatGPT, which then accesses and uses the relevant, up-to-date data from Power BI to create the desired visualisations efficiently and accurately.
What the Finished Product Looks Like
The finished product is a straightforward chat interface where users interact with a chatbot to access data visualisations.
The user simply enters their questions or data requests in the chat, just like sending a message in any messaging app.
The chatbot, powered by OpenAI and integrated with Power BI, processes the request, accesses the necessary data, and generates the relevant chart.
The generated visualisation then appears directly in the chat interface, providing users with immediate access to the requested data insights in a visually accessible format:
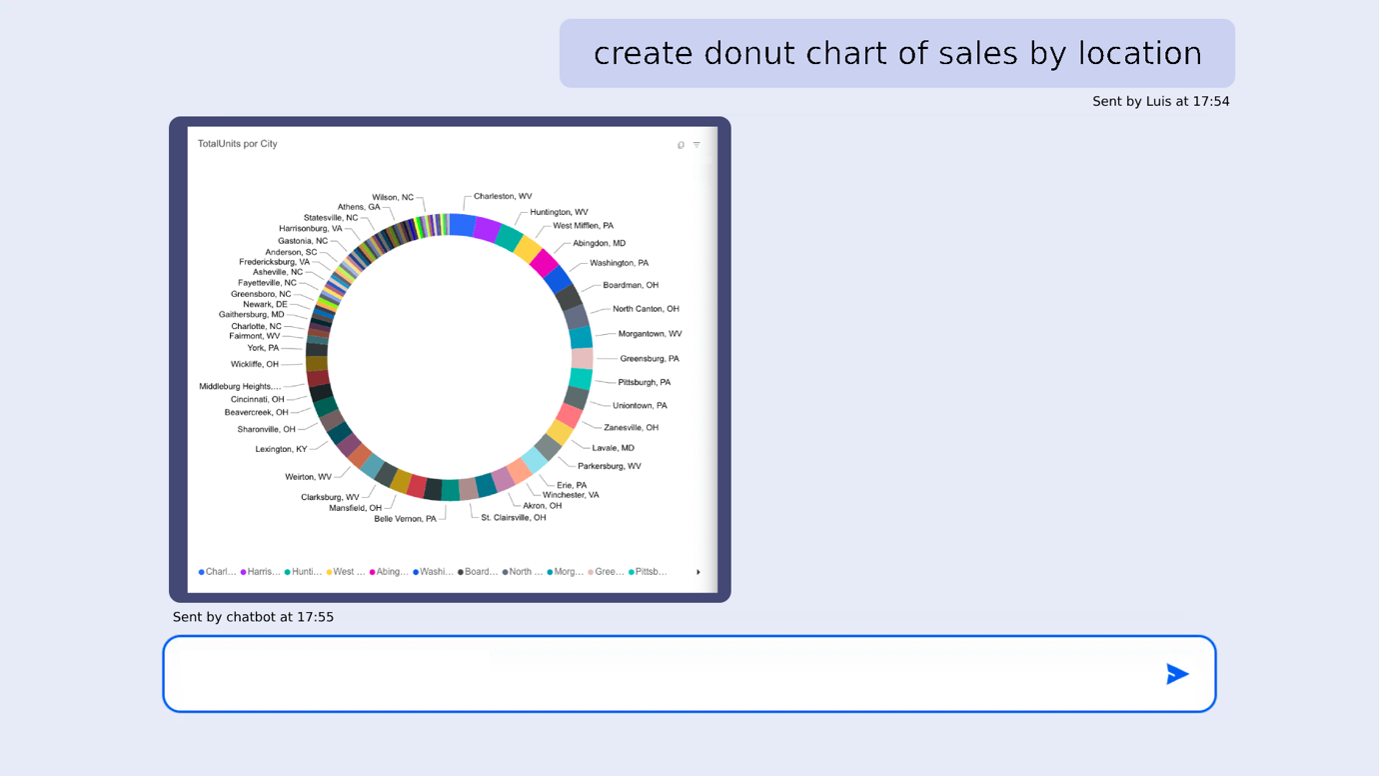
Figure 1: The user asks about data that can be found in the Power BI dataset and the chatbot replies with the requested chart.
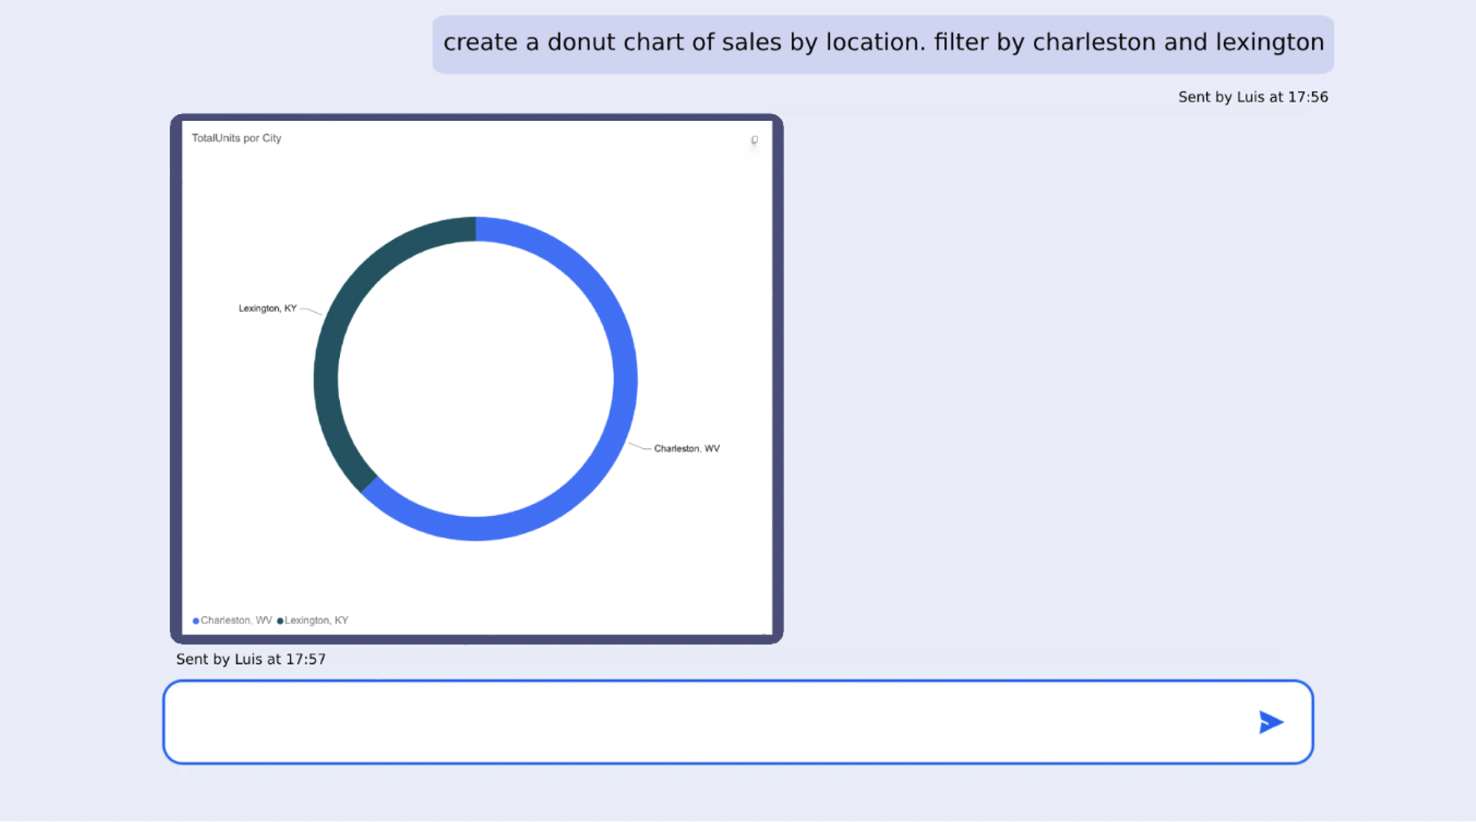
Figure 2: The user applies a filter for more specific data retrieval.
Benefits
Immediate Creation and Display of Charts: The chatbot swiftly processes user queries, generating and displaying the relevant charts instantly in the chat interface.
User-friendly: Users don’t need to be Power BI specialists. The interface is intuitive, enabling easy interaction and use.
No Need for Pre-created Charts: The system eliminates the need for pre-created charts, as the visualisations are generated in real time according to the user’s queries, so the data displayed is always up-to-date and relevant.
Technical Details / Implementation
Infrastructure Needed:
- An OpenAI account to leverage GPT capabilities.
- A Power BI account with a pre-existing dataset for access to relevant data.
- A custom prompt tailored for GPT, outlining the specific tasks and executions necessary for data retrieval and visualisation.
- An Angular project to build the frontend, where user interactions take place.
- A backend project dedicated to communicating with the OpenAI API, ensuring a smooth flow of information and responses.
How the Code Works
- The chatbot interface shapes the user interaction layer where queries are received.
- When a chart-based response is received from the server, the system is equipped to initially display a blank embedded Power BI report.
- Utilising the Power BI SDK, it then creates and populates the visual based on the instructions and data received from OpenAI, ensuring that the visual representation of data is accurate, detailed, and aligned with the user’s query.
You are an AI assistant to generate json responses. The user asks questions and you must output a json that will be used as an input instruction for the powerbi chart generation SDK. The output JSON must have three attributes: "chartType", "dataFields" and "filters"

{
  "dataset_description": "This dataset has data about sales",
  "dataset_tables": [
    {
      "table_name": "Time",
      "data_fields": [
        {
          "data_field": "FiscalYear",
          "distinct_values": [
            "2013", "2012", "2014"
          ],
          "description": "The year of the operations",
          "type": "column"
        }
      ]
    },
    {
      "table_name": "Sales",
      "data_fields": [
       …
      ]
    }
    …
  ]
…
}
Code snippet: Some of the content of the custom GPT prompt (instructions and dataset descriptions).
await report.updateSettings(settings);

const createVisualResponse = await activePage.createVisual(pbjson.chartType, customLayout);
const visual = createVisualResponse.visual;

pbjson.dataFields.forEach(async (dataField: any) => {
  …
});
Code snippet: Angular code uses the Power BI SDK to create the visual.
{
  "chartType": "DonutChart",
  "dataFields": [
    {
      "role": "Category",
      "table": "Store",
      "column": "City"
    },
    ...
  ],
  "filters": []
}
Code snippet: A sample of a response from OpenAI containing the instruction that is later used as input for the Power BI SDK.
Conclusion
Implementing this innovative solution offers undeniable business value, streamlining the data visualisation process and making it more accessible, efficient, and user-friendly.
Here at ClearPeaks we have the requisite knowledge and expertise to meticulously execute this implementation. Our team is ready to guide your business through all the technical aspects, ensuring that you reap the maximum benefits from this powerful integration of OpenAI and Power BI technologies. Don’t hesitate to reach out to see how our certified consultants can drive your business forward!