30 Mar 2022 Configuring Health Alerts in Cloudera Data Platform Experiences
We recently had to implement a comprehensive health monitoring solution for one of our customers on Cloudera Data Platform; the idea was basically to inform platform admins as soon as any health issues affecting any of the platform services were detected. Our customer had a few CDP Public Cloud Environments on AWS, each of them with a Data Lake, a few Data Hubs, and a few Cloudera Experiences (also referred to as Cloudera Data Services).
For clusters managed by Cloudera Manager (i.e. Data Lakes and Data Hubs in the Public Cloud form factor, and Base Cluster in the Private Cloud / on-prem form factor), one can configure health alerts in the Cloudera Manager UI as described in the Cloudera documentation. Once the alerts have been configured, admins will receive emails whenever there is a service experiencing issues.
However, for Cloudera Experiences there is no out-of-the-box solution to configure health alerts, so we had to come up with one ourselves, and we did so using only existing features in Experiences! While the solution has only been applied to Experiences in the Public Cloud form factor, in principle it should work for Experiences in the Private Cloud form factor too.
Cloudera Experiences
Before we dive into our solution, let’s take a quick look at Cloudera Experiences. One of the latest and greatest additions to Cloudera Data Platform, Cloudera Experiences are compute resources running on Kubernetes (K8s) that, thanks to Cloudera SDX, have integrated security with a Cloudera base cluster (or a data lake in the Public Cloud) that is in charge of storage and metadata management. Cloudera Experiences boast a complete separation of storage and compute, scalable separately, with the following offerings:
- Cloudera Data Engineering (CDE) – Run Spark jobs and orchestrate them with Airflow on auto-scaling virtual clusters using Yunikorn.
- Cloudera Data Warehouse (CDW) – Create Hive or Impala data warehouses or data marts and run queries using isolated compute resources.
- Cloudera Machine Learning (CML) – Use Collaborative Machine Learning workspaces with the same experience as the Cloudera Data Science Workbench.
- Cloudera DataFlow (CDF) – Run NiFi flows “as a service”.
- Cloudera Operational Database (COD) – Create auto-scalable operational databases (HBase).
While the Cloudera Experiences were initially created in the Public Cloud form factor, they are also starting to be released on the Private Cloud form factor (only the first three are available on Private Cloud at the time of writing).
Health Alerts in Cloudera Experiences
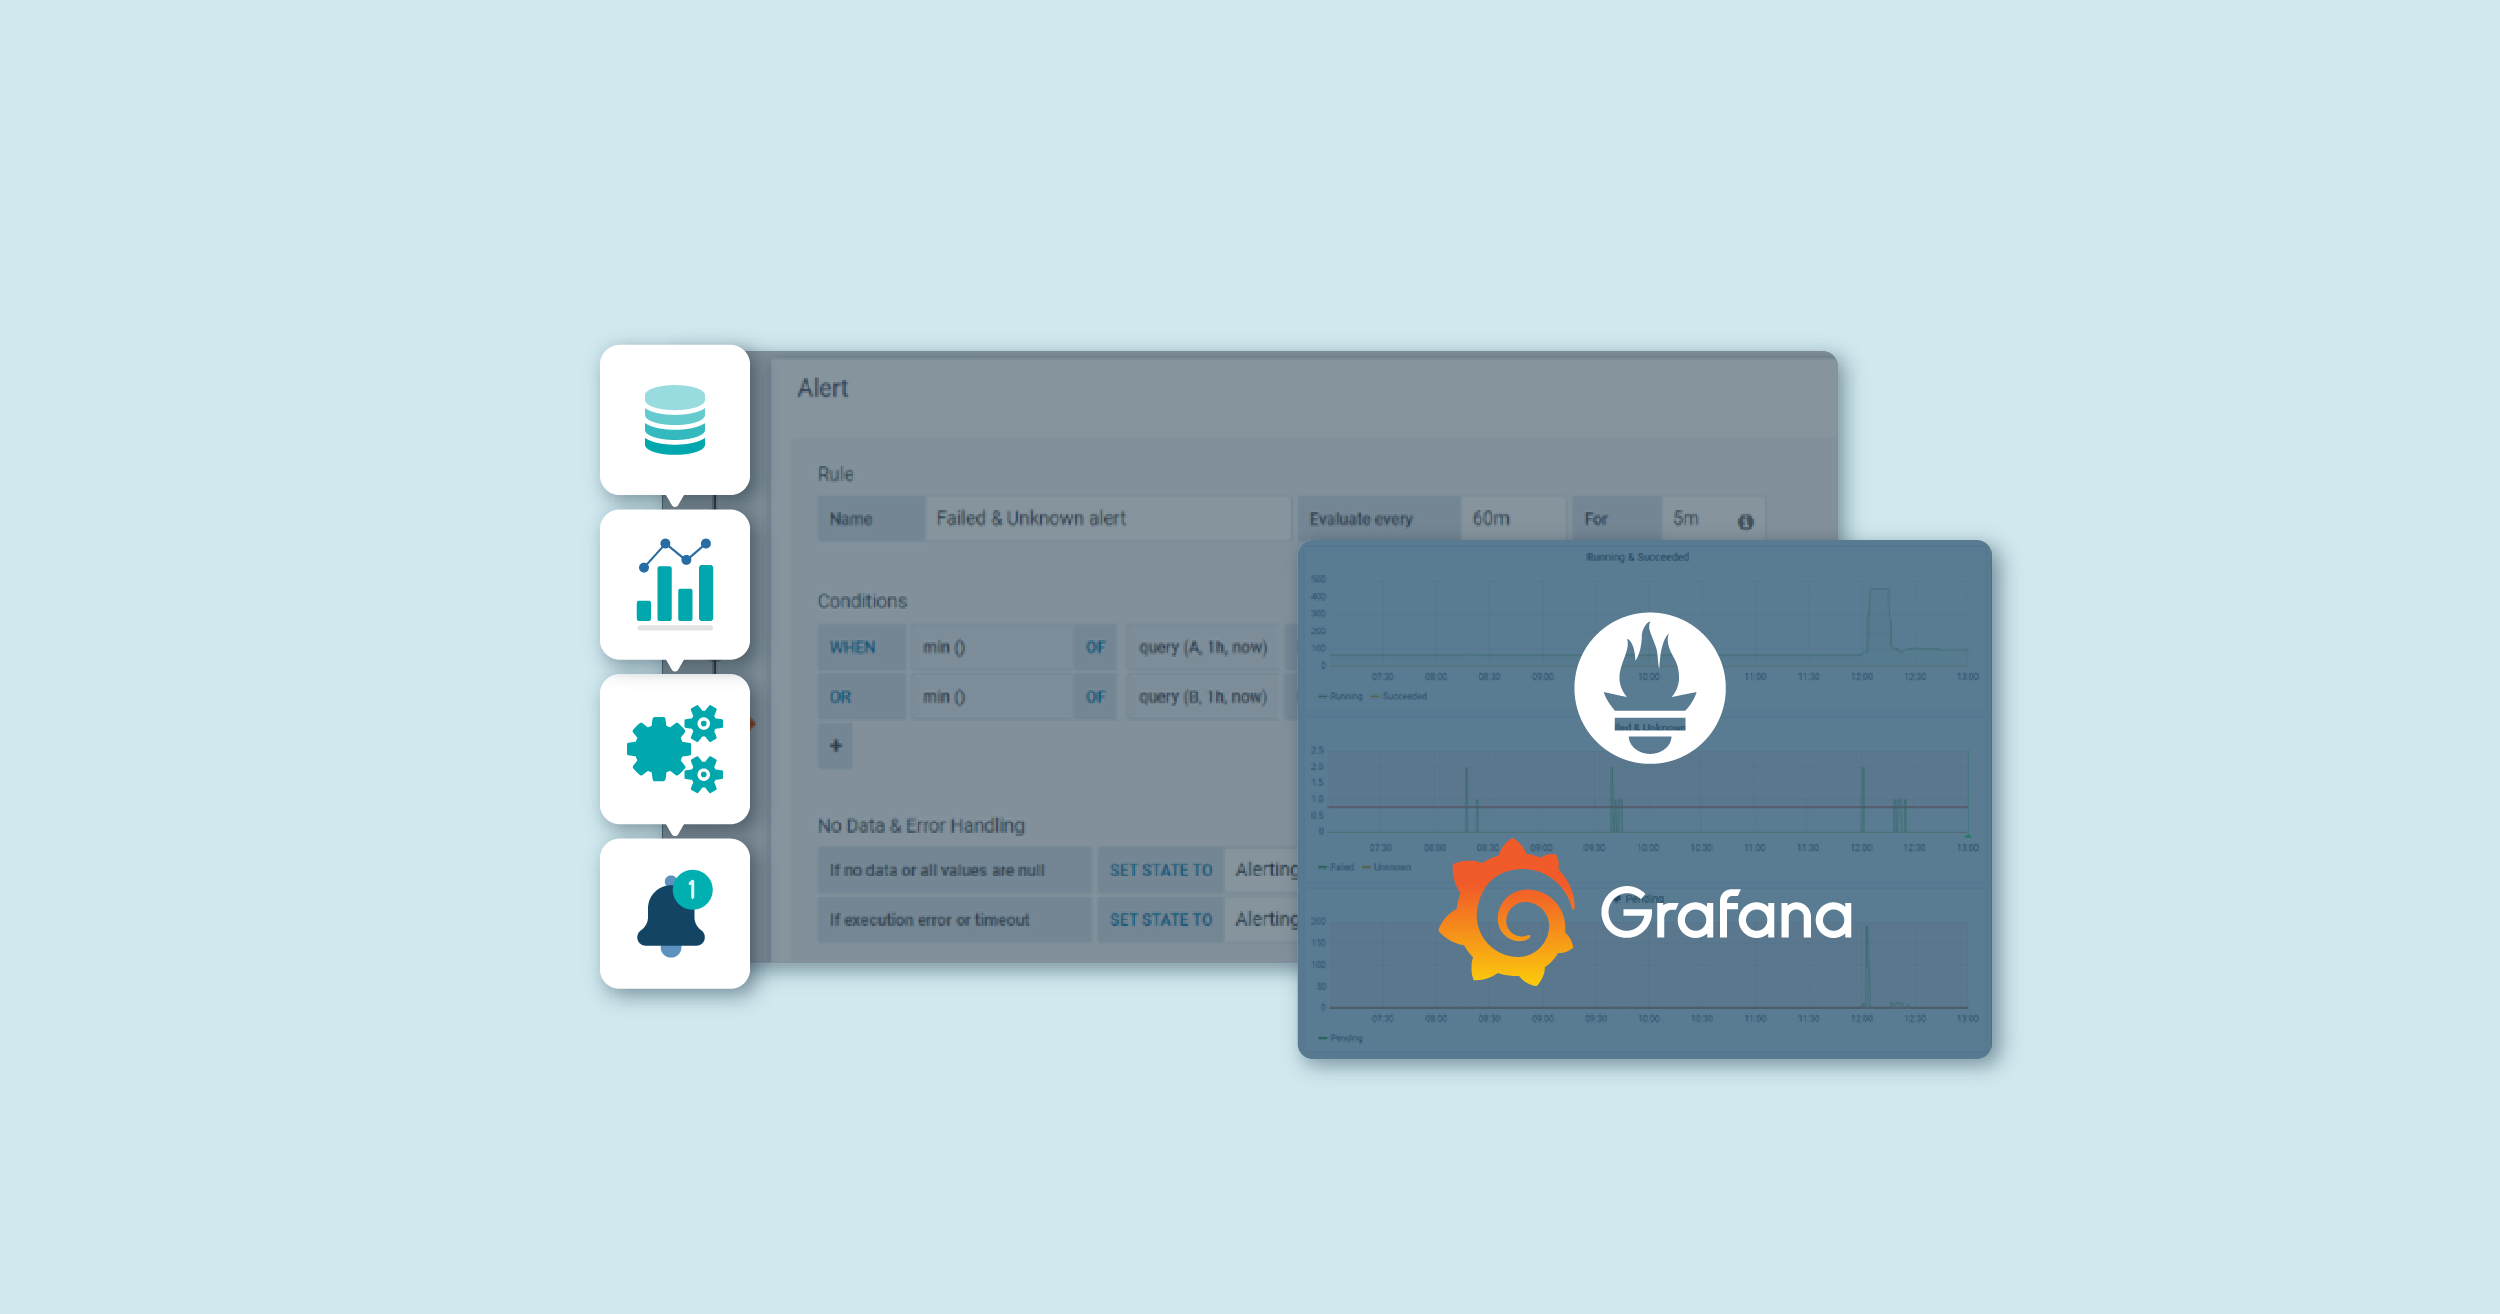
Now that we have done the introductions, let’s see how we implemented the health alerting system for Cloudera Experiences. To determine the health of Cloudera Experiences in the CDP Public Cloud, we use two key components that are available in any Cloudera Experience Kubernetes deployment: Prometheus and Grafana. The former is an open-source monitoring framework that is used to provide monitoring capabilities to Kubernetes, whilst the latter is a visualisation tool to create dashboards.
In any Cloudera Experience, Prometheus collects all sorts of metrics from the underlying K8s cluster; Grafana is preconfigured out-of-the-box with Prometheus as a data source.
Our solution is based on first finding the Prometheus metrics among the hundreds available to give health information, then creating Grafana dashboards from them, and finally configuring Grafana alerts on the created dashboards.
We need metrics that can help us to determine when there is a health issue, so we will use the kube_pod_status_phase metric. We can use this metric to determine the pod phase of all the pods in a cluster.
For health monitoring we will use the following queries:
sum(kube_pod_status_phase{phase="Running"})
sum(kube_pod_status_phase{phase="Succeeded"})

sum(kube_pod_status_phase{phase="Failed"})
sum(kube_pod_status_phase{phase="Pending"})
sum(kube_pod_status_phase{phase="Unknown"})
These queries will tell us the current number of pods running correctly, as well as the number of pods that have succeeded, failed, are pending or have an unknown status.
In normal operation (no issues) all pods will be in the running phase, although there may also be some pods in the succeeded phase. At certain moments there can also be some pods in the pending phase, but these should be for very short moments. If there are pods stuck in the pending phase for a long time, or in the failed or unknown phase, we can conclude that there may be some issues in the services running on the cluster.
Using Grafana alerting capabilities, we will configure alerts to notify us whenever there is at least one pod pending, failed, or unknown for a reasonable time – more than an hour (a pod pending for more than an hour is not normal).
Grafana supports sending alerts by email, but in order to do so, one needs to make some configuration changes using the Kubernetes CLI (kubectl). In addition to email, Grafana also supports sending alerts via other types of channels such as Microsoft Teams or Slack, and configuring alerts for channels like Microsoft Teams is actually much easier than for emails. Below we are going to show you how to configure alerts using Teams, but at the end of the article we are also going to give you some pointers on the steps needed to configure alerts via email.
Steps to Configure Alerts with Microsoft Teams
Here are the steps to follow to configure health alerts in Cloudera Experiences to be received in Microsoft Teams. Note that we have tested and implemented this in CDE, CDW and CML Experiences on Public Cloud, but the same procedure (or very similar) should also work for the other types of Experiences (CDF and COD):
- If you haven’t already done so, create a channel in a Microsoft Teams Team that your CDP admins use. As best practice, create one channel per CDP environment.
- Name the channel “[ENV name] Experiences Health Alerts”.
- Once created, click on the 3 dots, and select Connectors.
- Search for “Incoming Webhook” and click on Configure.
- Name the webhook as “GrafanaWebhook”.
- Click on Create and copy the URL – you will need it later.
- Log in to Grafana:
- In CDE – In the Overview page in the CDE web UI, select the CDE service for which you want to create the alerts, click on the 3 dots, and select “Grafana Charts”. Use default credentials (the UI prompts to change the password in the first login) – note that your user must have the DEAdmin role to be able to edit Grafana.
- In CDW – In the Overview page in the CDW web UI, expand the Environments, and for the CDW Service/Environment for which you want to create alerts, click on the 3 dots and select “Open Grafana”. The credentials are your user and workload password – note that your user must have the DWAdmin role to be able to edit Grafana.
- In CML – In the ML Workspaces page in the CML web UI, click on the 3 dots under Actions and select “Open Grafana” for the CML workspace/service you want to create alerts for. If your user has the MLAdmin role, you will automatically be logged in as admin user in Grafana.
- Click on the Alerting/Notifications Channels option in the left menu and:
- Click on New Channel.
- Select Type Microsoft Teams.
- Name the channel as you want.
- Paste the URL from Step 1.
- Enable all options except “Disable Resolve Message”.
- You might want to change reminders to 60 minutes.
- Send Test message and check in Teams if the message has been received.
- Click on Save.
- Click on the + option in the left menu to create a new Dashboard (the steps below are for CDE and CML; CDW has a slightly more up-to-date Grafana and the UI is a bit different so the exact steps may vary a bit). Then:
- Click on “Add Query” in the panel that is created by default.
- Select Change from “Default” to “Prometheus” in the Data Source selector.
- Add the queries A and B:
A: sum(kube_pod_status_phase{phase="Running"})
B: sum(kube_pod_status_phase{phase="Succeeded"})

- If you haven’t already done so, create a channel in a Microsoft Teams Team that your CDP admins use. As best practice, create one channel per CDP environment.
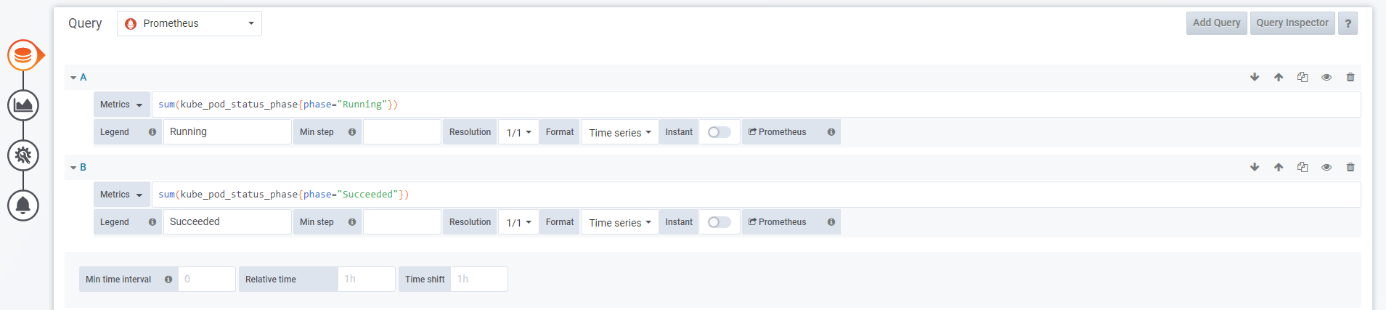
Enter “Running” and “Succeeded” in the Legend fields respectively; leave the rest of params with the default values:
- Move to the visualisation tab – you can leave the default graph.
- Move to the General tab and enter “Running & Succeeded” as the title.
- For this 1st panel we will not create any alerts.
- Click on the Save Dashboard button and enter the name of the Dashboard “Kubernetes Pod Status Phase”.
- In the upper-right menu, click on “Add Panel” and drag & drop to the bottom of the dashboard.
- Click on “Add Query” in the new panel.
- Select Prometheus data source and add the queries A and B:
A: sum(kube_pod_status_phase{phase="Failed"}) B: sum(kube_pod_status_phase{phase="Unknown"}) - Put “Failed” and “Unknown” as the legends respectively.
- Put “Failed & Unknown” as the title (in the General tab).
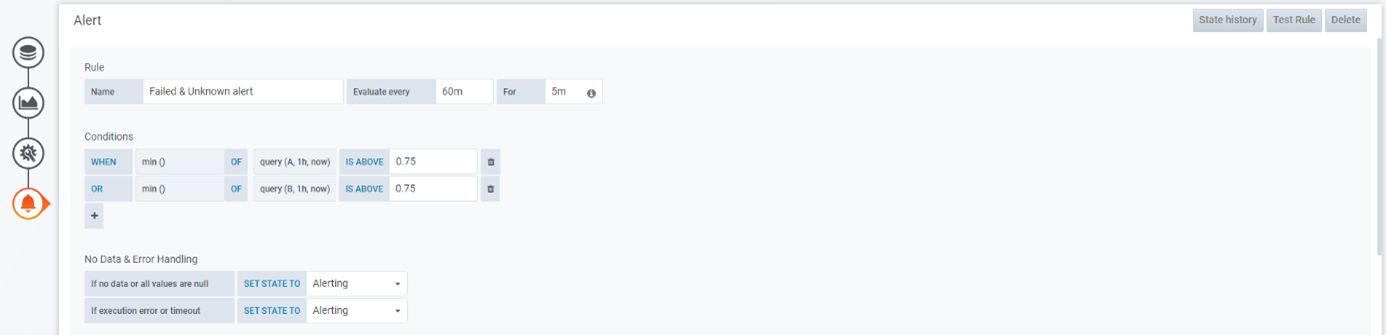
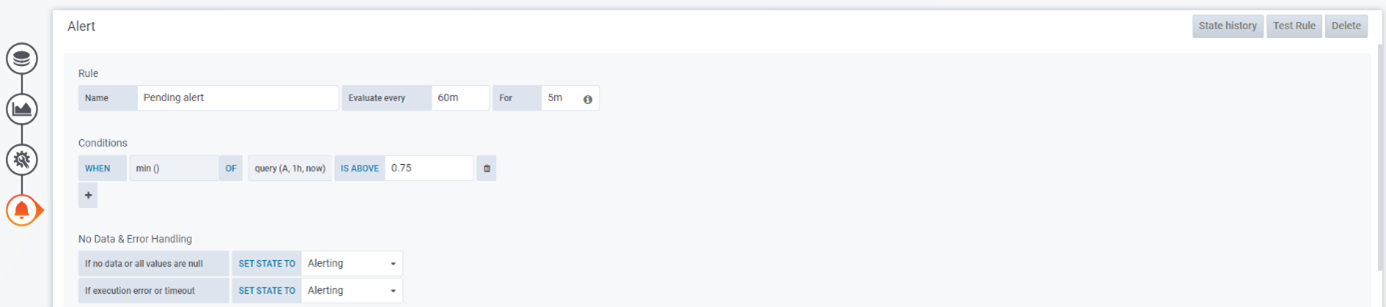
- Go to the Alerts tab and click on Create Alert.
- As “Evaluate every” put 60 minutes – this will evaluate the queries every hour.
- In “For” put 5 minutes, to wait 5 minutes before starting to send alerts.
- Add the following conditions (remember to switch from AND to OR):
WHEN min () OF query (A, 1h, now) IS ABOVE 0.75
OR min () OF query (B, 1h, now) IS ABOVE 0.75
- Change the “If no data or all values are null” to Alerting:

- Change the “If no data or all values are null” to Alerting:
- In the Notifications select the channel you created in Step 3.
- Set as the message:
- For CDE: There are more failed or unknown pods than expected in CDE service [service name].
- For CDW: There are more failed or unknown pods than expected in CDW service [service name].
- For CML: There are more failed or unknown pods than expected in CML service [service name].
- Click on Save Dashboard.
- In the upper-right menu, click again on “Add Panel” and drag & drop to the bottom of the dashboard.
- Click on “Add Query” in the new panel.
- Select Prometheus data source and add the query A:
A: sum(kube_pod_status_phase{phase="Pending"})
- Put “Pending” as the legend.
- Put “Pending” as the title (in the General tab).
- Go to the Alerts tab and click on Create Alert.
- As “Evaluate every” put 60 minutes – this will evaluate the queries every hour.
- In “For” put 5 minutes, to wait 5 minutes before starting to send alerts.

Add the following condition:
WHEN min () OF query (A, 1h, now) IS ABOVE 0.75
- Change the “If no data or all values are null” to Alerting.
- In the Notifications select the channel you created in Step 3.
- Set as the message:
- For CDE: There are more pending pods than expected in CDE service [service name].
- For CDW: There are more pending pods than expected in CDW service [service name].
- For CML: There are more pending pods than expected in CML service [service name].
- Click on Save Dashboard. After finishing, the dashboard will look like this:

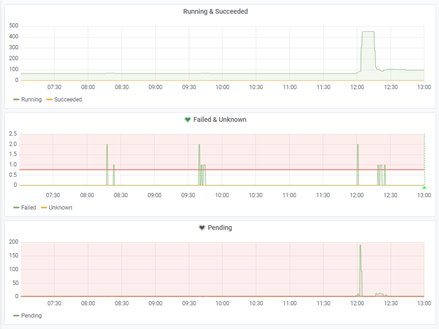
Remarks
As commented above, in principle, if the Experience / Service is healthy, there should only be K8s pods in a failed, unknown, or pending phase for very short periods of time (like in the above example image). In our solution, if the number of pods failed, unknown or pending is at least 1 (higher than 0.75) for more than an hour, then this would mean there is maybe some health issue.
In our case, after deploying the alerting mechanism in a few services and environments and monitoring the solution for a few weeks, there were a couple of occasions when we had some pods stuck in pending for a few hours, thus raising an alert, without having a negative effect on the cluster and later fixing itself; we could say that there are “false positives” in our current alerting system.
However, there was also an occasion in CDW Service in which one pod was stuck in pending and the Catalog was working erratically, and we had to restart the pod to fix the issue (accessing with kubectl from a VM with access to the K8s cluster, AWS EKS in our case). This time, we got the alert and could fix the issue quickly. So, while there can be false positives with the above alerting rules, we believe them to be a good starting point. However, as we use them more and more, we might fine-tune the rules (or maybe add new rules based on other Prometheus metrics). Feel free to do the same (and share your findings!).
Pro Tips
If you liked the solution we have presented in this blog, you might also be interested in the pro tips below:
Steps to Configure Email in Grafana
While we have demonstrated above how to use Microsoft Teams for the alerts, the truth is that most organisations will still prefer the good old email alert. Please find below the steps to configure Grafana to send emails.
To configure Grafana to send emails, we need to modify the Grafana configuration file. This is not possible using the Grafana UI and we need to use kubectl tool. The steps below must be done from a VM with kubectl access to the underlying K8s cluster of the Experience/Service (AWS EKS in our case).
- Edit grafana.ini configmap:
kubectl edit configmap istio-grafana-conf -n istio-system
- Add [smtp] section as per Grafana docs. The SMTP section should look like this:
[smtp]
enabled = true
host = [SMTP HOST]:5[SMTP PORT]
user = [EMAIL ADDRESS]
password = [PASSWORD]
;cert_file =
;key_file =
skip_verify = true
from_address = [EMAIL ADDRESS]
from_name = Grafana
# EHLO identity in SMTP dialog (defaults to instance_name)
;ehlo_identity = dashboard.example.com
- Save and quit the editor.
- Delete grafana pod in the istio-system namespace:
kubectl get pods -n istio-system
kubectl delete pod  -n istio-system
- Wait a few seconds before the pod is automatically restarted.
- Go to the Grafana UI and add an email notification channel specifying the list of destination addresses.
Export Dashboard
If you need to configure an alerting system like the one we have described in this blog post for various Experiences and/or various Environments, we suggest you do it in only one of them, and then export the dashboard and import it to the rest. To export a dashboard, once it is in the first Experience, click on the “Share” action and select Export. Enable “Export for sharing externally”, then download the JSON file.
To import the dashboard to another Experience, just open Grafana and hover over the + button but instead of Create, click on Import and select the JSON file. Before doing so, we recommend creating the channel (of whatever type you are using) so that when you import the dashboard it gets preconfigured with the proper channel; note that the channel is not created automatically when a dashboard is imported. Also review the imported dashboard, especially the alerts: first, make sure the channel is properly configured and second, update the message accordingly.
Conclusions
In this blog post we have run through a solution to configure health alerts in the Cloudera Experiences (or Data Services) so that you can have health alerts for all your Cloudera resources, not only the ones managed by Cloudera Manager.
At ClearPeaks, we are proud to be recognised as one of the top Cloudera partners, and we have a great team of Cloudera experts ready to help you with your Cloudera projects, so do not hesitate to contact us if you need support. We will be delighted to help you!