11 May 2023 DataWash: An Advanced Snowflake Data Quality Tool Powered by Snowpark – Part 2
Welcome to the second part of our mini-series on DataWash, the advanced Snowflake data quality tool powered by Snowpark. In the first part we introduced you to DataWash and its key features, and saw how it can help you ensure high-quality data in your Snowflake data warehouse. Now, in this second part, we will dive deeper into the technical details and see how it works behind the scenes: we’ll explore how Snowpark enables DataWash to perform complex data quality checks and transformations at scale, and see how you can customise and extend the tool to meet your specific needs.
We’ll also look at how the different DataWash modules work together to provide a comprehensive data quality analysis, and then show you how to interpret the results to improve data quality in your Snowflake environment.
By the end of this blog post, you will have a comprehensive understanding of its inner workings, as well as what knowledge and tools you need to use it effectively in your data quality management work. So, let’s dive in and explore the power of DataWash!
Modules
DataWash is a powerful tool that offers a set of modules to ensure high-quality data for businesses, each of which is designed to perform a specific task. These modules are designed to help organisations identify and correct data inconsistencies, inaccuracies, and duplicates, among other issues. Below, we can see the different modules provided by DataWash, their functionalities, and how they can be used to enhance overall data quality:
Categorical Check
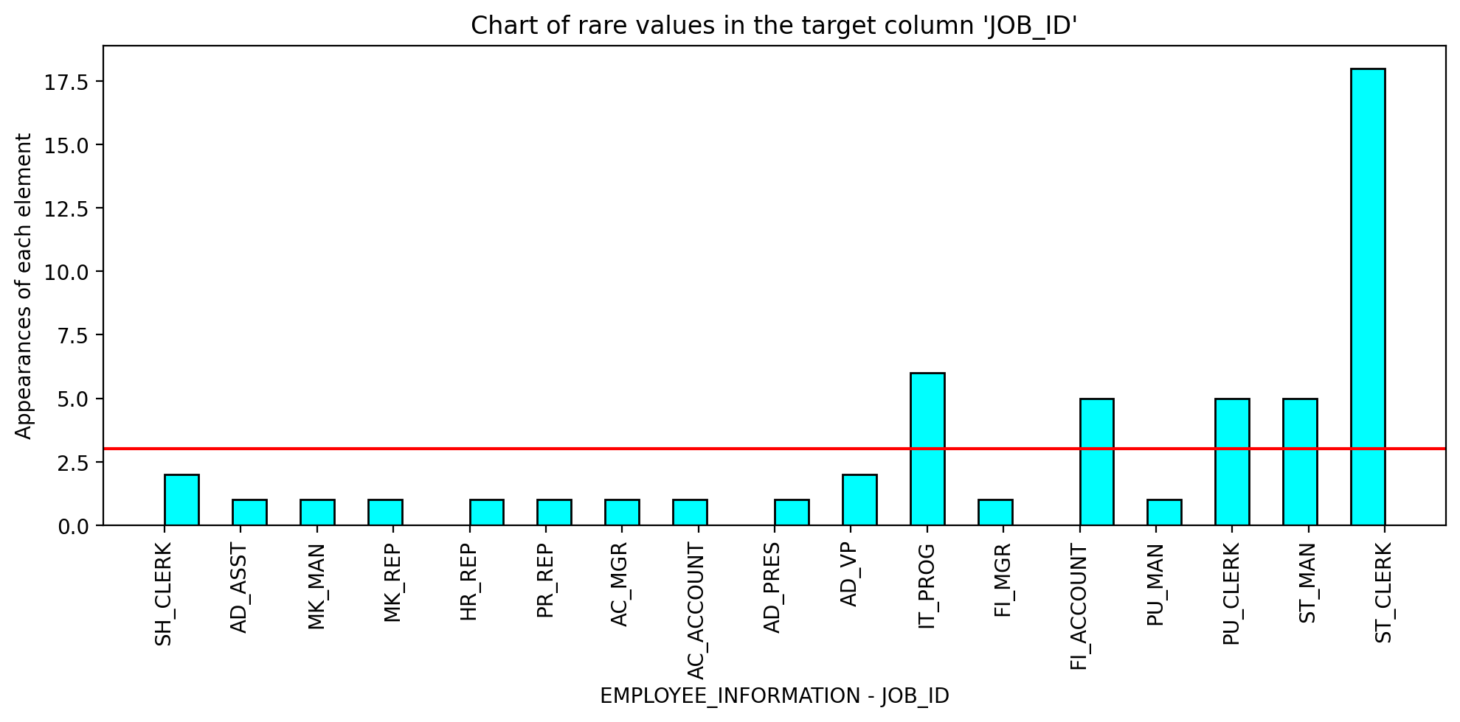
This module is used to detect outliers in categorical fields. The software works by identifying unique or rare values in a target column that the user specifies. These values are then flagged as warnings for the user to review. The user sets a threshold for what constitutes a rare value, and any values that occur less frequently than the threshold will be considered rare and flagged. For example, if there are 1,000 instances of the city “Barcelona” and only two instances of “Brcelona,” the software would detect this as a typo and flag it.
Correlation Check
The Correlation Check module is used to analyse the relationship between two columns of data. The user specifies the two columns they wish to analyse, and the software calculates the correlation between them. Any rows with an outlier correlation will be flagged as warnings for the user to review. For example, if the user is analysing an employee’s salary and hours worked, and there is a disproportionate ratio between the two columns, the software would detect this and flag it.
Distribution Check
The Distribution Check module is used to determine if the distribution of a column has changed over time. The user specifies the column they wish to analyse, and the software compares the distribution at two points in time. Any changes in the distribution of the data will be flagged as warnings for the user to review.
Duplicate Check
The Duplicate Check module is used to detect duplicate rows in a dataset. The software scans the entire dataset to identify any duplicate rows and flags them as warnings for review.
Expected Range
The Expected Range module is used to verify that the data in a column falls within a specified range of values. The user specifies the column they wish to analyse and the expected range of values. If a higher percentage of values falls outside the expected range, the software will flag this.
Freshness Check
The Freshness Check module is used to monitor the frequency and volume of new data being added to a dataset. The user specifies the average frequency of data being added, and the software will flag any deviations from this average frequency. For example, if there is a sudden increase in new data being added, or a period without any new data, the software will detect this and flag it.
Like Count
The Like Count module is used to count the number of rows in a column that match a specified format. The user specifies the format they are interested in, and the software will count the number of rows in the column that match this format. The software will also flag any discrepancies or errors in the data as warnings for review.
Null Count
The Null Count module is used to count the number of null values in a specified column. The user specifies the column they wish to analyse, and the software will count the number of null values. Any discrepancies or errors in the data will be flagged.
Numeric Metrics
The Numeric Metrics module is used to perform basic mathematical calculations on the data in a dataset. The user specifies the column they wish to analyse, and the software will perform calculations such as average, maximum, minimum, mean, standard deviation, sum, and variance. The user can also set parameters for each calculation so that any values outside the expected range will be flagged.
Outlier Detector
This module uses an advanced outlier detection algorithm that checks if the data falls within a certain range. Instead of setting the range manually, the module learns the range based on the distribution of the data being collected; the more data that is collected, the more precise the range becomes. This module helps detect possible outliers in the data set and alerts the customer as soon as possible.
Outlier Length
This module checks the length of the values in a specified column to see if they fall within an expected range. The expected range is determined by calculating the average and standard deviation of a fixed number of preceding values. This module sends an alert whenever the length of a value falls outside the expected range.
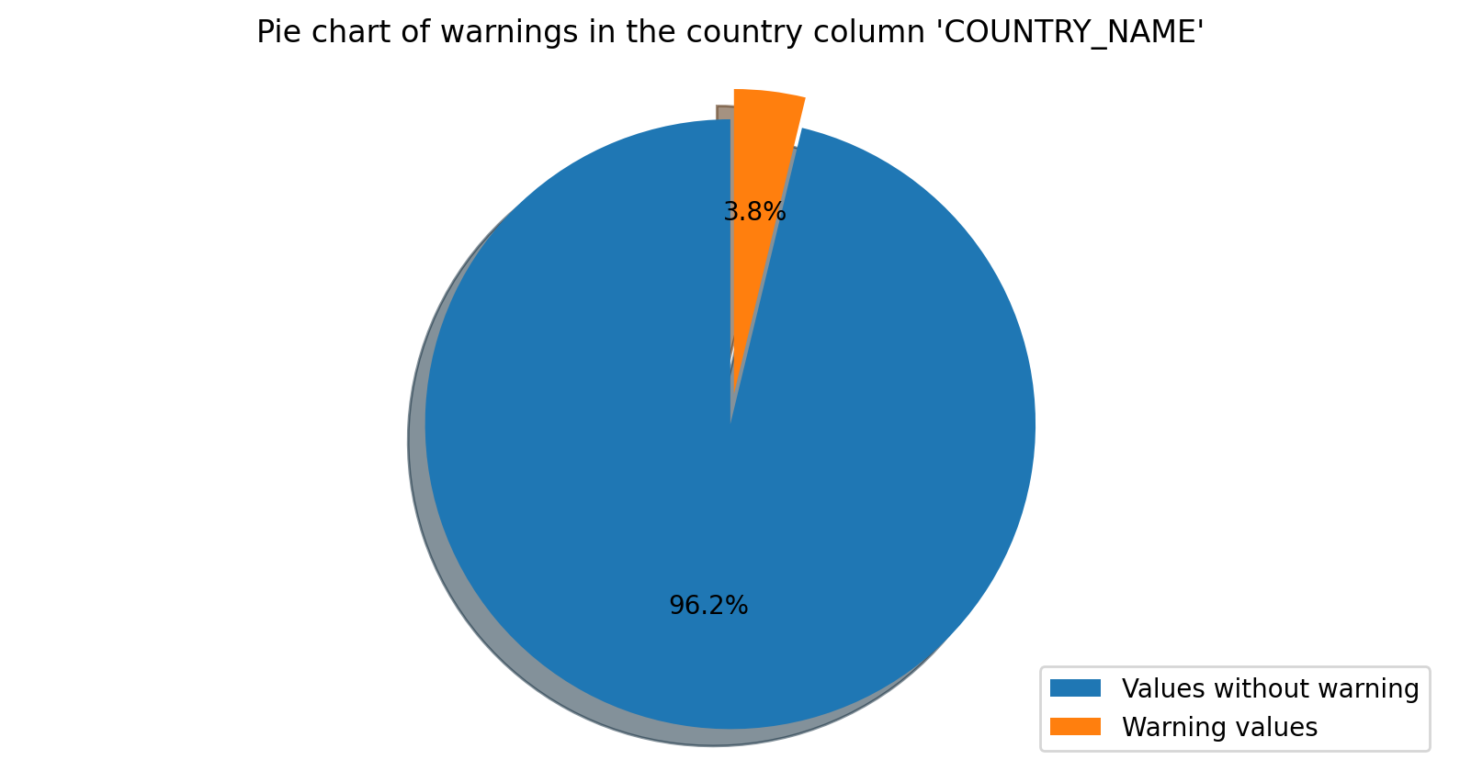
Verify Country
This module checks if the values in a specified column correspond to the names of actual countries. If any values are misspelt or do not correspond to a real country, the module will send a warning to the user.
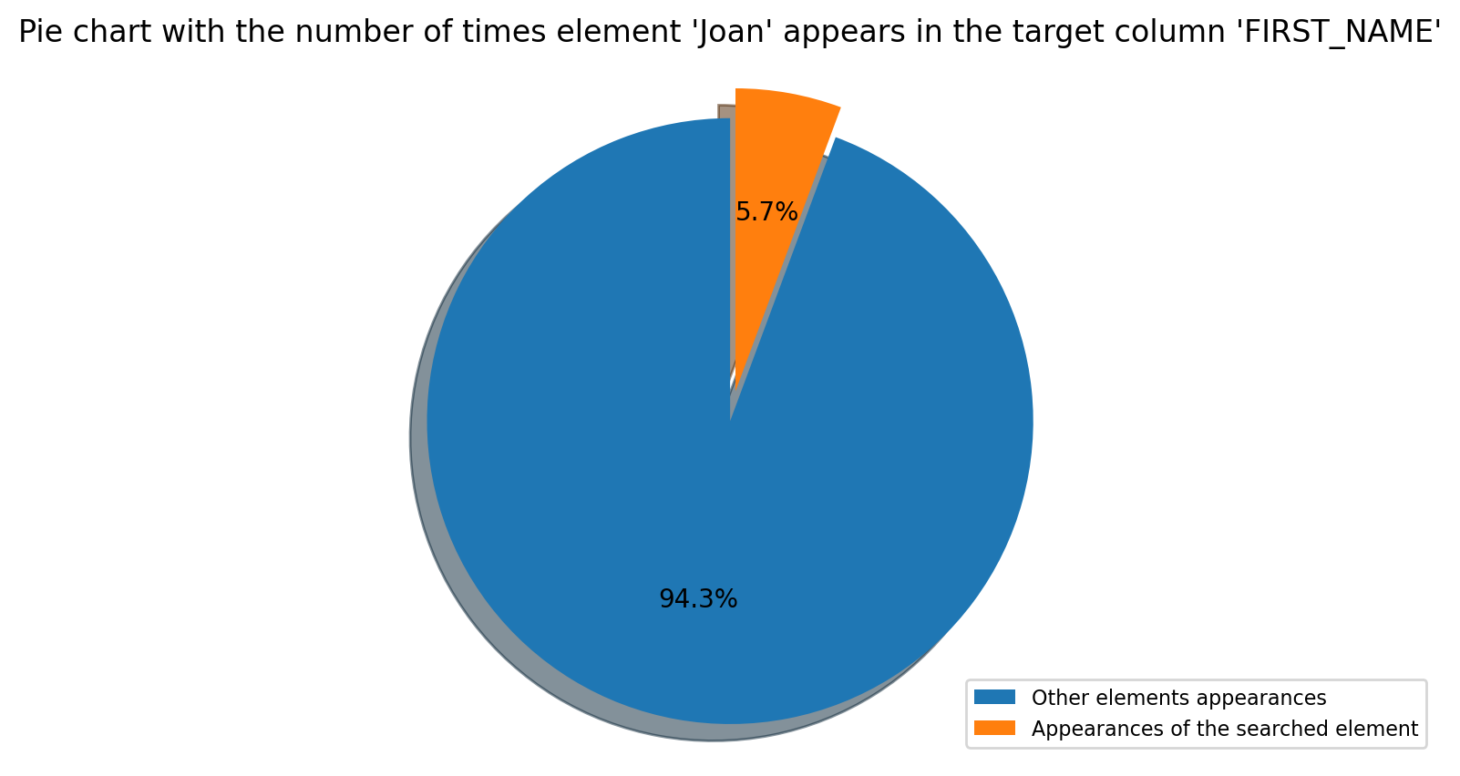
Verify Element
This module checks if a specified element or list of elements is present in a specified column. The module will return a positive result if the element is found, or a negative result if not.
Verify Email
This module checks if the values in a specified column correspond to valid email addresses. If any values are not valid email addresses, the module will send a warning to the user.

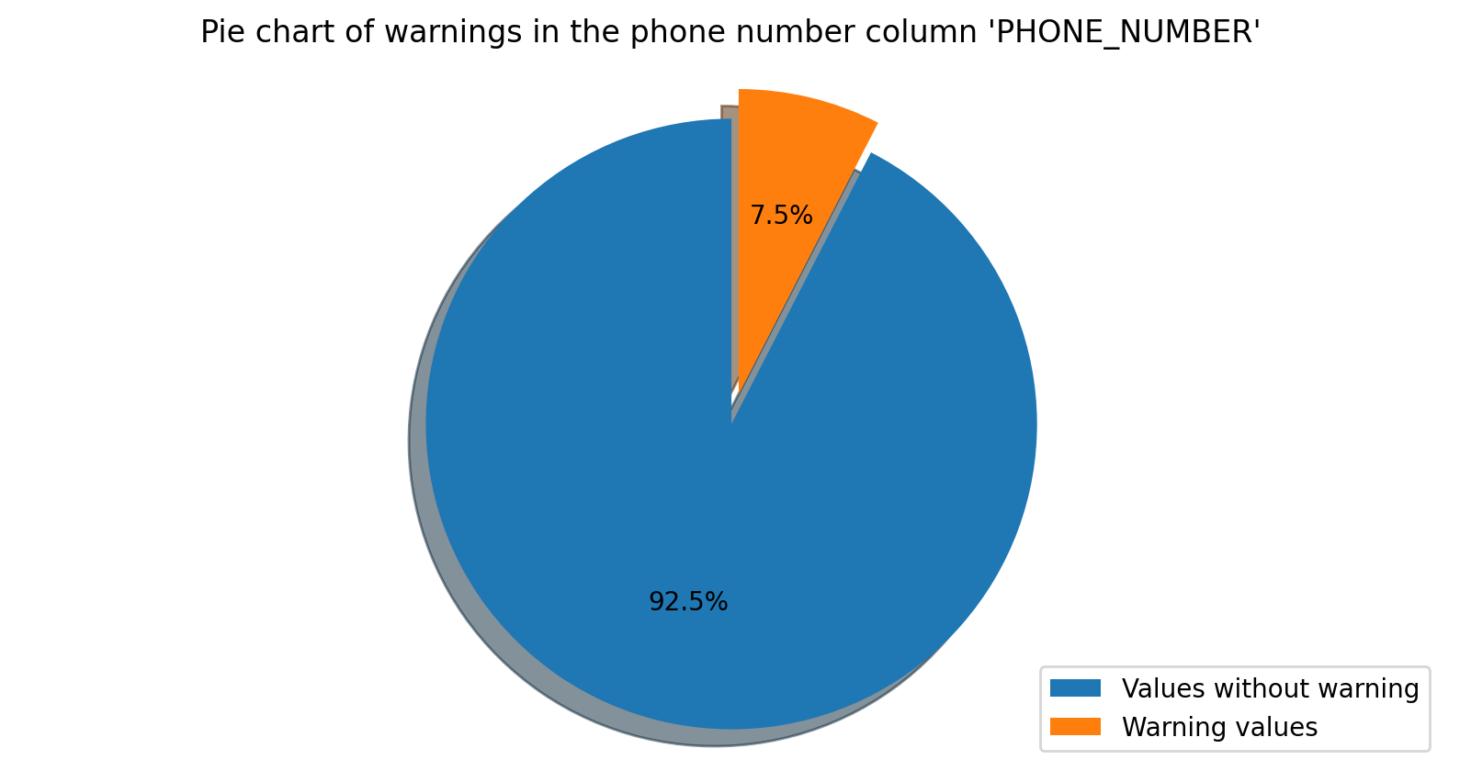
Verify Phone Number
This module checks if the values in a specified column correspond to valid phone numbers. If any values are not valid phone numbers, the module will warn the user.
Verify Website
This module checks if the values in a specified column correspond to existing websites or IP addresses. The module will make a connection to the specified websites/IP addresses, then verify the response to determine if they exist. If any values do not correspond to existing websites/IP addresses, the module will send a warning to the user.

Overall, DataWash is designed to help clean and validate data, ensuring that it is accurate and trustworthy. The tool’s modular architecture allows users to choose the specific modules they need to address their particular data quality issues.
Working Modes
The tool consists of two working modes: scheduled batch execution (JSON) and ad hoc/on-demand analysis using Streamlit (Configuration App).
Scheduled batch execution enables the batch processing of data quality modules through a JSON file configuration. This mode is ideal for organisations that require periodic data quality checks. The parameters of each module are configured through a JSON file, and each module has its own specific parameters to ensure its correct operation. The frequency of execution (daily, weekly, monthly, etc.) is determined according to the customer’s needs.
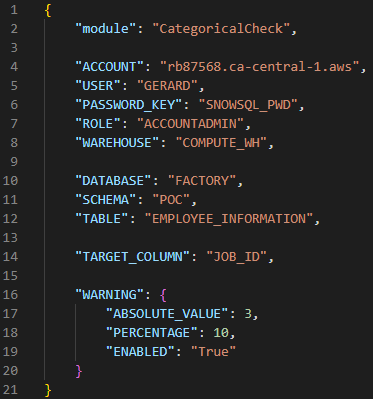
Figure 1: JSON configuration file with all the parameters of the Categorical Check module.
Once the execution is complete, a report containing the results of each module is generated, along with any warnings detected. The report provides a comprehensive view of the data quality status and any issues that need to be addressed; and in addition, generates graphs to help better understand the results and detect errors earlier. This allows businesses to identify and resolve data quality issues before they become major problems.
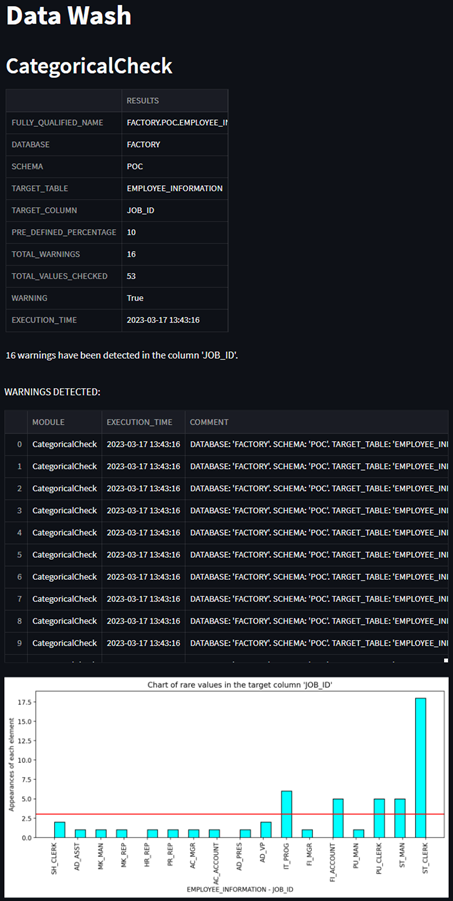
Figure 2: Report containing the result of the batch execution of the Categorical Check module.
The second working mode is the ad hoc/on-demand analysis. This allows real-time configuration and the execution of data quality modules through a Streamlit app. This component is ideal for companies or institutions that require on-demand data quality checks. Streamlit generates a web app in which the parameters of each module are then configured in real time via the user interface.
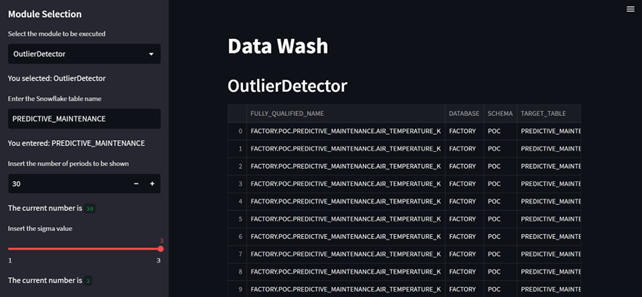
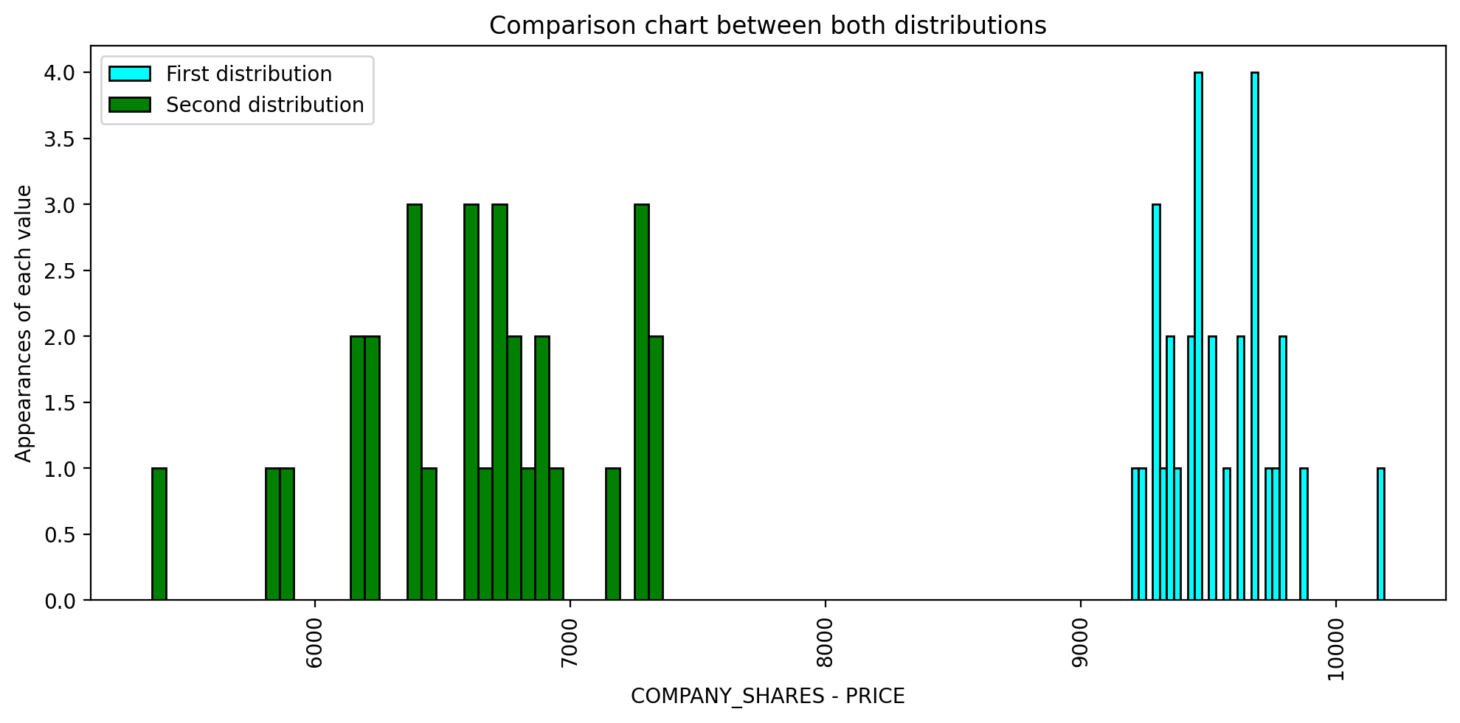
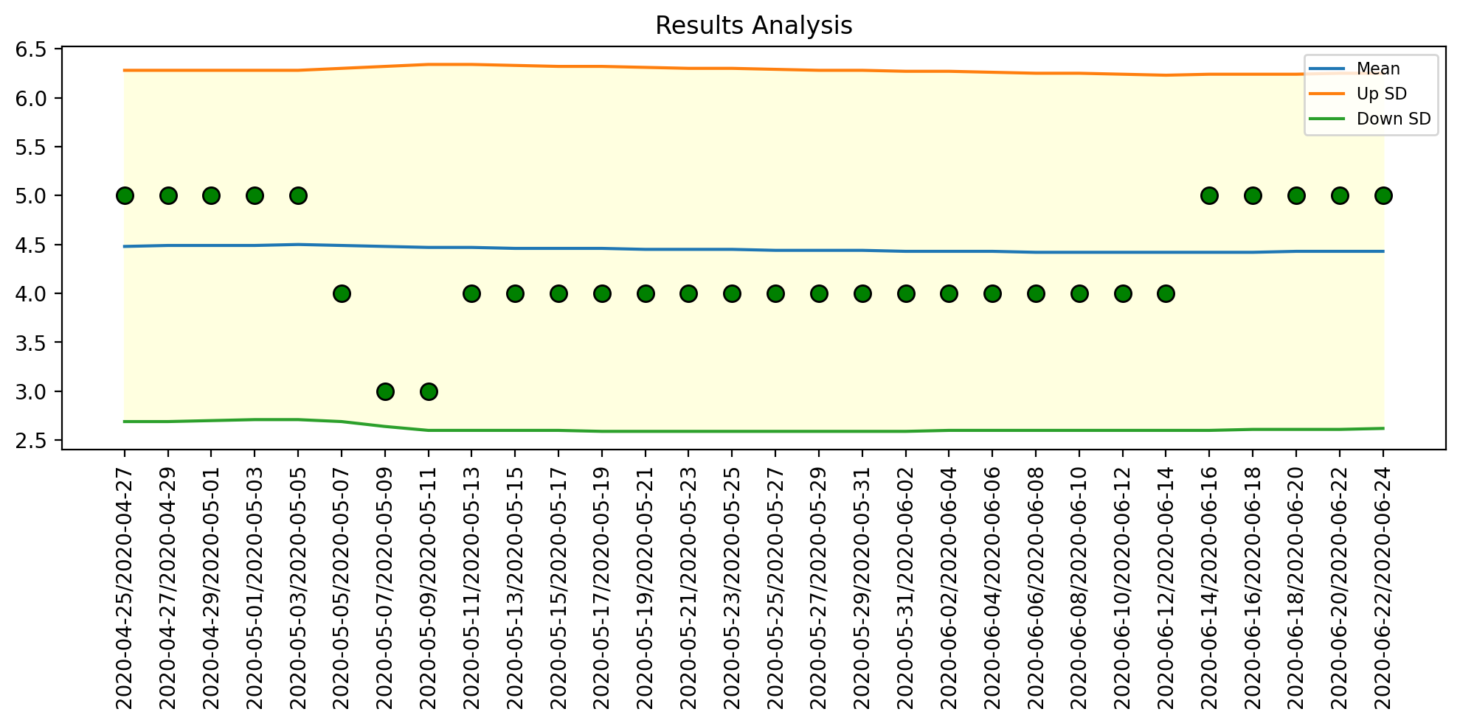
Figure 3: Result of ad hoc / on-demand analysis via Streamlit (Configuration App) for the Outlier Detector module.
Once the parameters of the module to be executed have been configured, a report is generated with the results of that specific module:
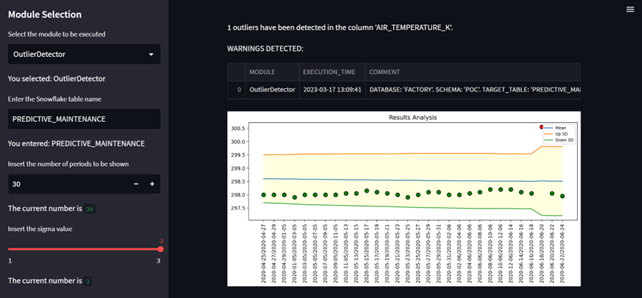
Figure 4: Ad hoc / on-demand analysis graphs via Streamlit (Configuration App) for the Outlier Detector module.
The ad hoc/on-demand analysis mode provides organisations with a flexible and customisable way for both business users and power users, perhaps lacking in technical knowledge, to create their own checks. The real-time configuration of the modules allows data quality checks whenever and wherever they are needed.
As we have seen, DataWash provides a comprehensive and flexible data quality solution that can be tailored to specific needs. The tool’s two working modes enable regular, periodic data quality checks, as well as on-demand checks, to ensure the accuracy and reliability of data.
Power BI Report Automatically Generated from Each Scheduled DataWash Execution
One of DataWash’s key features is the ability to generate a Power BI report that can help users to easily visualise and analyse the results of their data quality assessments. The Power BI report consists of three main sections: the landing page, the warnings page, and the module analysis pages. The landing page provides a brief overview of DataWash, including its purpose and key features. It also includes a summary of the warnings generated during its last execution, as well as a status indicator that shows whether the last execution was successful or not.
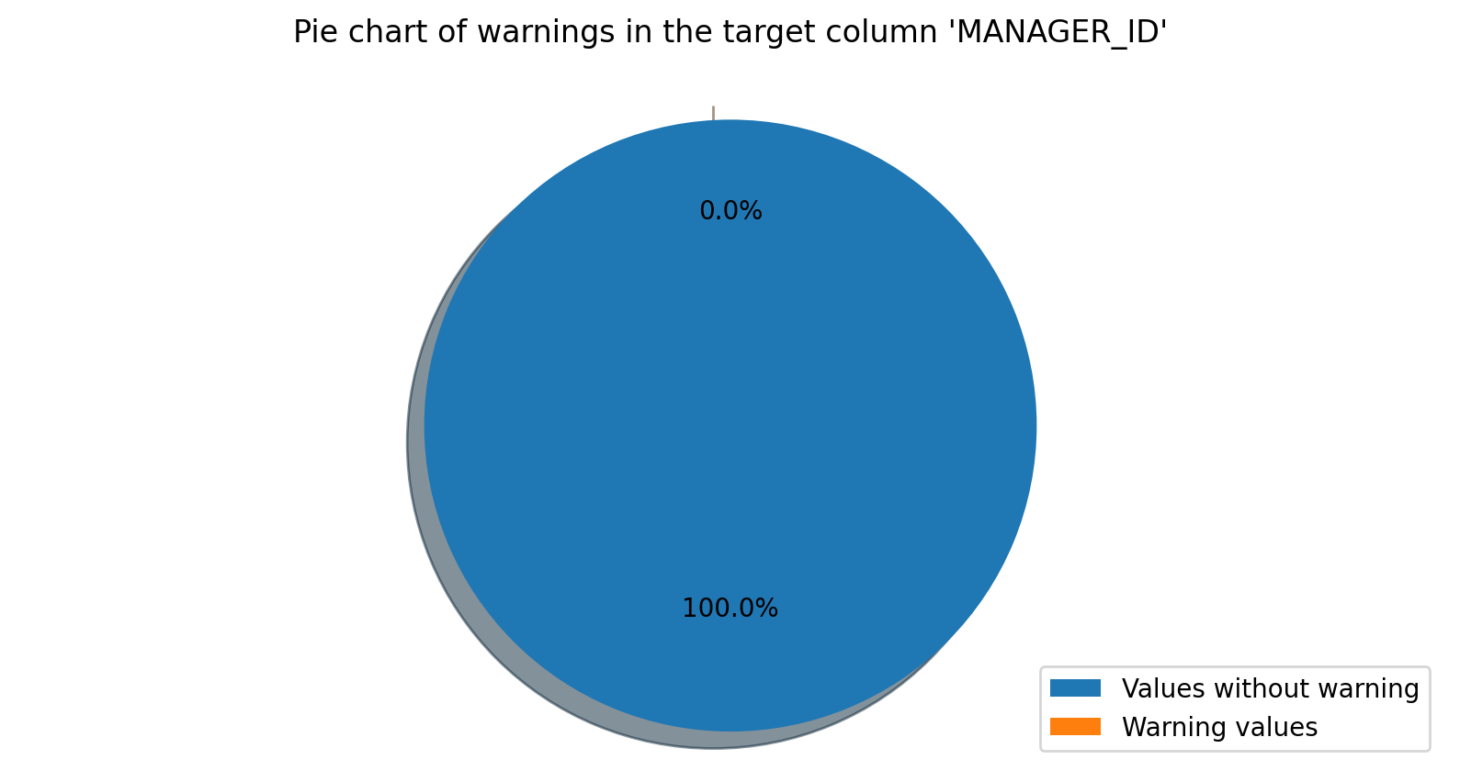
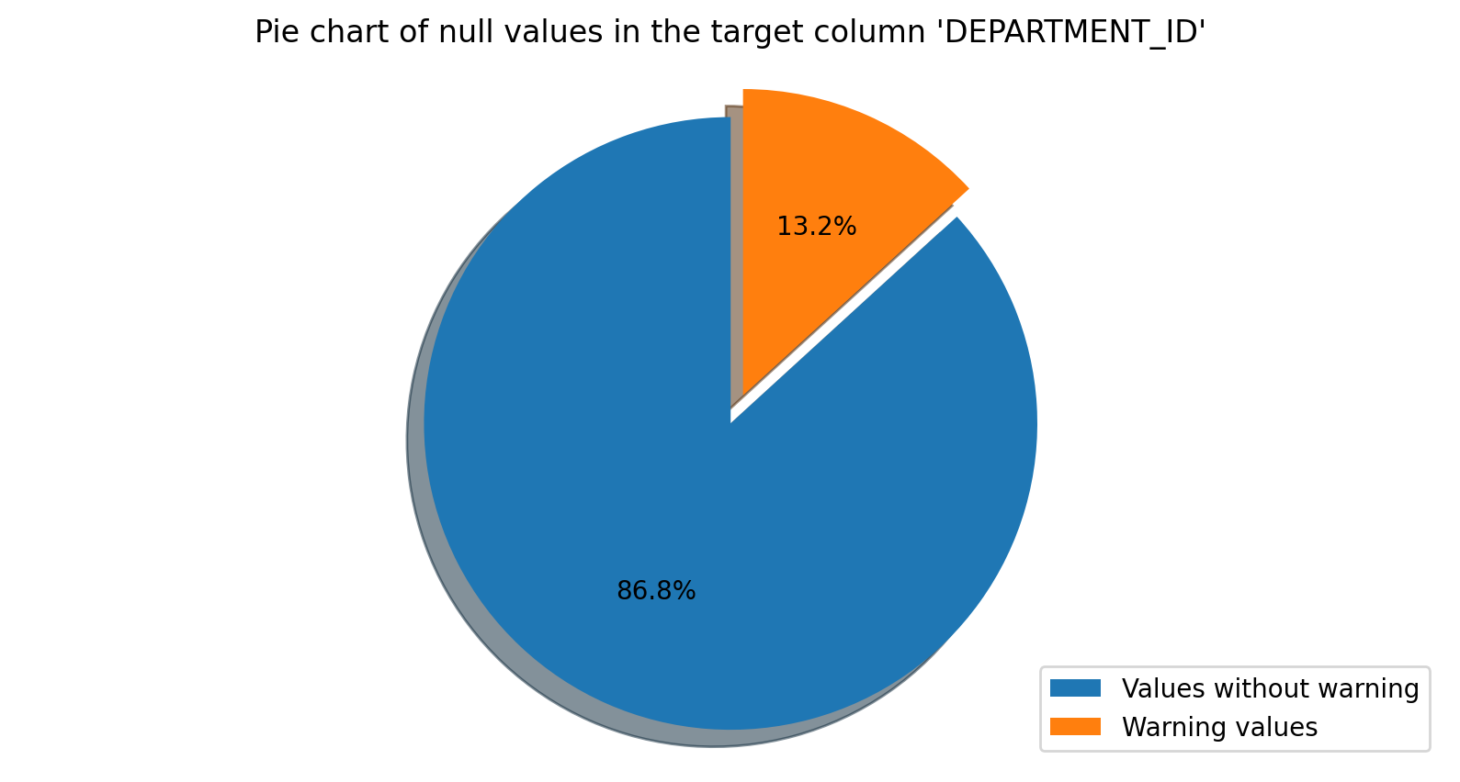
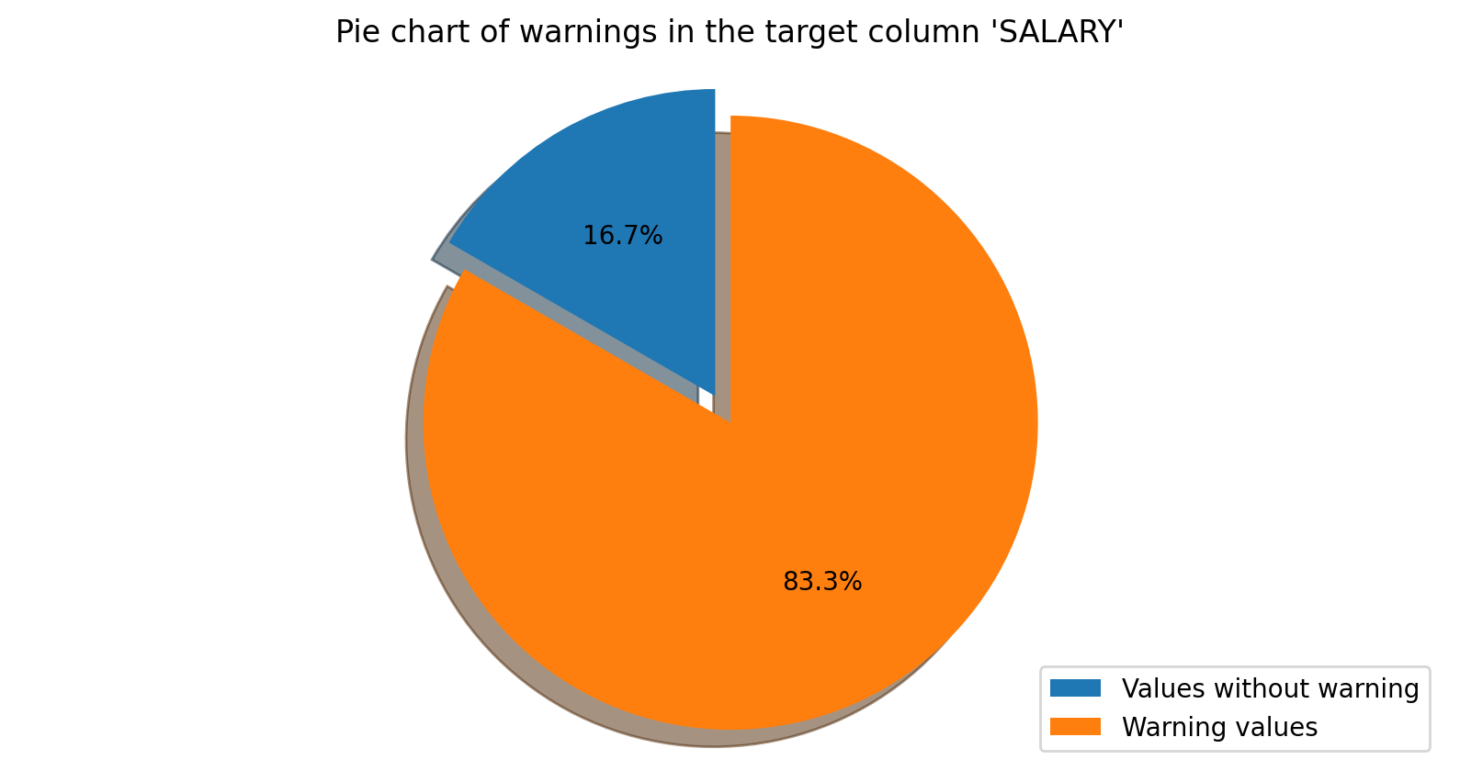
The warnings page provides a detailed analysis of all warnings generated during the last execution, including a table that lists them all, along with information such as the module that generated the warning, the severity of the warning, and the description of the issue. Users can filter the warnings by severity or module, and they can also export the table to Excel for further analysis.
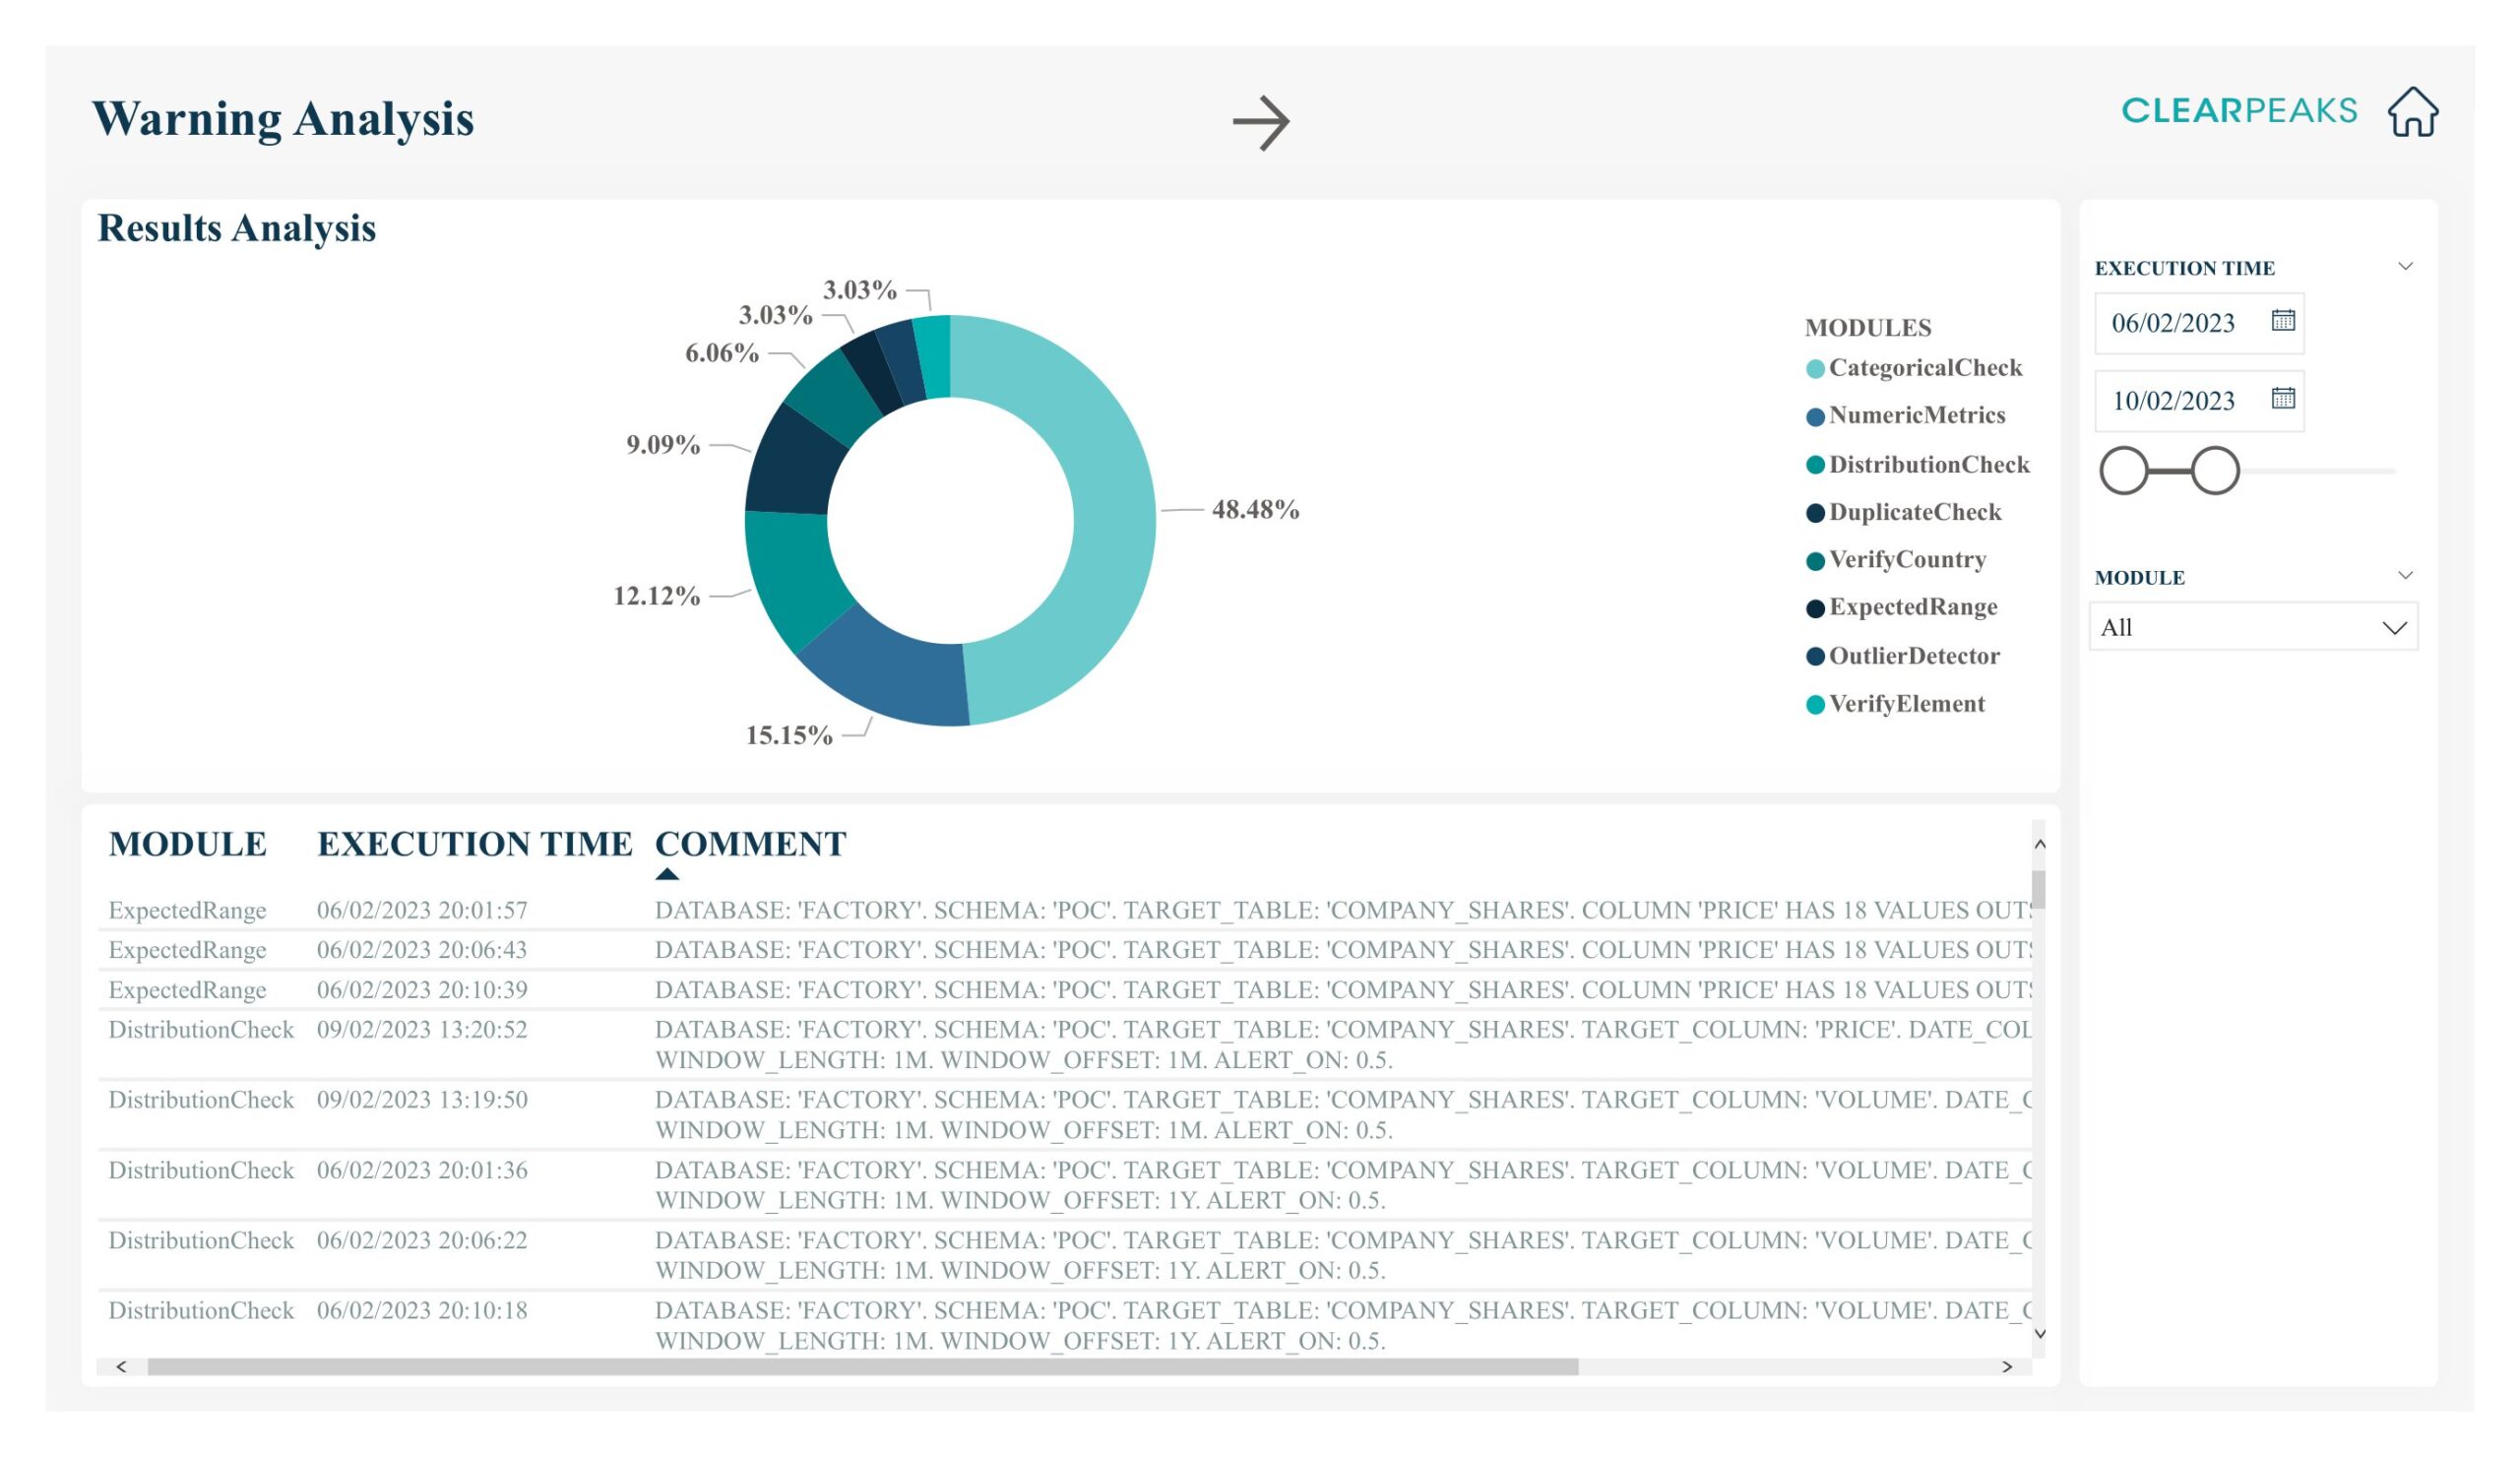
Figure 5: Warning analysis page of the Power BI report generated by DataWash.
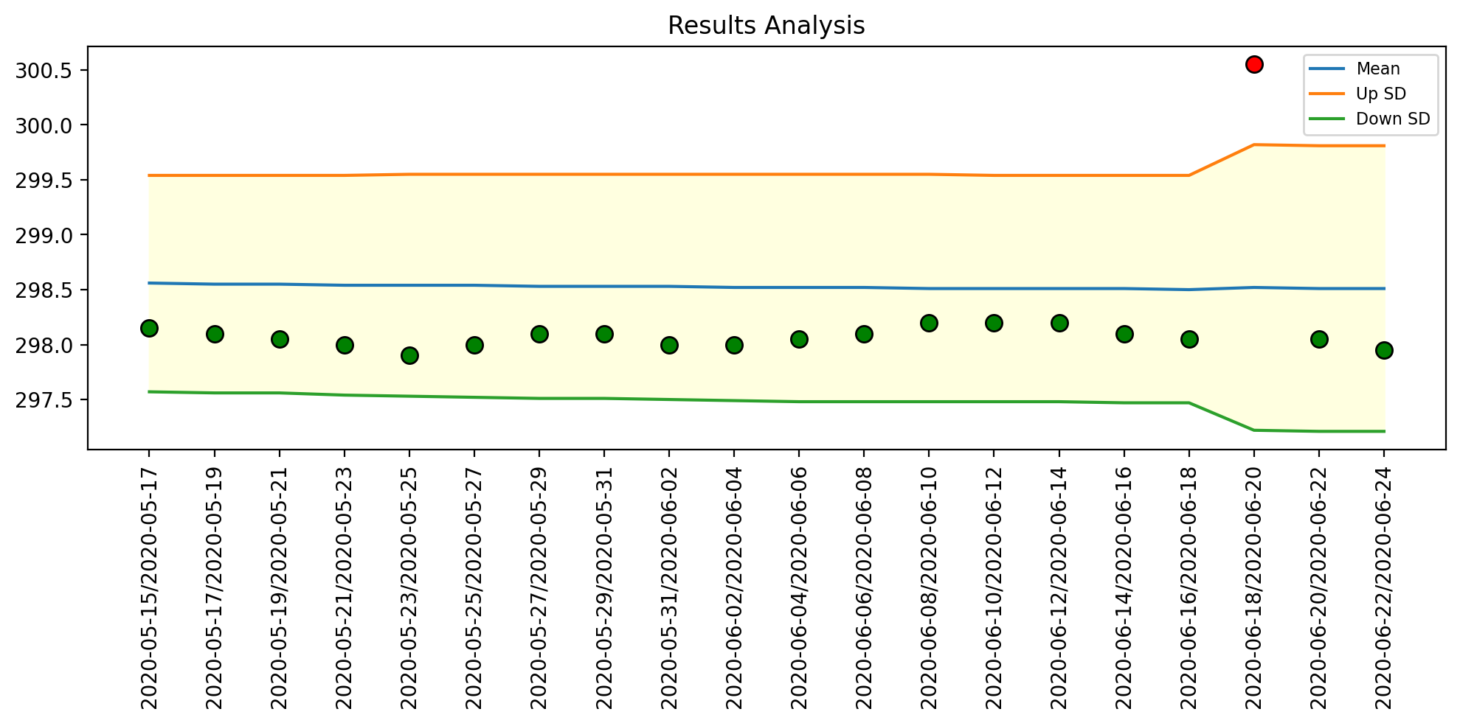
Additionally, the Power BI report also includes module-specific pages that provide a detailed analysis of the execution of each module implemented in the tool. Each module-specific page includes information about the module’s purpose, the tables it analysed, and the warnings generated during its execution, as well as visualisations that help to understand the distribution and severity of the warnings.
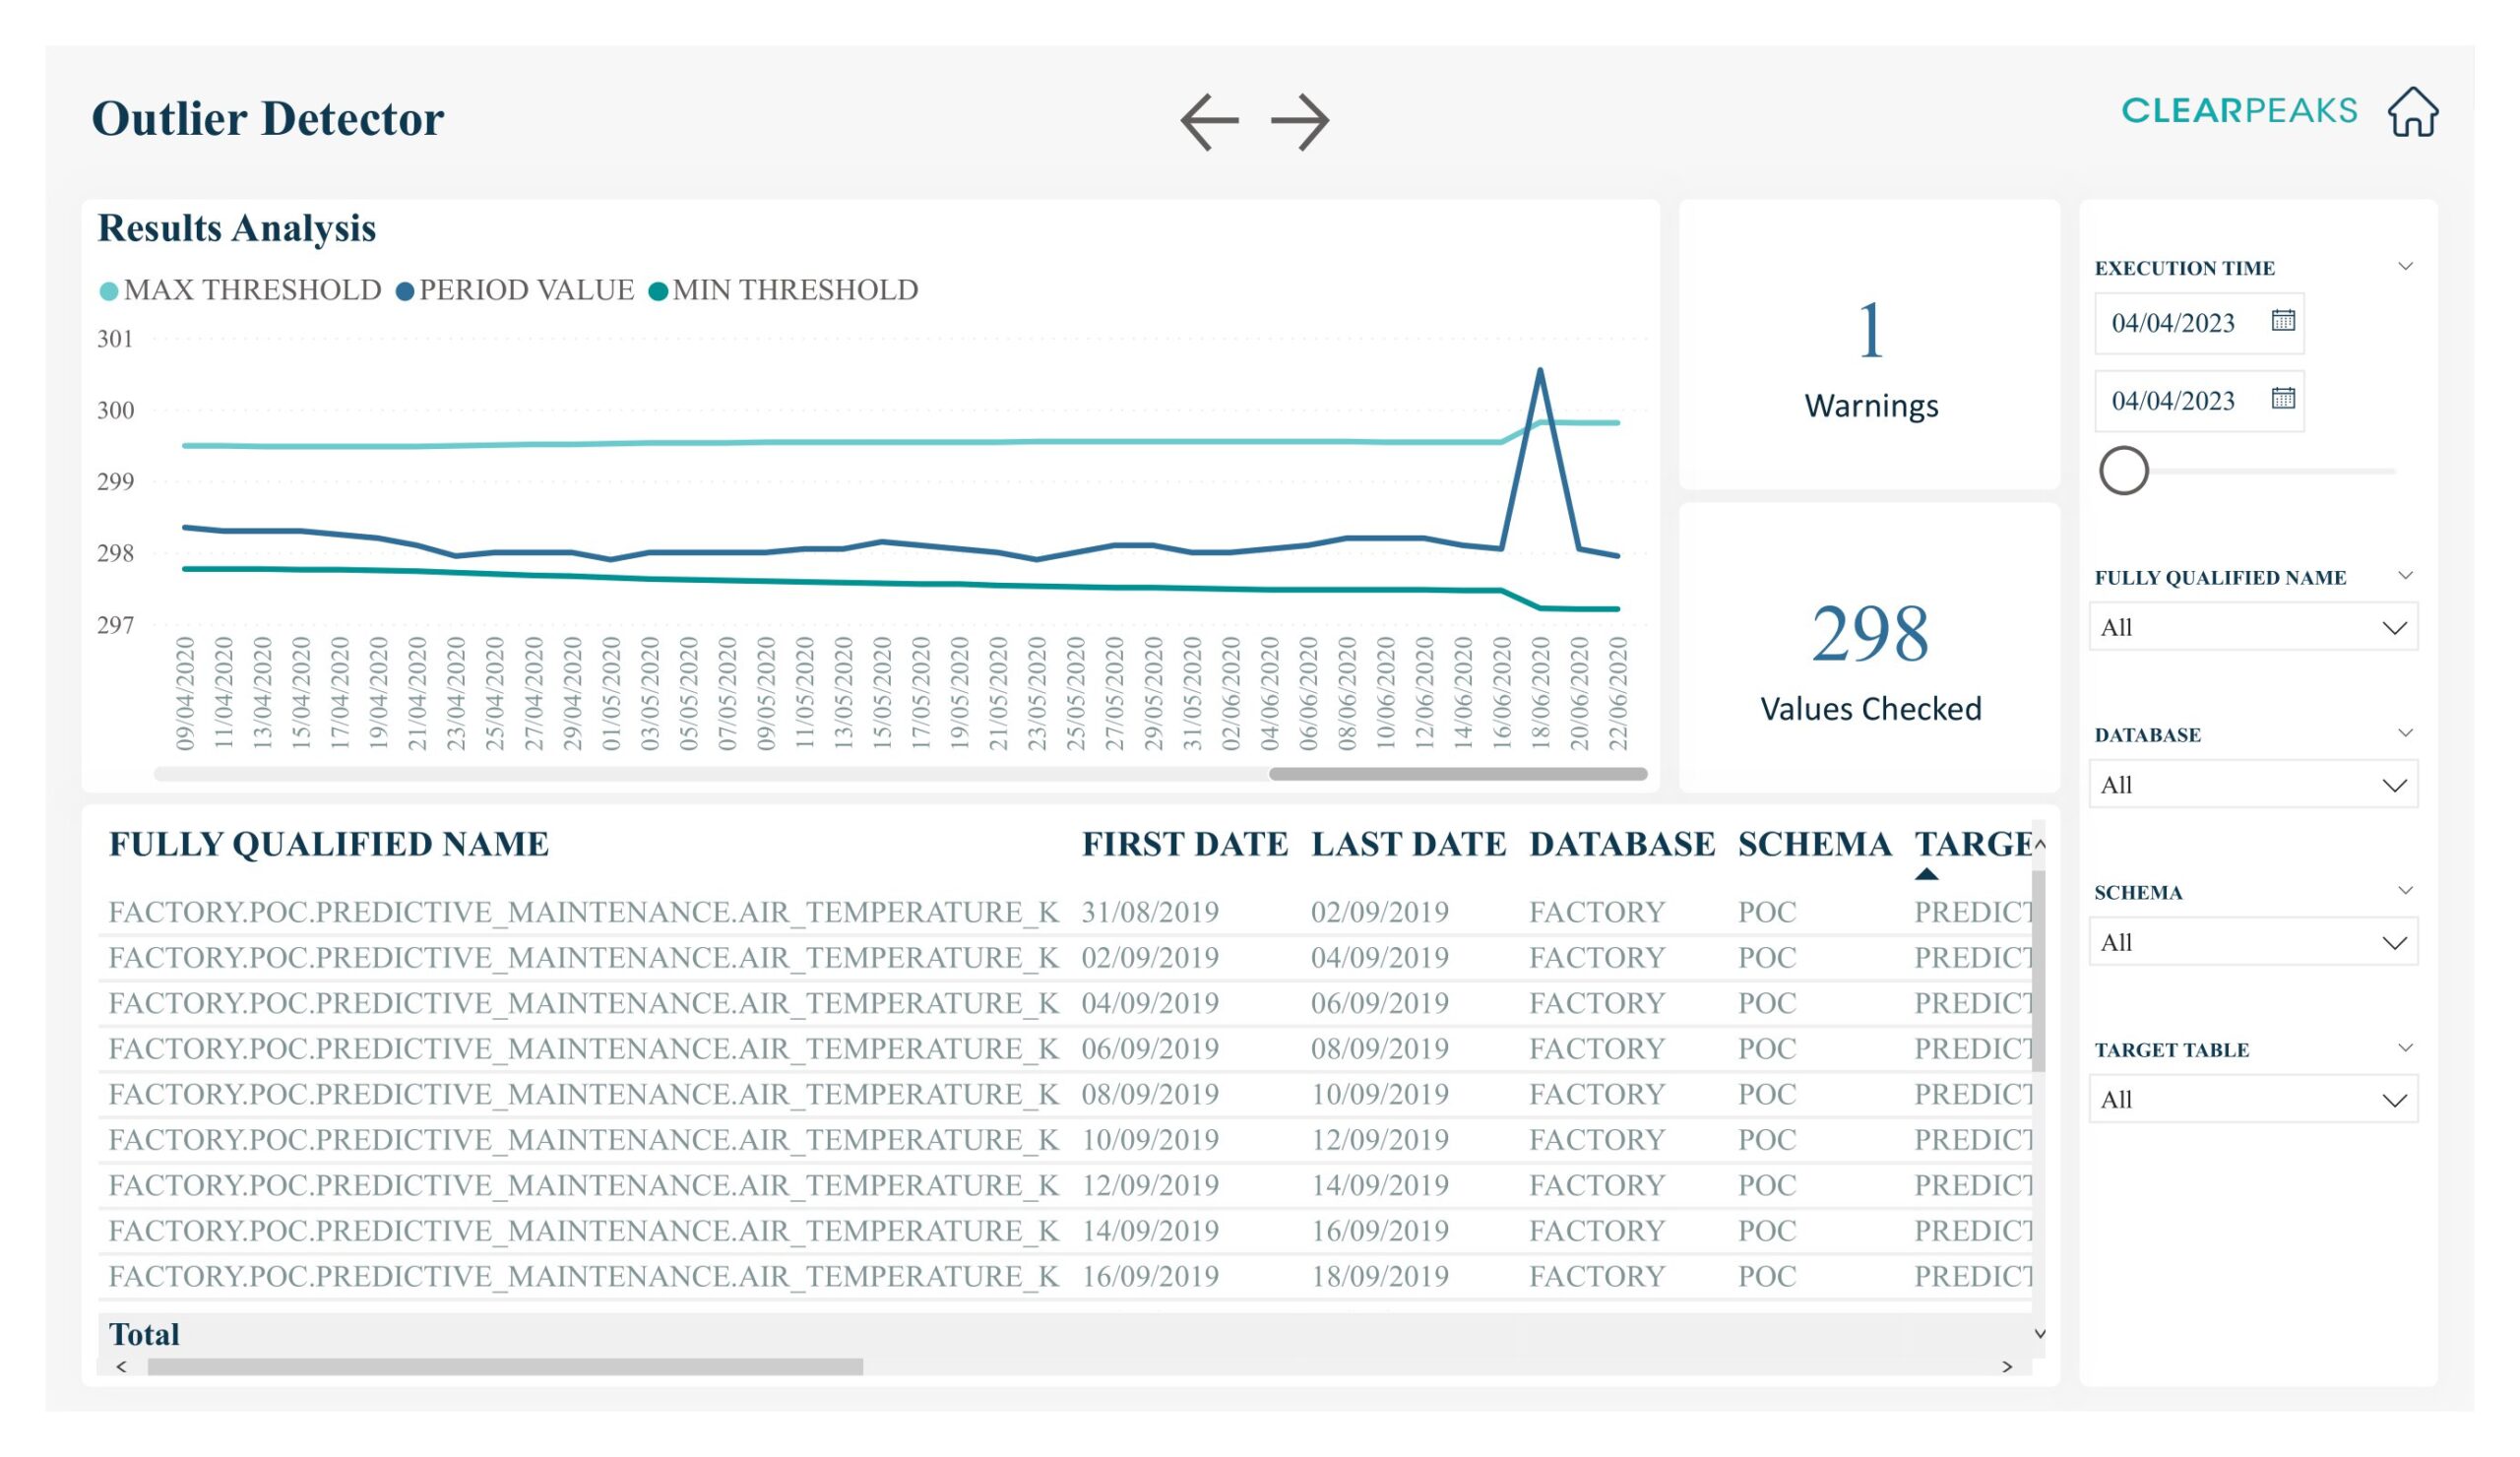
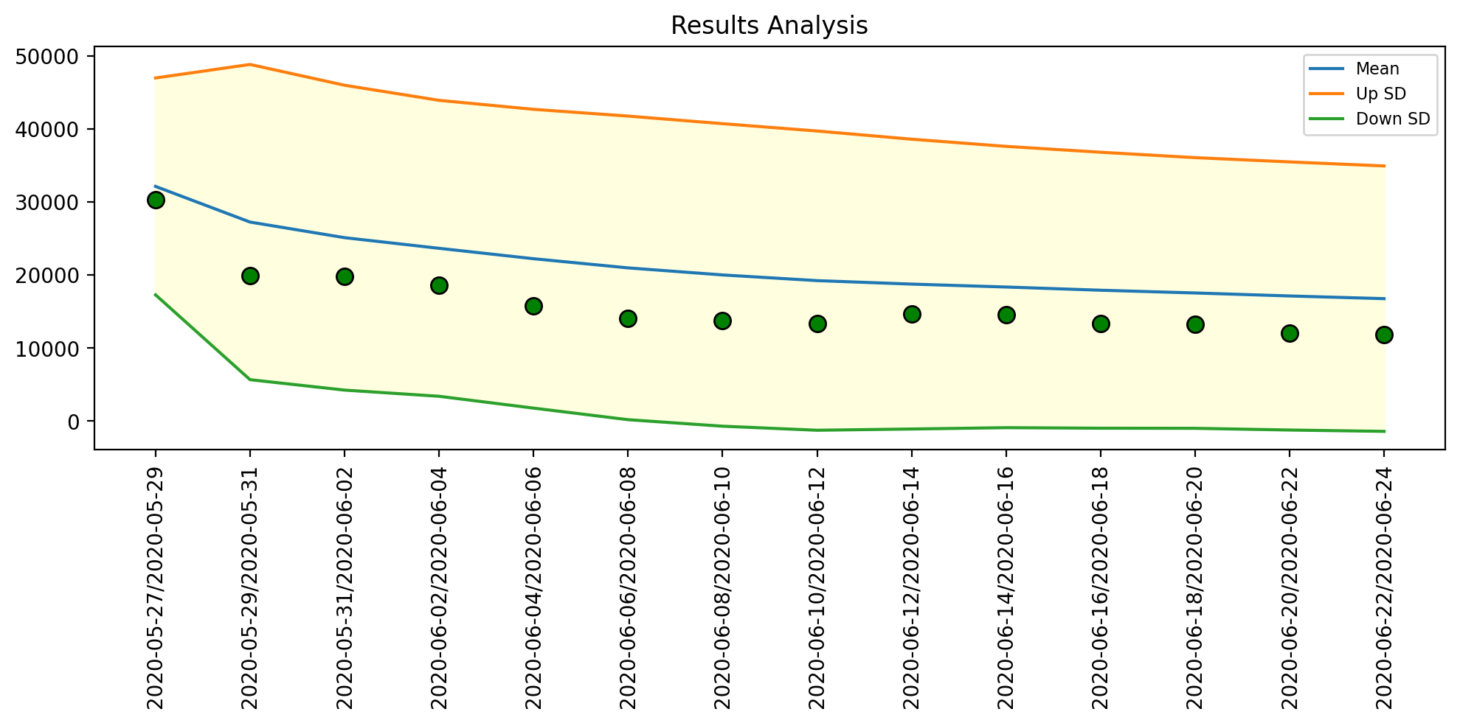
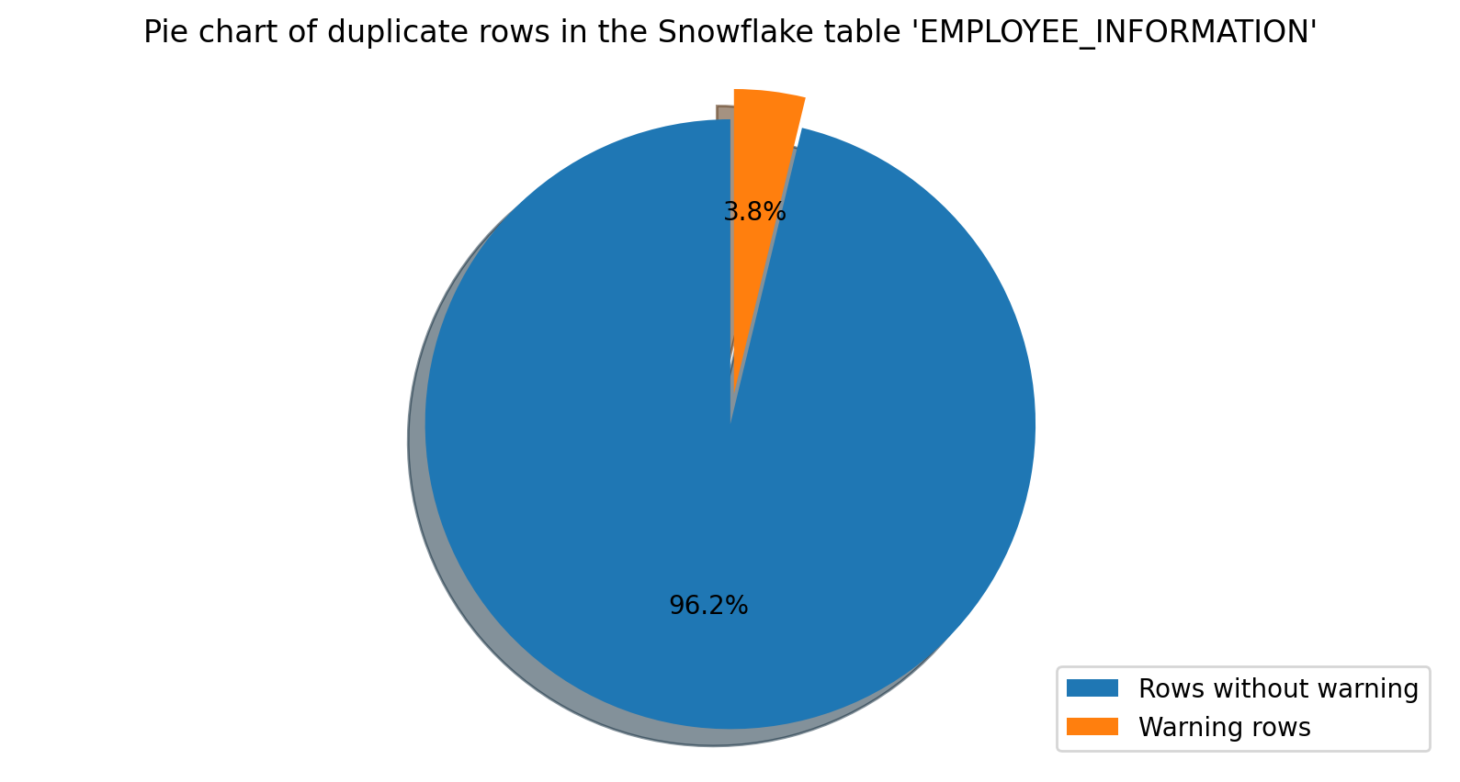
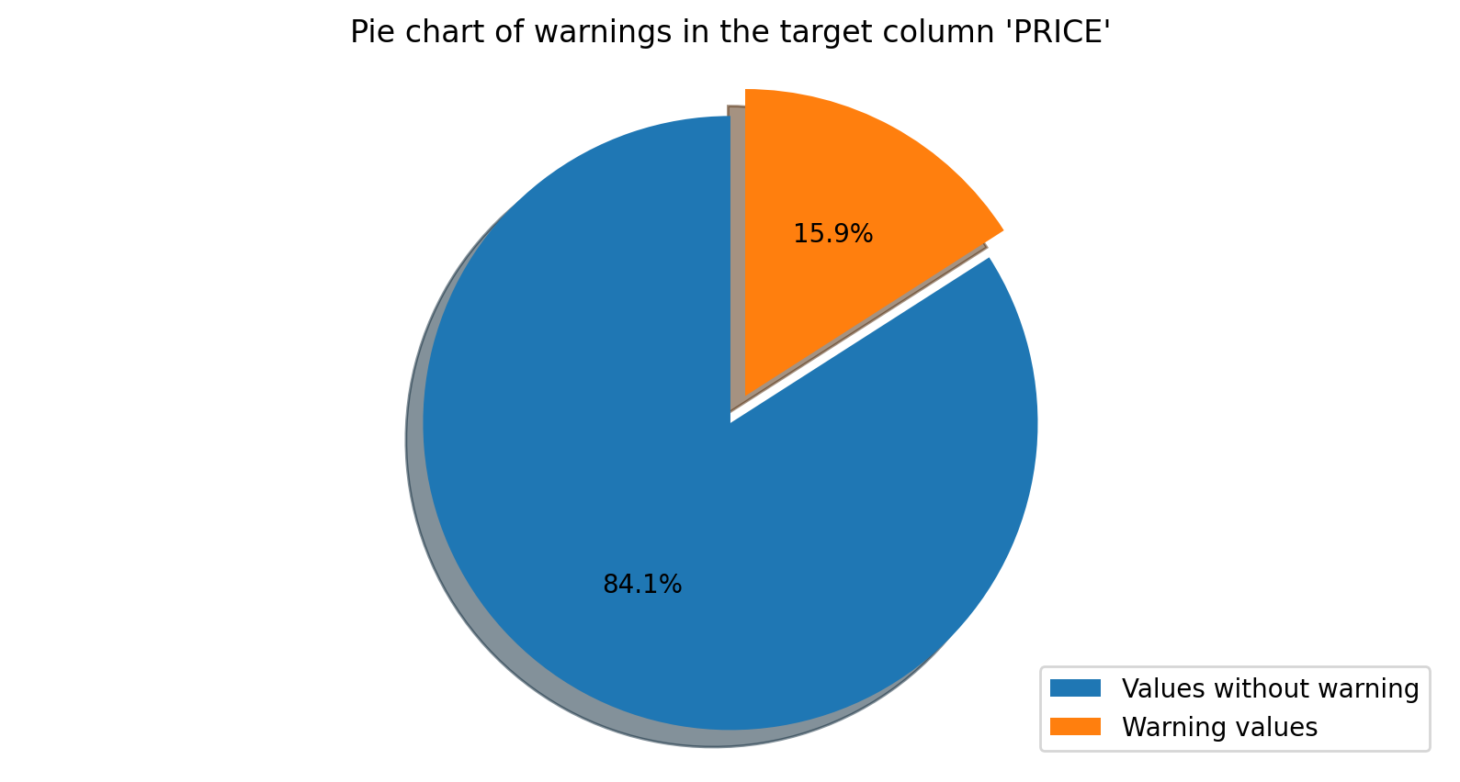
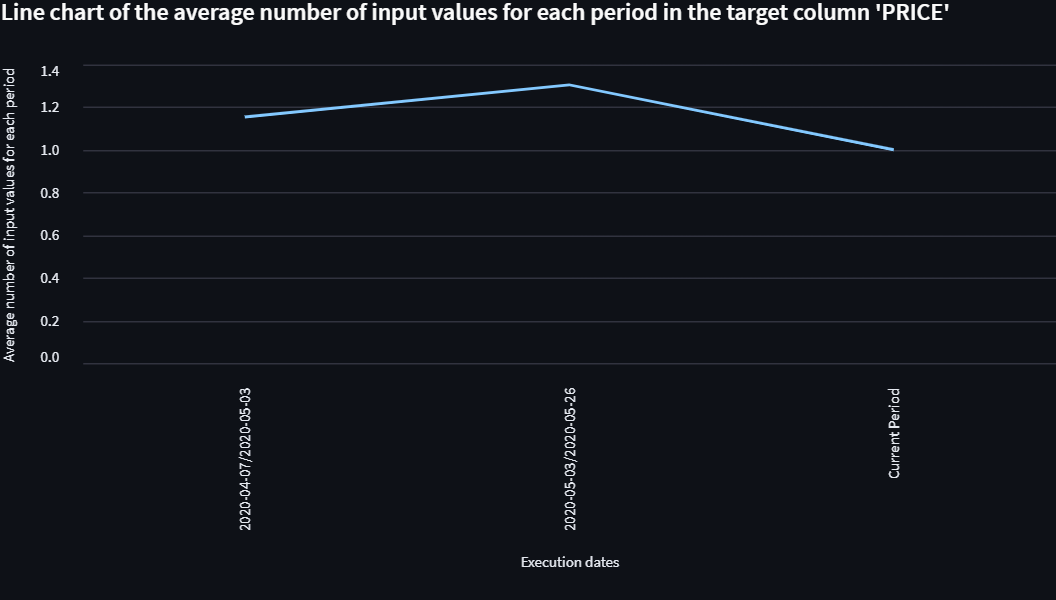
Figure 6: Outlier Detector module results analysis page of the Power BI report generated by DataWash.
By providing a comprehensive Power BI report, DataWash helps users to visualise and analyse the results of their data quality assessments, identifying patterns and trends in data quality issues which can in turn influence decisions about improvement initiatives. What’s more, the report is also the perfect way to communicate the results to stakeholders and decision-makers.
Analysis of Results: Where is Data Persisted?
DataWash follows a specific process for persisting the data after the modules have been executed:
- Creation of Analysis Tables: DataWash creates an analysis table in Snowflake to store the results for each module executed. This table contains the data that has been analysed and the results of the analysis, such as any outliers detected, length range violations, incorrect country names, incorrect element values, invalid email addresses, invalid phone numbers, or non-existent websites.
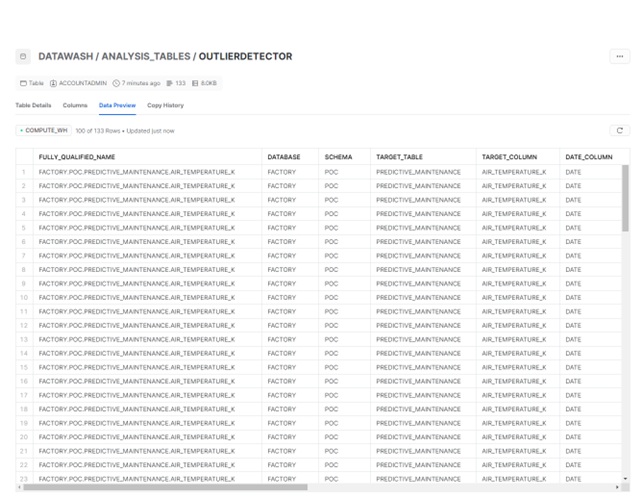
Figure 7: Snowflake analysis table persisting the results of running the Outlier Detector module.
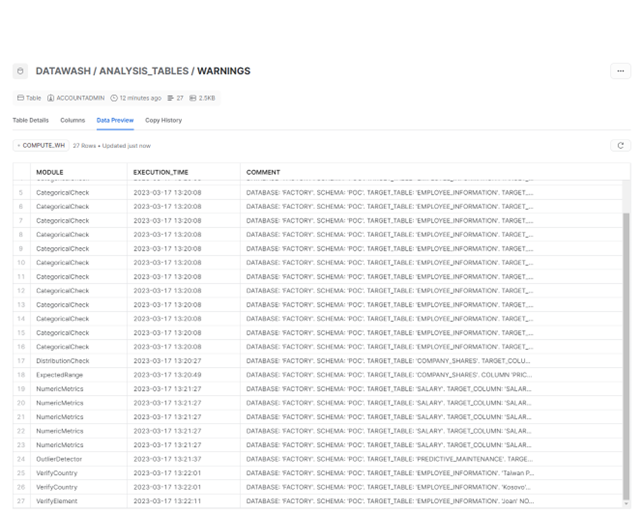
- General Warnings Table: DataWash also persists a general warnings table in Snowflake, a single table for all modules. This table stores all the warnings that have been generated by the different modules, allowing for a central repository of warnings generated during the data cleaning process. The general warnings table provides an overview of data quality and also helps the user to keep track of all the different warnings.

Figure 8: Snowflake warnings table that persists the warnings sent by each module during DataWash execution.
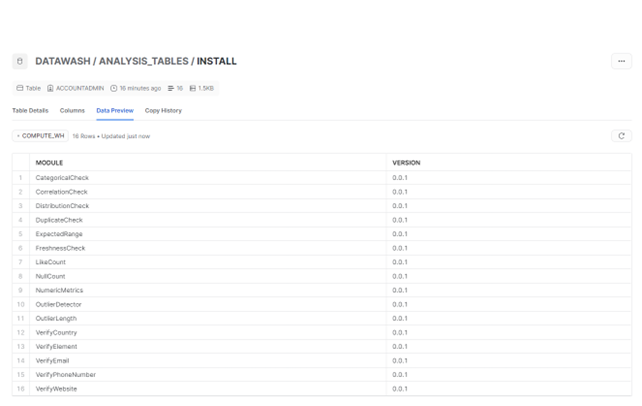
- Install Table: This table lists the version of the modules that have been executed.

Figure 9: Snowflake installation table that persists the version of the DataWash modules that have been executed.
As you can see, DataWash follows a well-defined process for persisting the data after the modules have been executed, creating analysis tables for each module, a general warnings table for all modules, and storing the data in Snowflake, thus providing a secure and scalable solution for data storage and retrieval.
Conclusion
As we have been able to see in these two blog posts, DataWash is a powerful data quality tool that provides a comprehensive and user-friendly solution for ensuring the accuracy and completeness of data in any organisation. The use of Snowflake as a data warehouse, coupled with the application of advanced machine learning techniques and the user interface designed with Streamlit, make it an efficient, accurate and cost-effective tool for improving data quality.
The importance of data quality is paramount as more and more businesses rely on data-driven decision-making. The need for accurate and reliable data is critical, and DataWash provides a streamlined solution for high-quality data, ultimately improving business outcomes.
Furthermore, the ability to customise modules to meet the specific needs of different businesses and industries makes it a highly adaptable tool. This flexibility, combined with the power of Snowflake, advanced machine learning techniques, and the simplicity of the Streamlit user interface, explain why it is in high demand by major companies hoping to improve business results and increase efficiency.
If you need any assistance with data quality in Snowflake, DataWash is an interesting option offering many benefits. If you want more information or require any help with your Snowflake and/or data quality projects, do not hesitate to contact us. We will be happy to help you!