
21 Jul 2022 End to End MLOps using MLflow
As the number of organisations adopting Advanced Analytics and digitally transforming their IT ecosystem is increasing, experimenting on different business use cases is also increasing exponentially.
And as the number of use cases and of people working on them grows, it’s becoming very difficult to track the experiments, trained models and results. Additionally, regulations and operational procedures for the machine learning process have to be in place to guarantee the smooth functioning of the team, or end-to-end deployments and retraining will be difficult.
In this blog post, we are going to look at how to manage an end-to-end machine learning lifecycle, i.e. MLOps (Machine Learning Operations including experimentation, storage, model registry, deployment, etc.) using MLflow.
MLflow is an open-source framework that supports machine learning operations. It has different components to track parameters and metrics during model training, to store the best models, and to save MLOps processes as pipelines.
What is MLOps?
MLOps is a set of processes and best practices to help data scientists simplify and automate the model training, deployment and management process in a large-scale production environment.
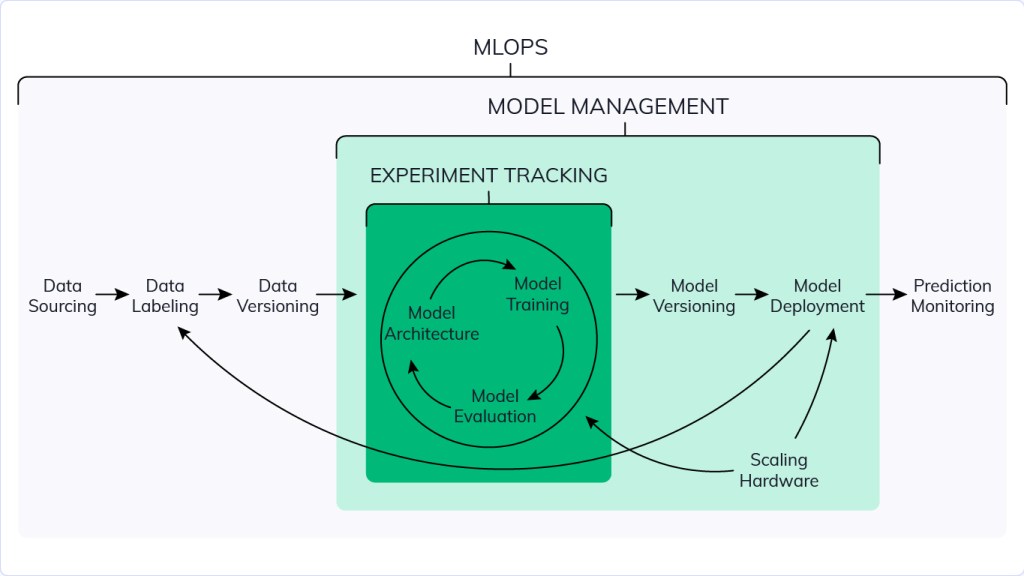
Figure 1: Source: Neptune.ai
Why is MLOps Needed?
A typical business use case with Artificial Intelligence (AI) involves multiple phases such as:
- Data collection.
- EDA (Exploratory Data Analysis).
- Data cleaning and pre-processing.
- Model training and validation.
- Model deployment.
- Model monitoring and retraining.
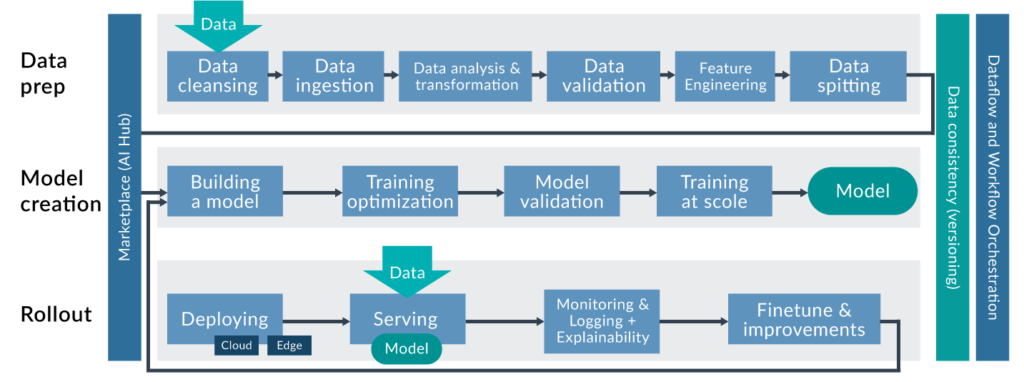
Figure 2: Source: KDnuggets
In a typical classification problem with labelled data provided by a domain expert, the data scientist will try multiple models with different versions of the data and multiple pre-processing techniques, tune hyperparameters and cross-validate to maintain the bias-variance trade-off, and then employ different metrics to evaluate the models.
All the different versions’ results need to be validated and a final model deployed into production. To do this, it’s important to verify and understand the performance of the models under all the different combinations of techniques.
Once the final model has been chosen, we have to deploy the model – build the data and model pipelines, then serve the model for future predictions. We should periodically check drift and performance on new data in order to retrain the model too.
During all these stages, we need to regulate and set up a process for experiment tracking and versioning, deployment and model management, so that the projects can run consistently from end to end.
A clear methodology will ensure reproducible, reusable and scalable ML models for business use cases.
How can MLflow Help in Setting up End-to-end MLOps?
MLflow is an open-source platform to manage ML lifecycles, including experimentation, reproducibility, deployment, and a central model registry. MLflow essentially has four components: tracking, projects, models, and registry.
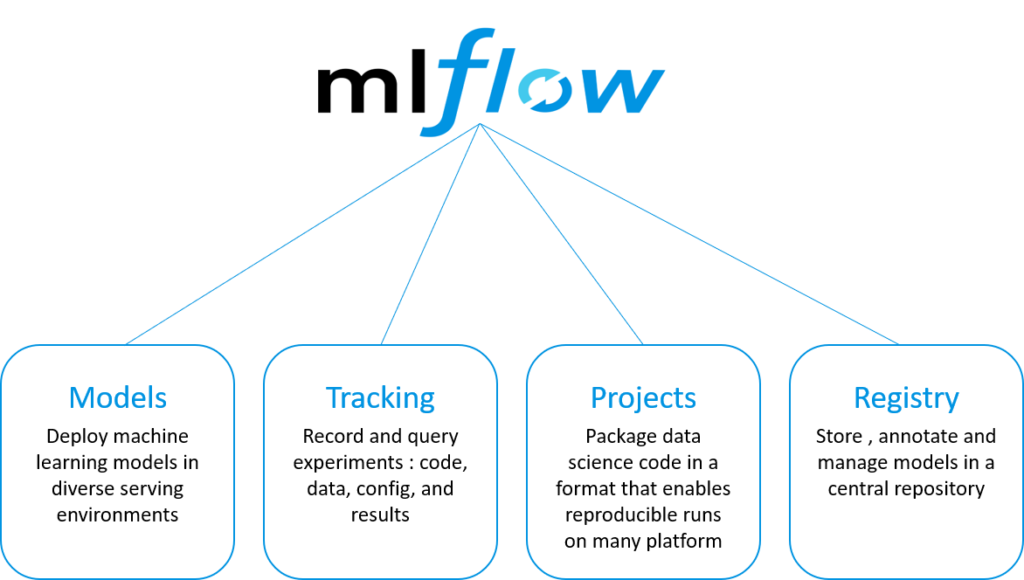
Figure 3: Source: Databricks
- MLflow can work with multiple ML libraries like sklearn, XGBoost, etc.
- It supports programming languages like R, Python and Java.
- We can install and use MLflow on premise or in cloud.
- It has the capability to scale and operate with Apache Spark.
- We can easily scale usage from one user to multiple users.
Architecture of MLOps Using MLflow
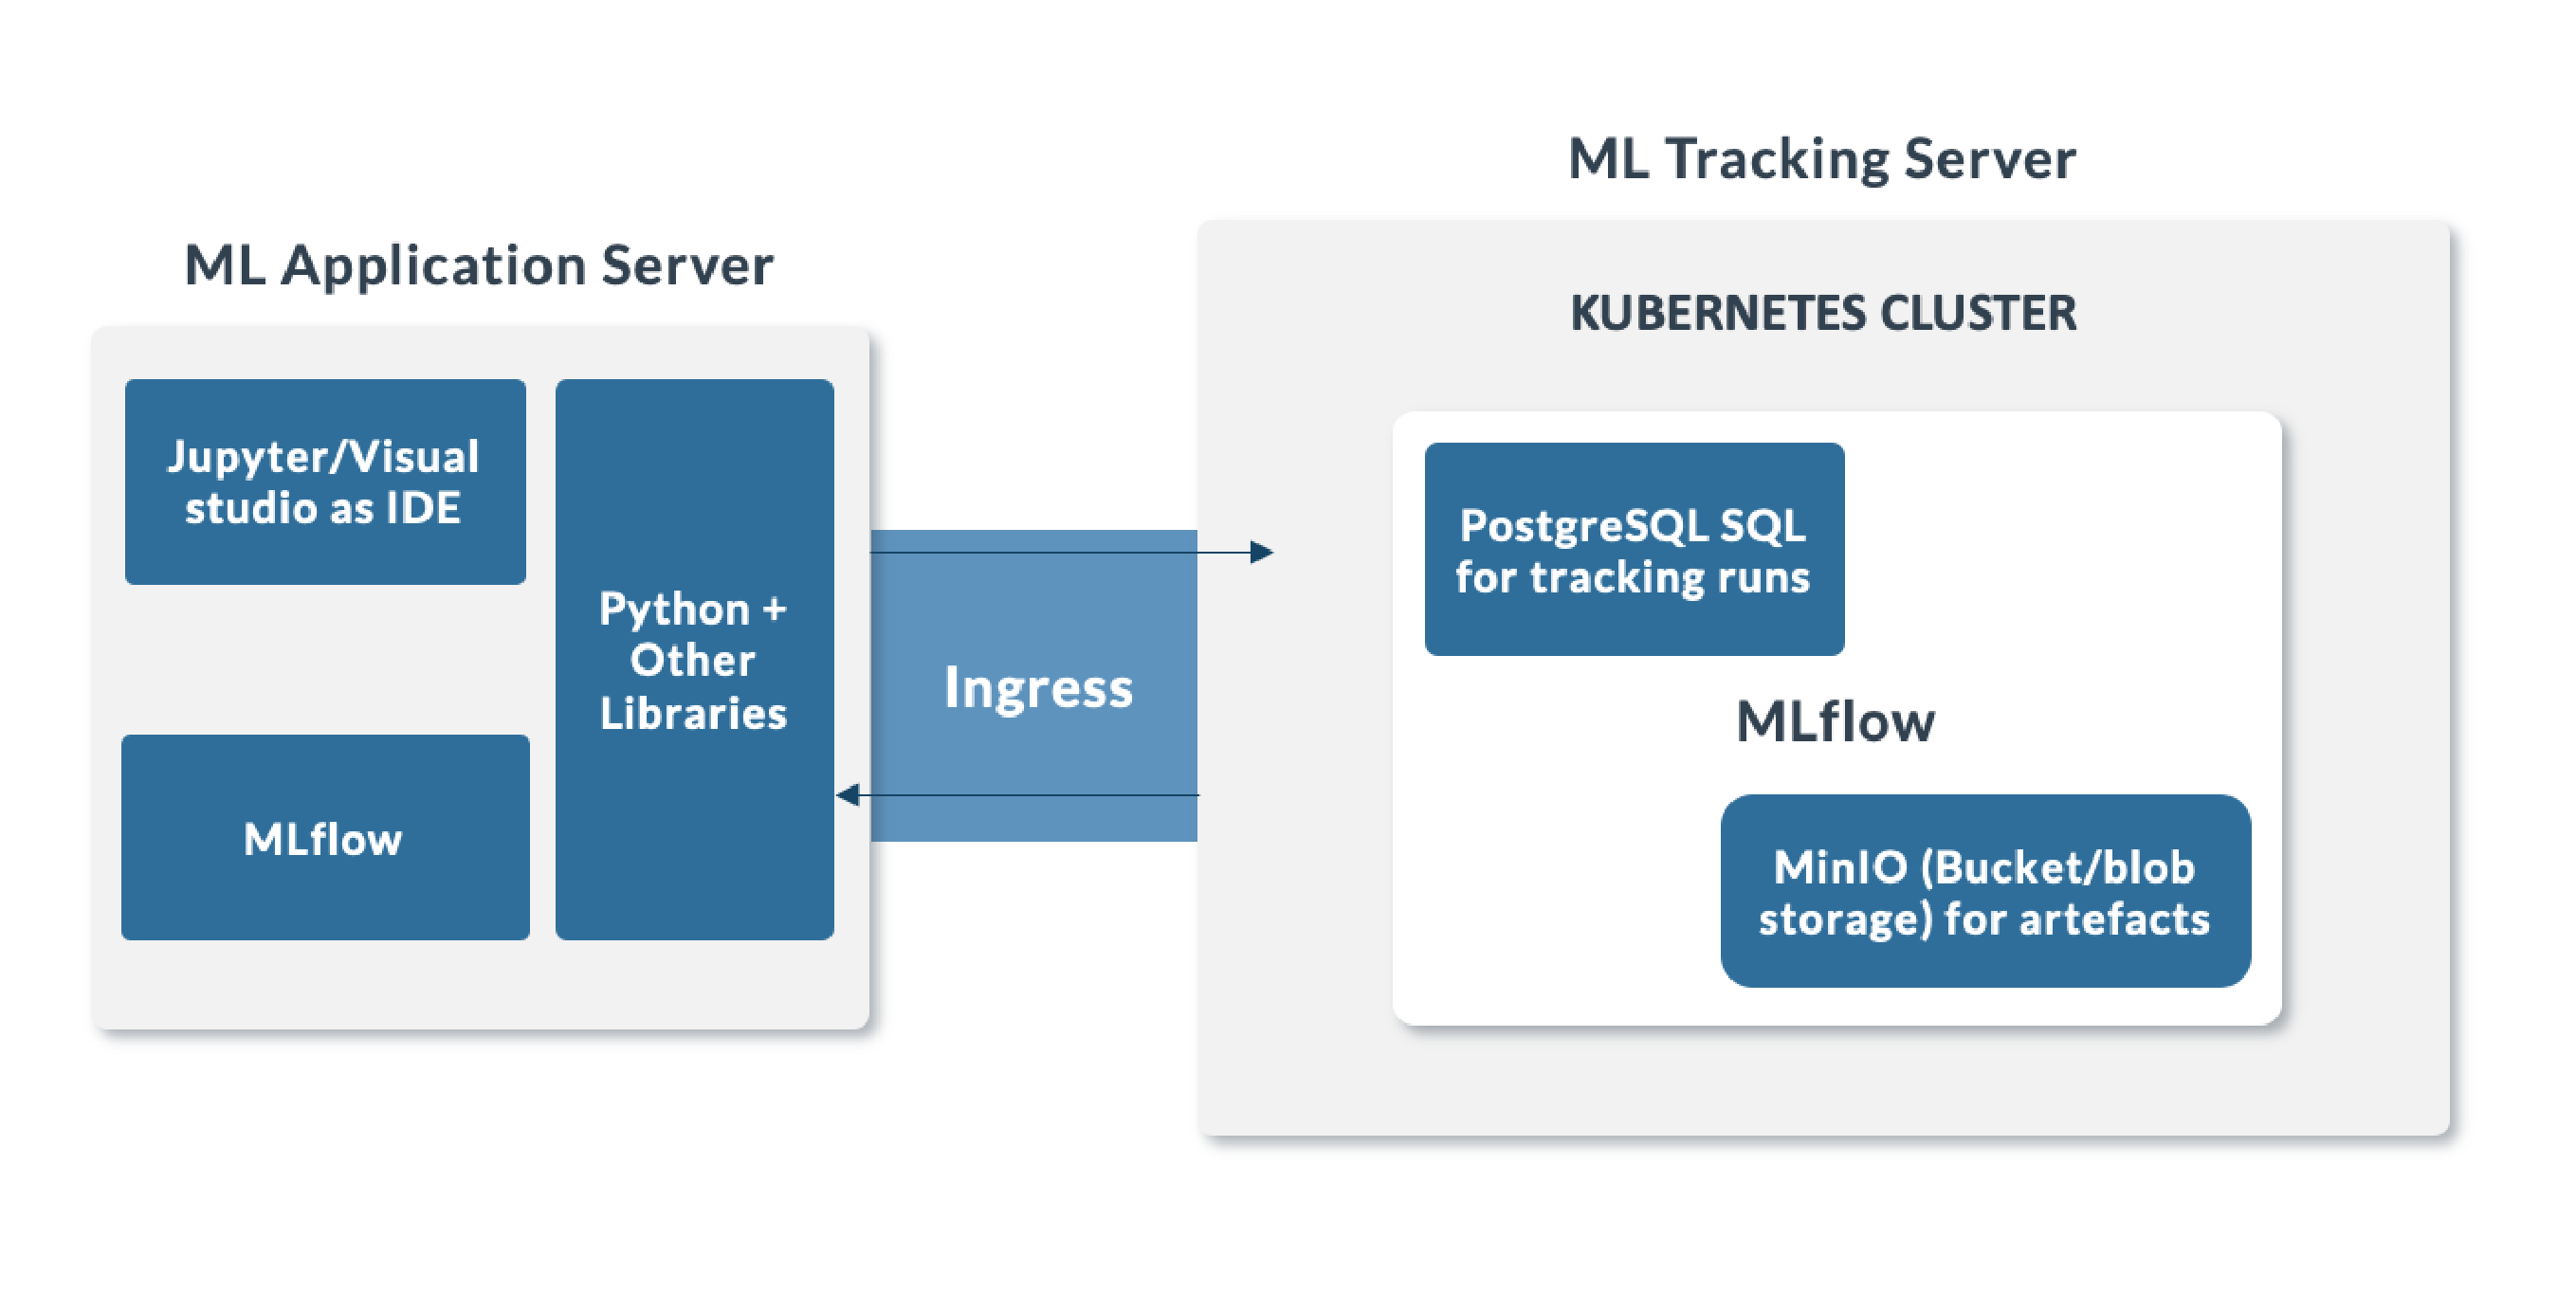
Figure 4: Architecture of MLflow tracking server.
ML Application Server: This is the development environment where we analyse and experiment multiple use cases, work on models, and present the results to the business. This development environment can be a local system, a configured virtual machine, or a cloud instance. We can use IDEs like Jupyter, Visual Studio, or PyCharm in the development environment for programming in Python and install MLflow to log the model runs. We can install other specialised libraries like sklearn, XGBoost, statsmodels, NLTK, etc., according to our requirements.
ML Tracking Server: We are using a Kubernetes cluster with a single node to store our model runs, to log the hyperparameters and metrics, and to save artefacts of the best-performing model using MLflow.
In this scenario we use PostgreSQL to save the model runs, metrics and parameters, and MinIO as the blob storage for the model artefacts. Alternatively, we could use Oracle DB, SQL Server, or SQLite to store the runs, and AWS S3/Azure blob storage to save the artefacts.
Once all the components have been configured and deployed in Kubernetes, we can open the Kubernetes dashboard and see the applications running on it:
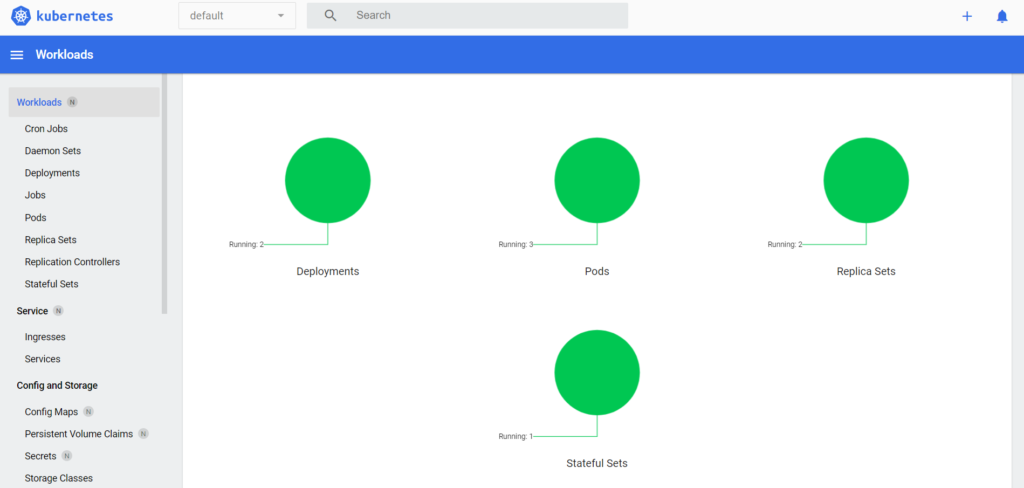
Figure 5: Dashboard showing the applications running on Kubernetes.
In Kubernetes we have three different resources to deploy applications:
Deployments: The easiest and most common resource to deploy your application. It is a Kubernetes controller that matches the current state of your cluster to the desired state mentioned in the Deployment manifest. If, for example, you create a Deployment with one replica, it will check that the desired state of ReplicaSet is 1 and the current state is 0, so it will create a ReplicaSet, which will then create the Pod.
Deployments are usually used for stateless applications. However, you can save the state of the Deployment by attaching a persistent volume to it and make it stateful, but all the Pods of a Deployment will share the same volume and data.
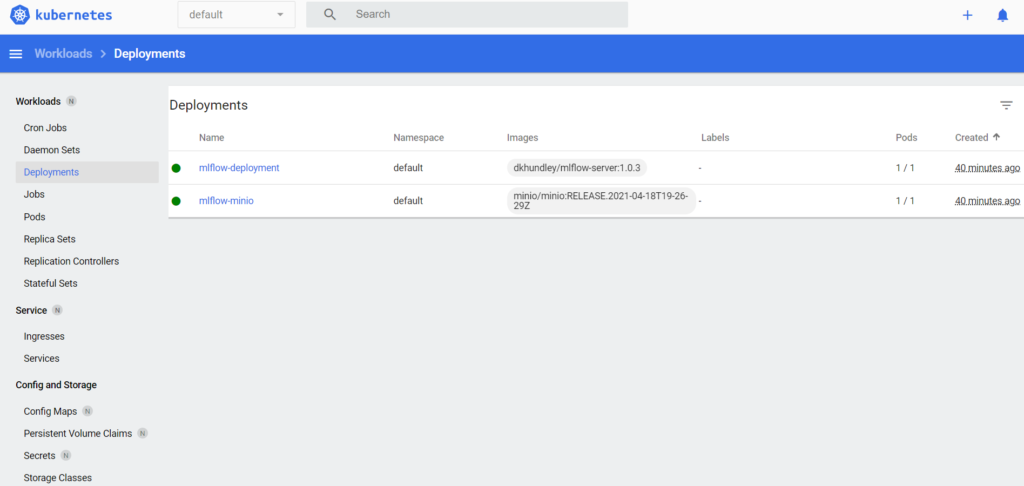
Figure 6: Dashboard showing the deployments of MinIO and MLflow.
Ingress: Kubernetes Ingress is an API object that provides routing rules to manage external users’ access to the services in a Kubernetes cluster, typically via HTTPS/HTTP. With Ingress, you can easily set up rules to route traffic without creating a lot of load balancers or exposing each service on the node. As we have to view the model runs in the MLflow dashboard and verify the artefacts in our blob storage, we have exposed the MLflow and MinIO using Ingress.
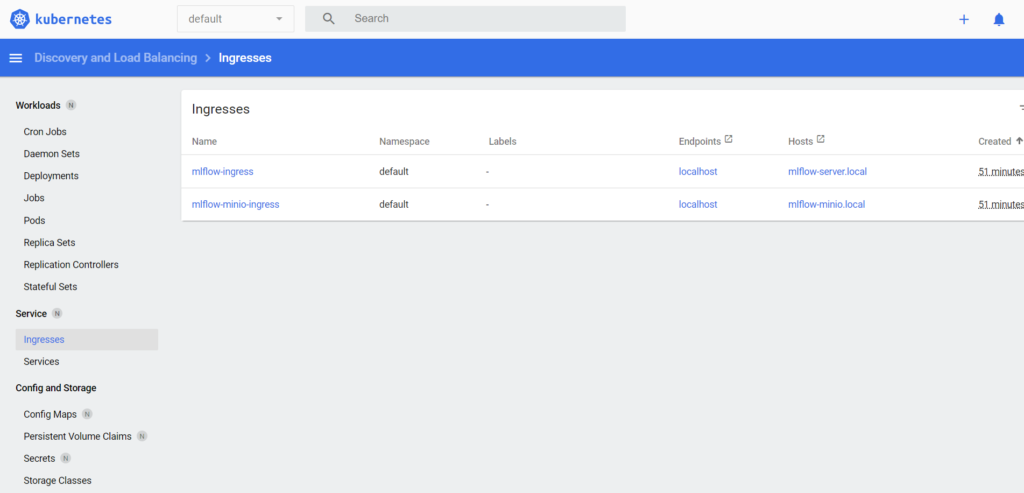
Figure 7: Dashboard showing the deployments of MinIO and MLflow.
StatefulSets: A Kubernetes resource used to manage stateful applications. It manages the deployment and scaling of a set of Pods, and guarantees the ordering and uniqueness of these Pods. A StatefulSet is also a controller but unlike a Deployment, it doesn’t create the ReplicaSet, but instead creates the Pod with a unique naming convention.
Every replica of a StatefulSet will have its own state, and each of the Pods will create its own PVC (Persistent Volume Claim). So, a StatefulSet with three replicas will create three pods, each having its own volume, making a total of three PVCs.
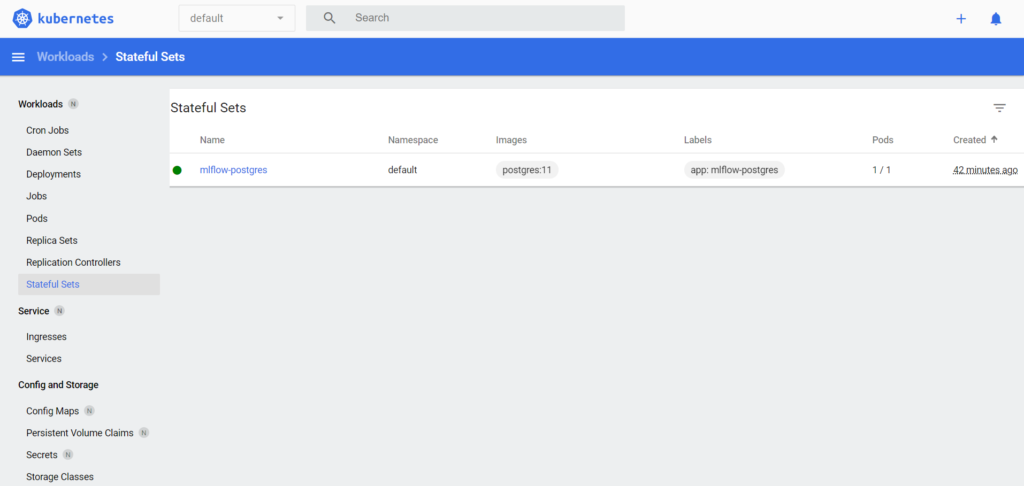
Figure 8: Dashboard showing the deployments of PostgreSQL.
DaemonSet: A controller that ensures that the Pod runs on all the nodes of the cluster. If a node is added or removed from a cluster, DaemonSet automatically adds or deletes the Pod.
Implementation of Churn Prediction with MLflow
Use Case: Implementing the customer churn model, i.e. whether the customer leaves the bank or not, using customers’ geographic, personal and account information.
Model experimentation and tracking: We want to track the performance of the model using multiple algorithms, techniques and hyperparameters, and save the best model with its hyperparameters. In order to reduce overfitting, we are performing a five-fold cross-validation to track model performance on each fold with tuned hyperparameters.
Evaluation Metrics: f1-score for model selection, accuracy and AUC-ROC for each model.
Environment: A local environment was used as the ML development server, Kubernetes as the tracking server with one node, PostgreSQL as the backend to store the model runs, and MinIO as blob storage to store the model artefacts.
MLOps: MLflow is used to log model hyperparameters and metrics.
Models Trained: KNN, Logistic Regression, Decision Trees, Random Forest (with available hyperparameters for each model and five-fold cross-validation).
Tracking: For each model run, we create logs against each cross-validation and every combination of hyperparameters and metrics calculated against it on the training and validation data. These will be stored in the PostgreSQL DB.
For every model, we save the best hyperparameter, model pickle file, artefacts and Python file as a pipeline in blob storage. When we run the same model multiple times, we create versions against it and tag them to either staging or production.
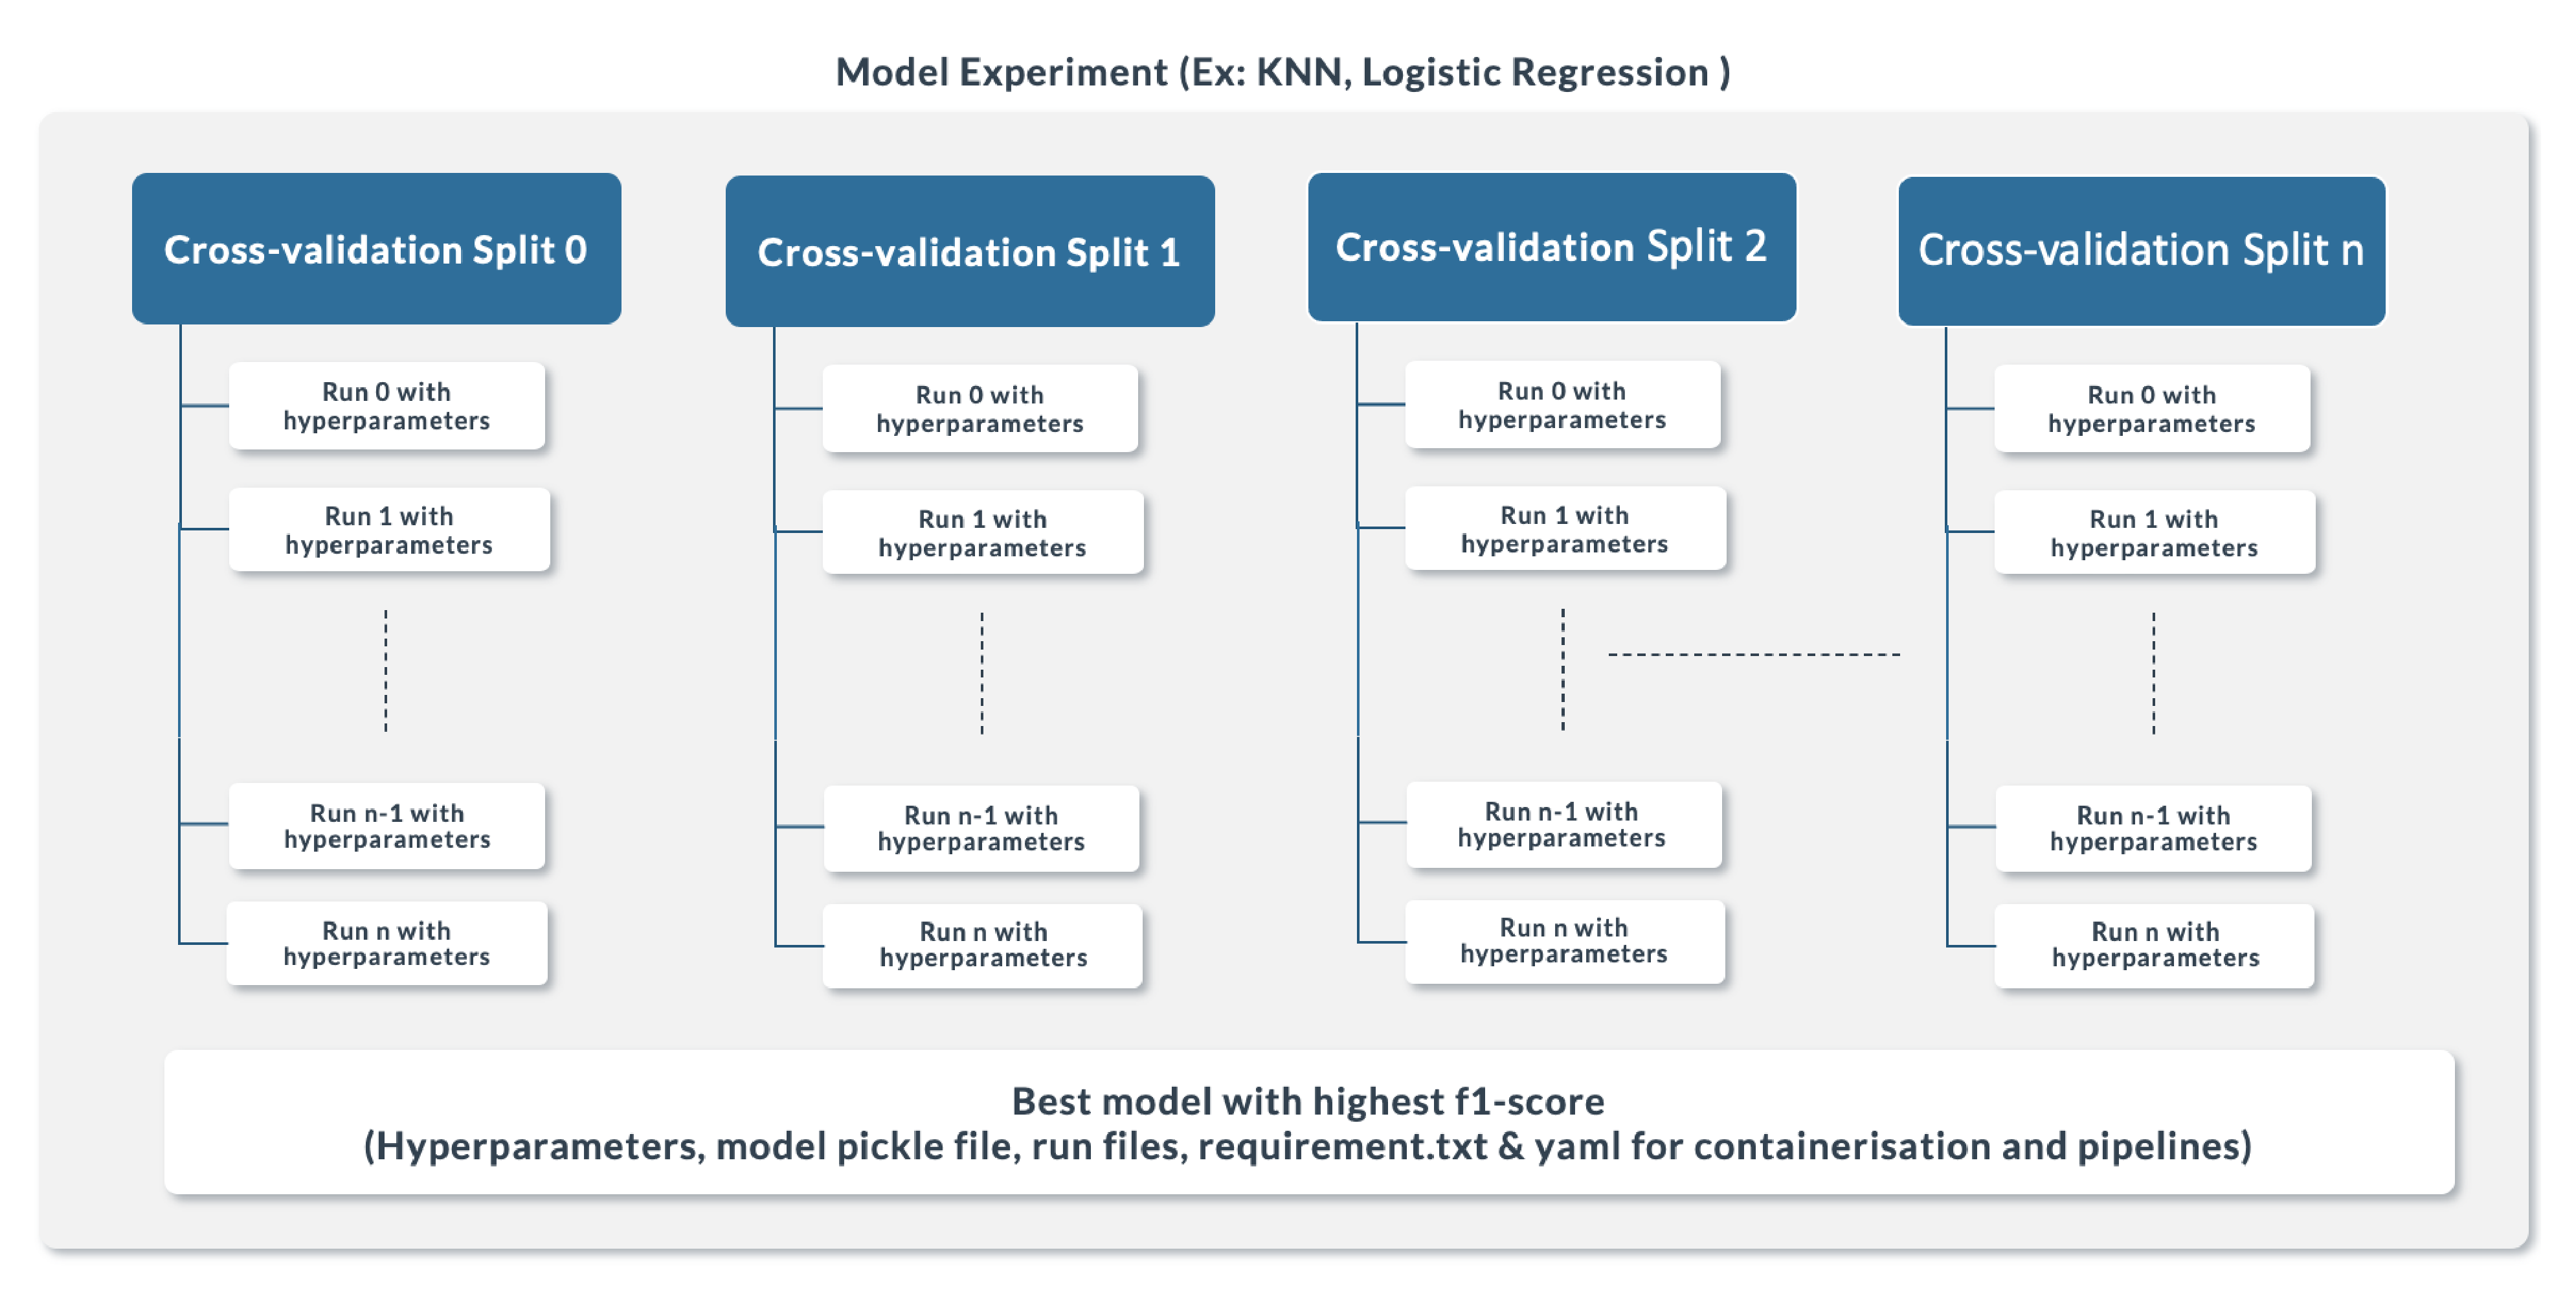
Figure 9: Tracking Structure used in MLflow.
Programming MLflow
MLflow can be programmed by installing the mlflow Python package in the development server and then using the mlflow or client package functions as a source for programming. The sample code is shown below.
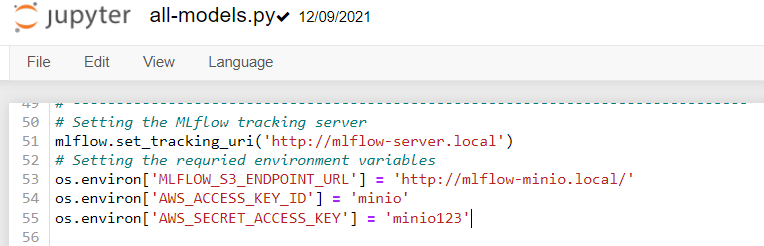
Step 1: Here, the tracking server is the URL for Mlflow deployed in the Kubernetes cluster where we set up the previous steps and MLFLOW_S3_ENDPOINT_URL is for MinIO blob storage:
Step 2: In MLflow, to track any model logs we just create an experiment and add one or multiple runs under it:
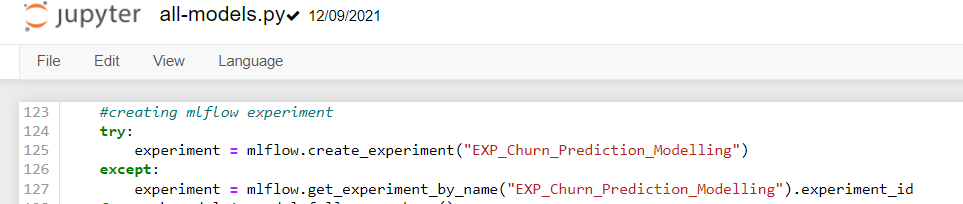
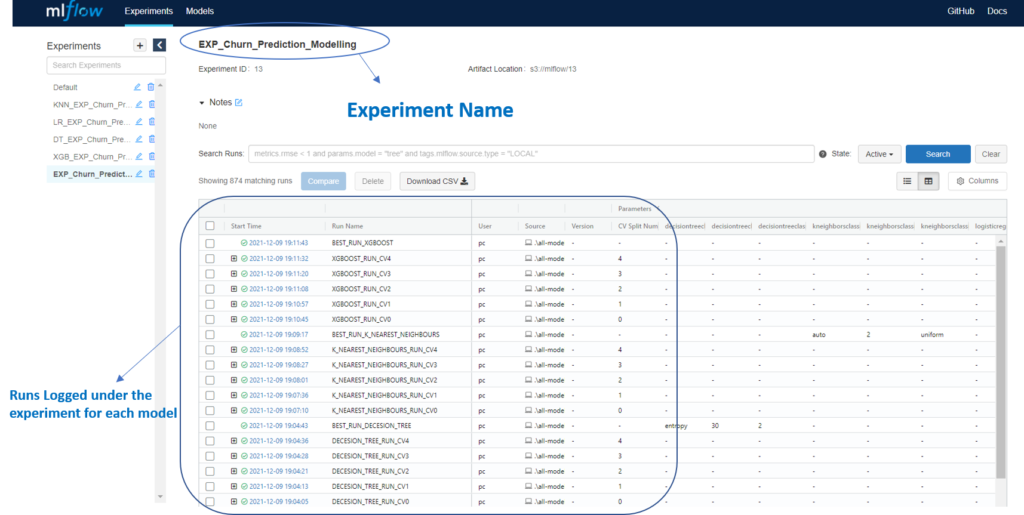
We have created an experiment called “EXP_Churn_Prediction_Modelling “, under which we will store all our model runs.
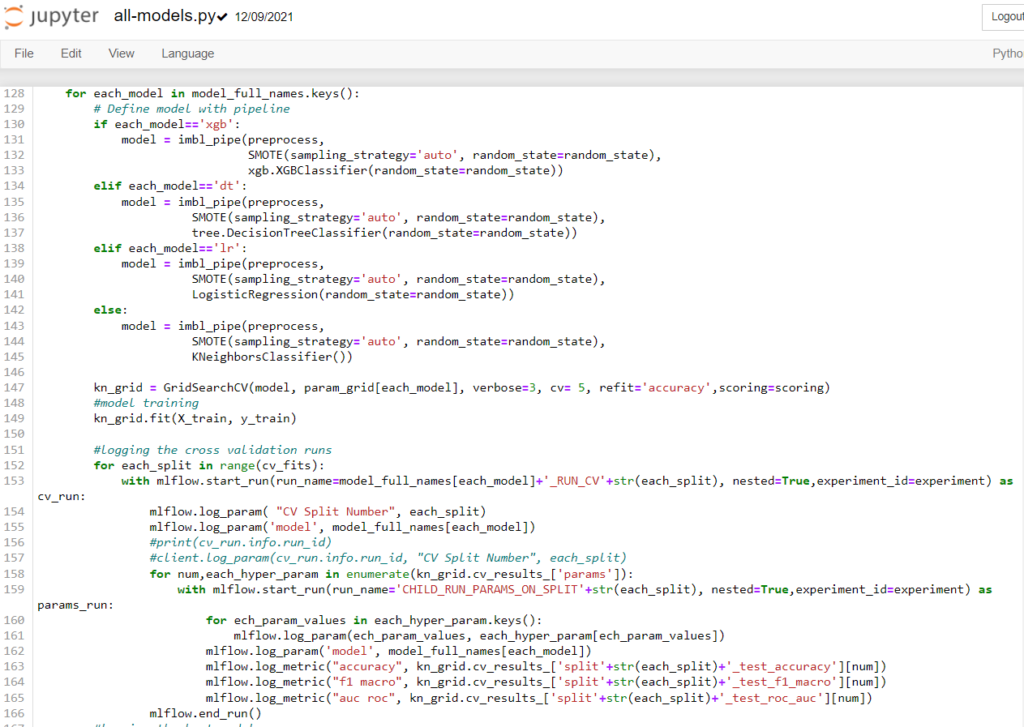
Step 3: Under the experiment created in the previous step, we log the cross-validations and hyperparameter tunings performed on the models using GridSearch, along with the model performance metrics:
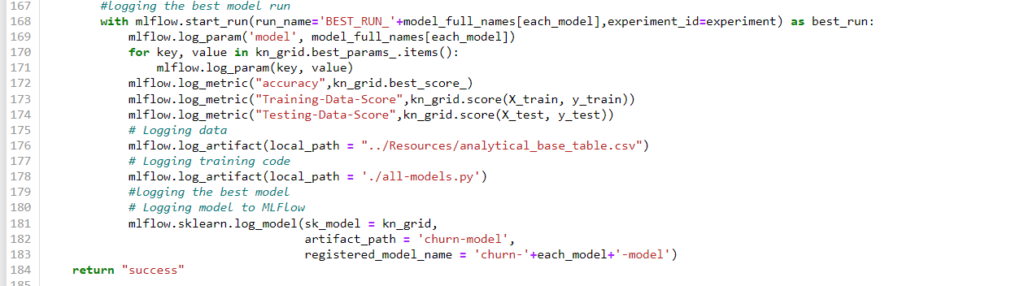
Step 4: Finally, we log the model with the best performance score and save the model artefacts in blob storage in the ML tracking server:
MLflow UI
Experiments: The image below shows the experiments and runs logged for different models:
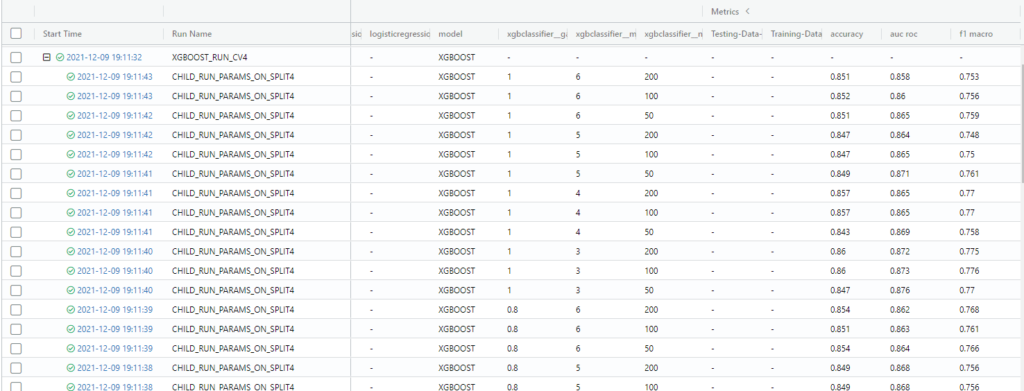
Runs: Under each model and cross-validation, we log runs with all combinations of hyperparameters along with the scores for each run:
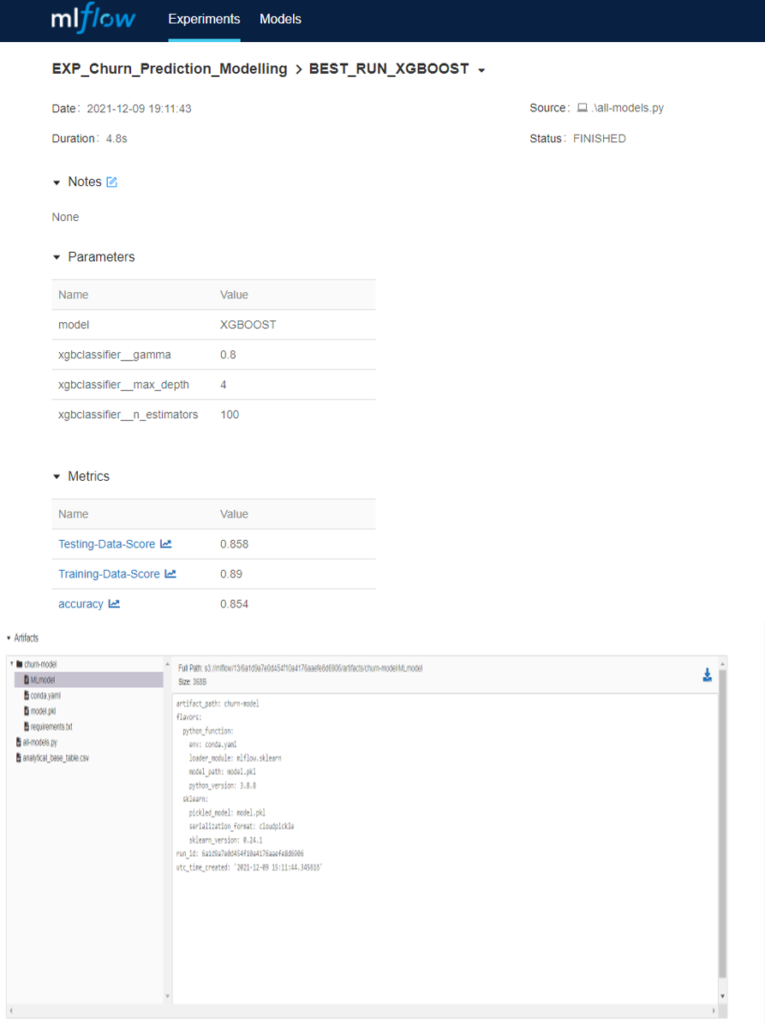
Metrics and Artefacts: Finally, we log the best model along with the artefacts and scores:
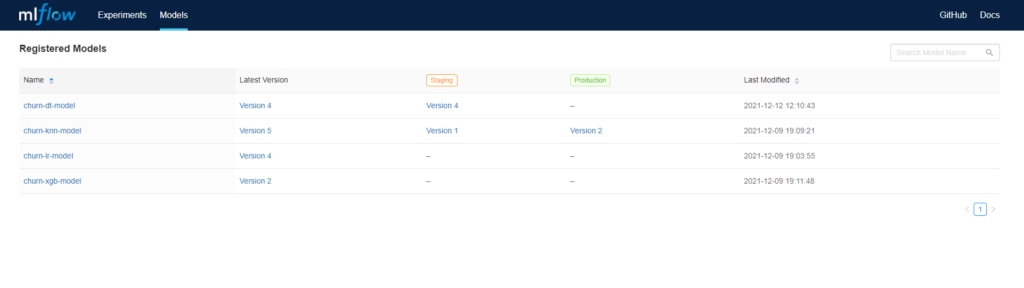
Model Versions: As we are saving the model as a pickle file in each run in an experiment, re-running the experiment and saving the model again will create versions incrementally. We tag the model version to be either staging, production or achieved:
Conclusion
In this blog post, we have seen how to manage an end-to-end machine learning lifecycle effectively using MLflow.
Here at ClearPeaks we’ve got a lot of hands-on experience in machine learning and data science projects, simply contact us and our team will be happy to answer any queries that you might have.