
19 Jul 2023 Exploring the New On-Object Feature in Power BI Desktop
In March 2023, Microsoft presented a new modality to create and interact with visuals in Power BI Desktop as a public preview, allowing you to format canvas visuals directly “on the object” rather than through the visualisation pane. This new feature is a response to the challenges some users had faced when navigating Power BI Desktop to format visuals. In this article we’ll walk through the main concept and the new capabilities of on-object formatting.
Activating On-Object Interaction
The new on-object feature can be activated by navigating to File > Options and settings > Options > Global > Preview features > On-object interaction and turning on the Preview switch (see Figure 1). You’ll need to restart Power BI Desktop afterwards.
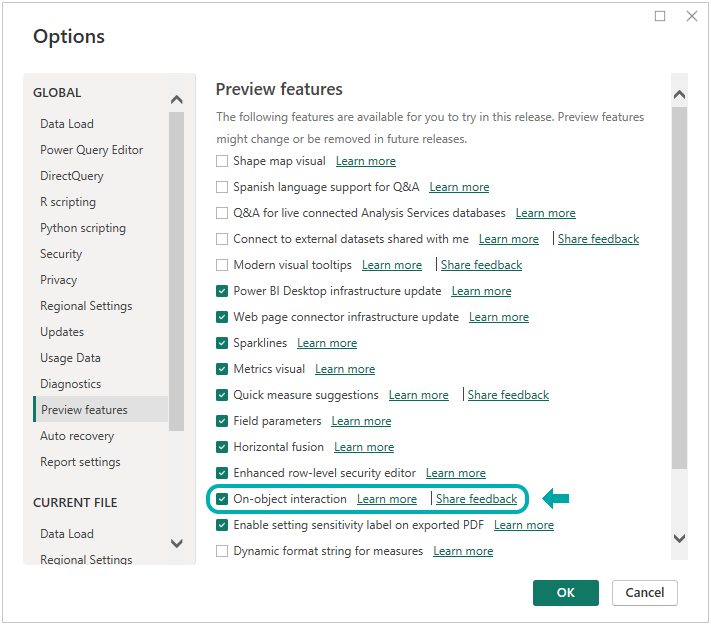
Figure 1: Activating on-object interaction in Power BI Desktop.
What is New in On-Object Interaction?
One of the main changes is the elimination of the visualisations pane; instead, there are two new ways to create a visual:
1. Right-click on the canvas and choose Add visual (see Figure 2A).
2. Select a visual from the new window now accessible on the “Home – Insert” and “Insert – Visuals” tabs (see Figure 2B).
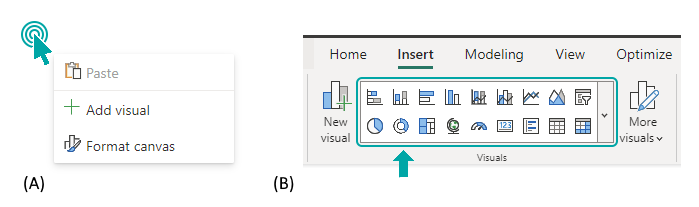
Figure 2: Two new options to add a visual by (A) right-clicking on the canvas or (B) via the new window available on both the “Home – Insert” and “Insert – Visuals” tabs on the ribbon.
In Figure 2B, standard visuals such as bar or line charts can be added from the predefined selection. Additional visuals, together with an overview of all available visuals summarised by category, can be accessed when clicking on the dropdown button on the right-hand side of the window.
In order to illustrate the exciting new on-object properties, we loaded a publicly available Financial Sample Dataset (provided by Microsoft) into Power BI Desktop and used it for this blog post.
When added to the canvas, two buttons appear in the top right corner of the visual (see Figure 3). The upper button (“Build a visual”) allows you to take quick actions like changing the visual type or adding data to an axis, legend, tooltip, etc. A toggle option lets you choose whether Power BI should suggest a type for the respective visualisation or not.
The aggregation type can also be directly changed when adding data that will be summed up in the present filter context. The lower button (“Add to your visual”) enables you to add elements to or to remove them from the visual by ticking checkboxes (title, axis, legend, zoom slider, etc.).
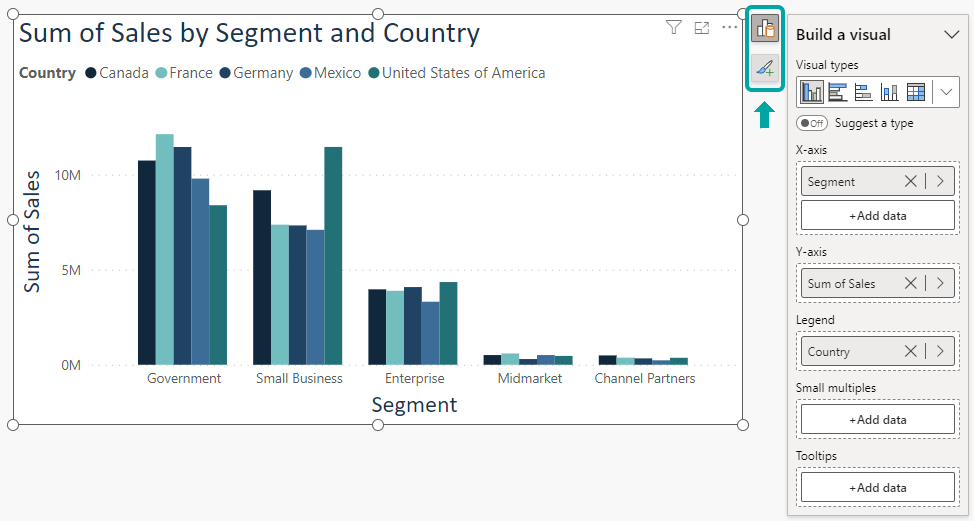
Figure 3: On-object activates two buttons in the top right corner of the visual to modify its characteristics.
The central element of the new on-object interaction comes into play when modifying the visual in format mode (see Figure 4), which can be activated by either double-clicking on the visual or right-clicking on > Format. Note that the surrounding borders of the visual change from grey to blue, and the shape of the handles changes from a circle to a square.
Figure 4: Interacting with an example visual in on-object format mode.
In format mode, the effect of cross-filtering amongst various visuals, as well as the appearance of tooltips when hovering, are disabled. Instead, sub-selection areas become visible and can be formatted as highlighted in Figure 4, with, for example, the modification of the title or labels. Right-clicking on a sub-selection area or the visual background opens a mini-toolbar, which allows you to edit the font or colour settings.
Furthermore, when entering format mode, a new format pane automatically appears on the right-hand side of Power BI Desktop (see Figure 5A). It is basically a merger of the “Format visual” and the “Analytics” tabs of the replaced visualisations pane. On the one hand, the format pane allows for more extensive visual adjustments that are not feasible when interacting directly with the visual on the object, and on the other hand, it enables analytical features like adding error bars or a reference line (min, max, average, median, etc.).
Moreover, the format pane introduces four new features, which offer additional possibilities to customise the visual: subtitle, divider, spacing, and padding. The divider creates a line between the header and the main body of the visual, whereas spacing and padding allow you to add white space within the header and at the visual borders.
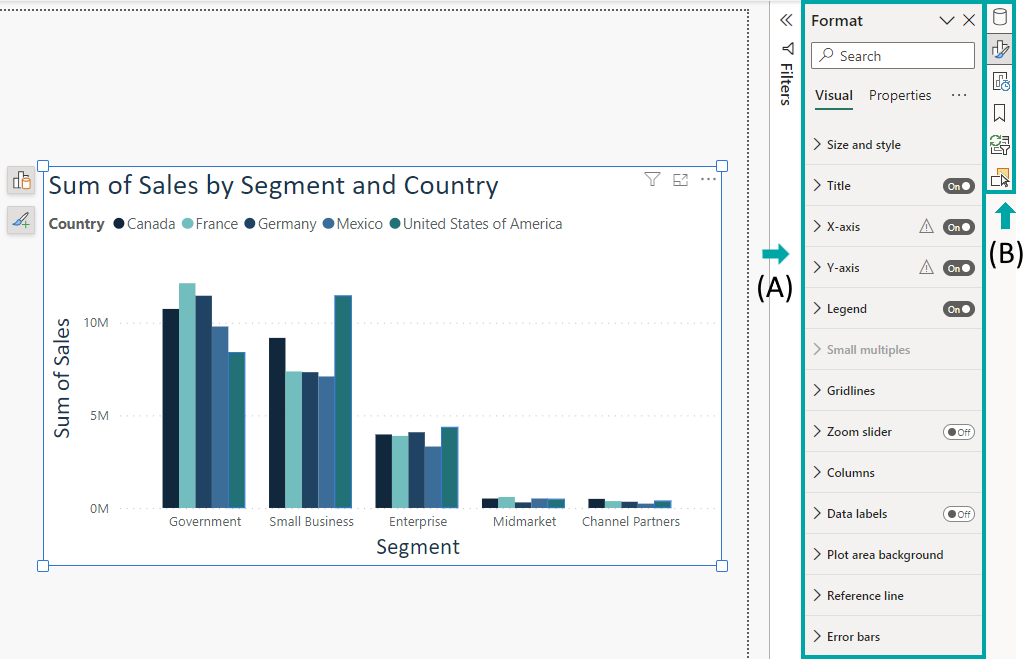
Figure 5: New elements in on-object interaction are the format pane (A) and the pane switcher (B).
Note that the existence of the format pane is not necessarily reliant on interaction with a visual in format mode; the format pane looks the same when leaving format mode with the visual still in focus. With the visual out of focus, the format pane will still be visible but now allows you to format the page rather than the visual information: page information, canvas settings and background, etc. This is similar to the “Format page” tab in the former visualisations pane. However, tooltip and drill-through page settings are now included in the page information subcategory.
Further adjustment options on the visual, such as header icons, tooltips or alt text now appear in the format pane on the “Properties” tab (formerly stored in the visualisations pane on the “Format visual – General” tab). The format pane can be opened conventionally using the ribbon and clicking on its button on the “View – Show panes” tab.
A pane switcher has been introduced too (see Figure 5B), letting you rapidly switch between all opened panes (data, format, bookmarks, selection, etc.). By default, only the pane selected in the pane switcher opens on the right-hand side of the screen, meaning that only one pane will be visible at a time, freeing up more canvas space. Nevertheless, every pane appearing as a button in the pane switcher can be manually opened as a separate window by right-clicking on > Open in new pane.
The filters pane is an exception, because it is always pinned as a separate pane to the left of the opened pane windows. It is also possible to decouple the “Build a visual” button (introduced in Figure 3) from the visual and add it to the pane switcher instead, enabling its use as a separate pane. This is activated by navigating to File > Options and settings > Options > Global – Report settings > Customize sidebar – Always show Build a visual menu in the pane switcher. Note that this can only be selected when Power BI Desktop is already in on-object mode.
Limitations and Ongoing Improvements of On-Object Interaction
This new feature can only be used in Power BI Desktop; Power BI Service and Mobile do not support it yet. And remember that the on-object mode is only available as a preview for now, so not all visuals are fully supported, although complete accessibility is expected soon. For example, only the header information can be edited on a funnel, gauge or waterfall visual, or when implementing small multiples. Microsoft have announced an API so custom visuals can leverage on-object functionality in the future.
In addition, on-object cannot be used for analytical elements such as a reference line, or when viewing a visual in focus mode. Remember that the appearance of visuals modified using on-object might be different from what you expect, when selecting a global theme with the purpose of standardising all visuals within the report. However, the format painter option can be used to copy and paste formatting settings from one visual to another in on-object as well.
You can find a complete list of known issues at the present time here.
So What to Use: On-Object or Off-Object?
Interacting with a visual directly on the object offers the advantage of being able to customise it intuitively by clicking on the respective sub-selection areas, without having to navigate to the right of the screen to search for the correct spot to implement the desired modification. Obviously, this simplifies and improves the overall process of creating and editing a visual. Secondly, the pane switcher is a very helpful innovation, as it enhances clarity and tidiness when working with Power BI Desktop.
However, on-object interaction only allows for a subset of the formatting possibilities and you must navigate to the new format pane in order to implement more advanced options. It may also be tricky to determine which formatting options are currently available on the object and which ones are located in the format pane, leading to potential confusion. Of course, this new feature offers several advantages over the conventional setting, but every user must decide which setting they feel more comfortable with.
Watch out for our next look at this interesting new feature, and in the meantime, don’t hesitate to contact our team of certified Power BI experts if you need some help harnessing this leading technology to boost your business results!