13 Apr 2022 Health Monitoring of NiFi Flows Using Bulletin Events
A typical requirement when using NiFi is the ability to monitor it. Of course, NiFi monitoring is a very broad term, and we recommend you check out this webinar on the theme by Pierre Villard, which gives a very broad and up-to-date (late 2021) view of the topic. In this blog post we are not going to look at all aspects of NiFi monitoring (that’s covered in the webinar), but instead we’ll tackle a specific use case – getting alerts when there is an issue in a NiFi flow. By alerts we mean, for example, an email notifying us of an error.
A way of doing this in NiFi is to make use of the bulletin events: these usually occur when there is an error in a NiFi Processor. For example, the red icon in the image below indicates some errors, and if we hover over the icon, we see the error messages – these are the error messages that go into the NiFi bulletin (note that most processors allow you to configure which level of log messages make it to the bulletin, by default it’s only WARN and above).
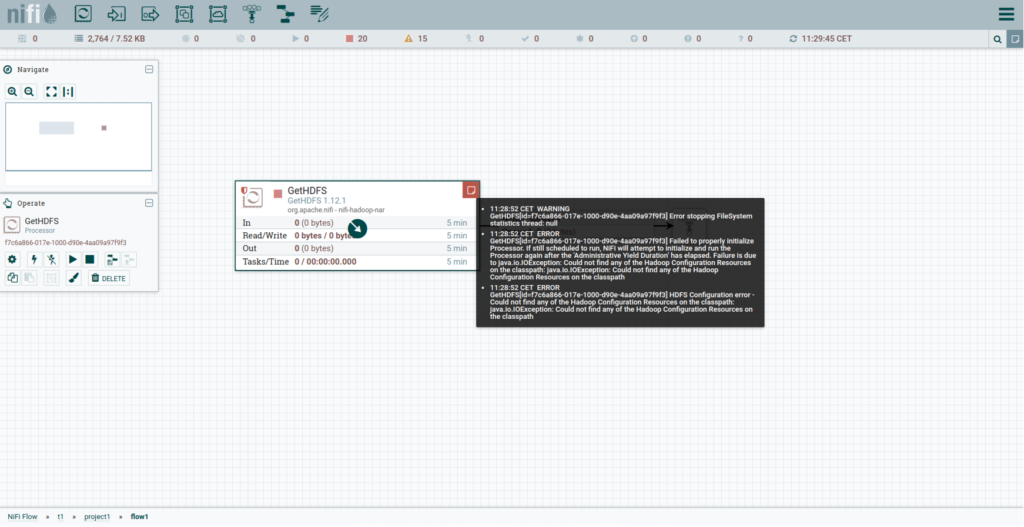
Essentially, the idea is to capture these bulletin events (that usually indicate an issue in a NiFi flow), and send an alert so that the NiFi developer(s) in charge of the flow can take a look and fix the issue.
In order to do so, NiFi has a mechanism called Reporting Tasks – these allow you to collect diagnostic data of what is going on in a NiFi cluster and send it somewhere else. There are many types of Reporting Tasks, and the one we are looking for is the SiteToSiteBulletinReportingTask, which collects the bulletin events, formats them, and sends them to a NiFi instance as FlowFiles. This NiFi instance can either be where we are running our flows, or a different one. Check the official NiFi documentation for a more complete and up-to-date list of available Reporting Tasks.
And don’t forget Pierre Villard’s blogs – this one covers the available Site2Site Reporting Tasks at the time of its writing (2017) and this one is similar to the approach we propose in our blog. However, in Pierre’s blog, he also uses the “Status” Reporting Task while we will only use “Bulletins”.
On the other hand, we also include the necessary settings for Ranger, which you will find useful if you are using Ranger as an authorisation layer for NiFi (which is usually the case in Cloudera deployments). So, if you would like a complete and secure NiFi monitoring flow you may want to extend the solution presented here with other Reporting Tasks such as “Status”.
Security Considerations
While we are on the topic of authorisation, let’s dive a bit deeper: if the NiFi cluster is multi-tenant, i.e. used by different teams, we will usually use access policies to restrict who has access to what flows. Access policy management can be integrated with Apache Ranger, which as we said above is usually the case in Cloudera NiFi deployments, and it’s our case too.
The creation and configuration of a Reporting Task such as the SiteToSiteBulletinReportingTask is done at NiFi root level (NiFi Controller Settings) and should only be done by NiFi admins (these Reporting Tasks essentially give access to ALL NiFi diagnostic data, and we do not want to give this access to all users). Moreover, the default Ranger policies do not allow non-admin users to configure Reporting Tasks and we want to keep it this way.
However, we need to send the bulletin events to the various teams – specific events for a specific team, but not for the other teams that may also be using the NiFi cluster.
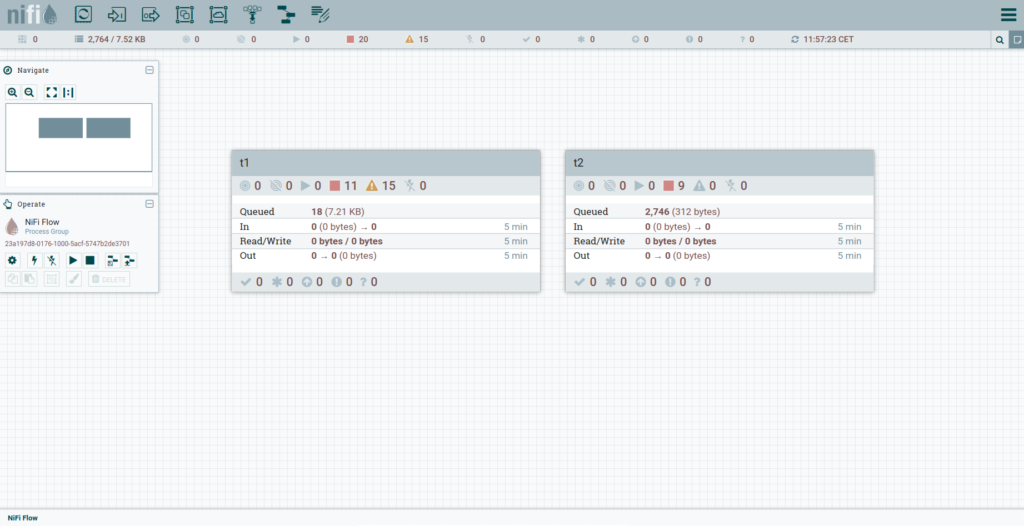
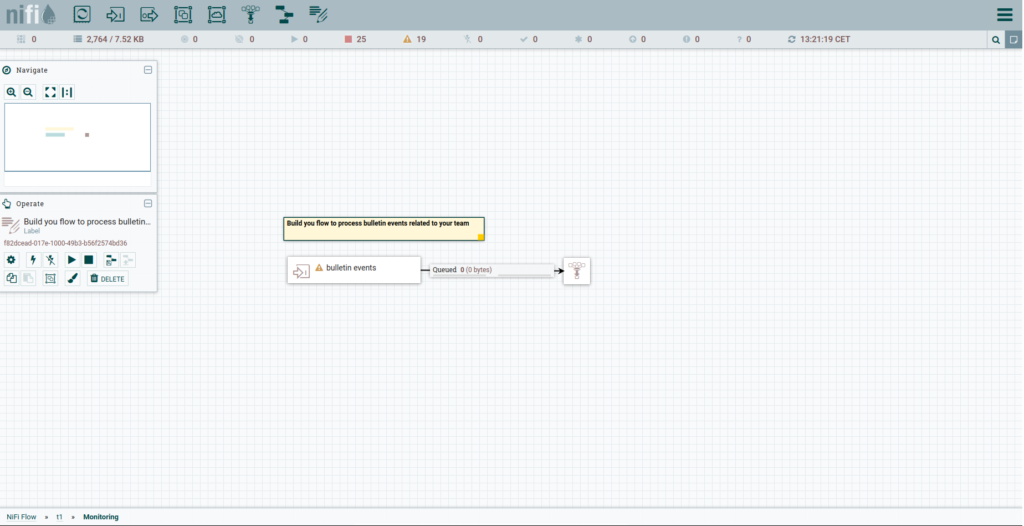
Below you can see how we created a solution that allows bringing team-specific bulletin events to each team. In our case, we assume that each team has a dedicated Processor Group (PG) in the root PG, and each team only has access (via Ranger policies) to its PG, and not to the others. We give each team PG the name of the related team. In our example there are two teams called t1 and t2, so before we start implementing our monitoring solution the NiFi canvas will look like this:
Create SiteToSiteBulletinReportingTask
The first step is to create the SiteToSiteBulletinReportingTask that will gather the bulletin events and send them forward. To do so, click on the top-right actions menu (close to your username) in the Nifi UI at NiFi controller (root) level, and select Controller Settings. Go to the “Reporting Tasks” tab and click on the + button to add a Reporting Task. Create a new SiteToSiteBulletinReportingTask and fill it in with the properties below:
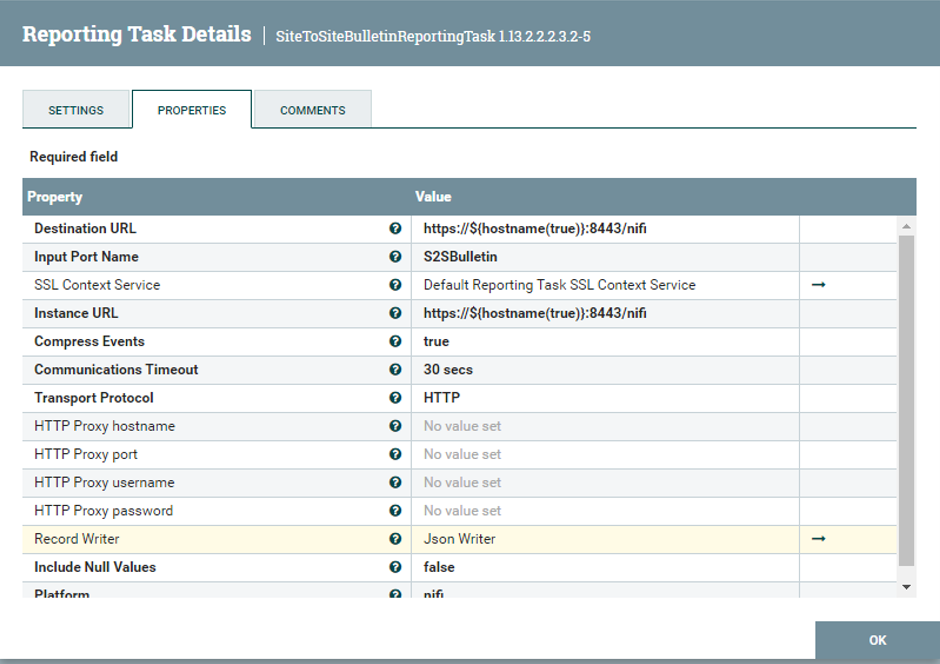
Note:
- The Destination and Instance URLs (https://${hostname(true)}:8443/nifi) point to the local nodes, so basically we are sending the bulletin events to the same NiFi instance we are collecting them from.
- The Input Port Name is the name of the input port that we will create later – S2SBulletin.
- Select the default SSL Context Service that should already be there (our customer was using a NiFi DataHub in a CDP Public Cloud on AWS, and in these cases the default SSL context is created automatically at cluster creation time. Depending on your settings you may need to create your own SSL context service, and you may also be using a different port, so replace 8443 with the port used in your deployment).
- Set the Transport Protocol to HTTP.
- As the Record Writer select (create on the fly) the JSON one (or choose a different one if you prefer).
- We left the default 1 minute in the Run Schedule, so this Reporting Task will execute once per minute, and will put all the bulletin events in a JSON array.
After completing the configuration of the Reporting Task, do not start it yet – proceed to the next step.
Create Root Monitoring Flow
At the root Processor Group, create a Processor Group called Monitoring and develop the following flow inside it as in the figure below. The goal of this PG is to read all the bulletin events sent by the SiteToSiteBulletinReportingTask, determine to which team each event is related, and route the events to different output ports depending on the team.
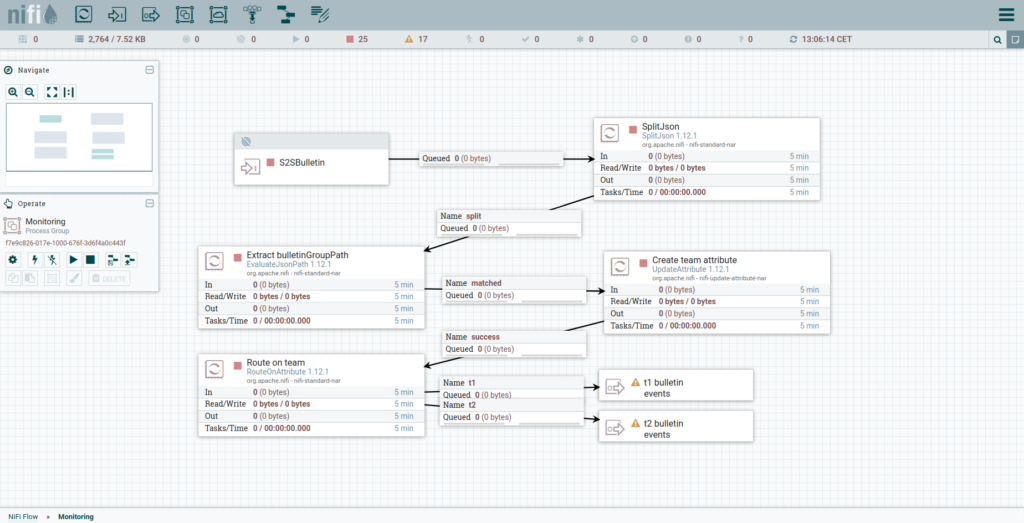
Note:
- The name of the first Input Port (where the Reporting Task will send the bulletin events) must be the same as the name you specified when creating the SiteToSiteBulletinReportingTask (S2SBulletin). Set the “Receive From” to “Remote connections (site to site)”.
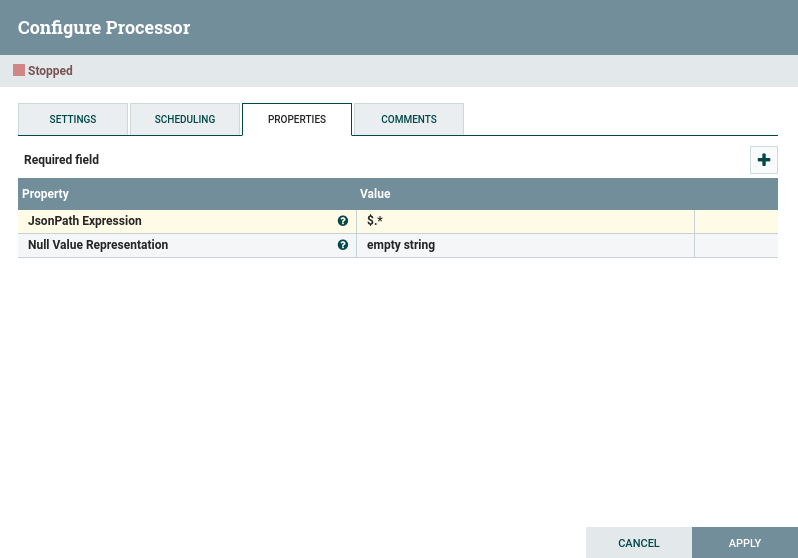
- The SplitJSON processor will get the incoming FlowFiles (which will contain JSON arrays) and will split them into individual FlowFiles (one for each bulletin message) if you set the “JsonPath Expression” to “$.*”. Note that if you selected another type of record writer, you will need to do something different here.
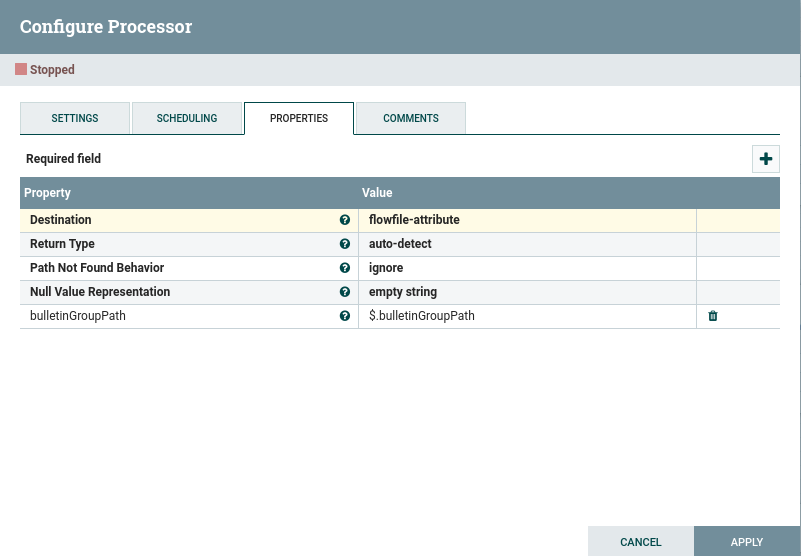
- In the “Extract bulletinGroupPath” Processor (type EvaluateJsonPath) we basically extract the JSON property bulletinGroupPath ($.bulletinGroupPath) into a FlowFile attribute (for this you need to set the Destination to “flowfile-attribute”). This property contains the path within the NiFi hierarchy of the Processor that generated the bulletin. In our case, since we have a PG for each team in the root PG, the bulletinGroupPath will always look like “Nifi/[team name]/…”
- In the “Create team attribute” Processor (type UpdateAttribute), we create an attribute called “team” and we use the bulletinGroupPath property to determine it: team = ${bulletinGroupPath:getDelimitedField(2, ‘/’):trim()}.
- Modify the “Route on team processor” (type RouteOnAttribute) to add or remove routing properties for the various teams that are using the cluster – in the filters (example: ${team:equals(‘t1’)}) make sure you use the same name (example: t1) as the team PG name at root level.
- Create output ports for your teams (in our example for t1 and t2). You will also need to create the links between the RouteOnAttribute Processor and the output ports you create.
After completing the configuration of the Monitoring flow at root level, still do not start it yet – proceed to the next step.
Create Team Monitoring Flows
As described above, we expect each team using the NiFi cluster to have a PG at root level. Inside these team PGs, create a Processor Group called Monitoring; note that you have to do this for every team using the NiFi cluster. Also create an input port called “bulletin events” inside the team PGs (leave “Receive From” as “local connections”).
Finally, in the Monitoring flow in each team PG, create an input port called “bulletin events” (leave “Receive From” as “local connections”) and connect it to a funnel. This is just a dummy flow for our users, so that they can build whatever custom monitoring flow they require.
This simple dummy flow inside the Monitoring flow in each team PG should look like this:
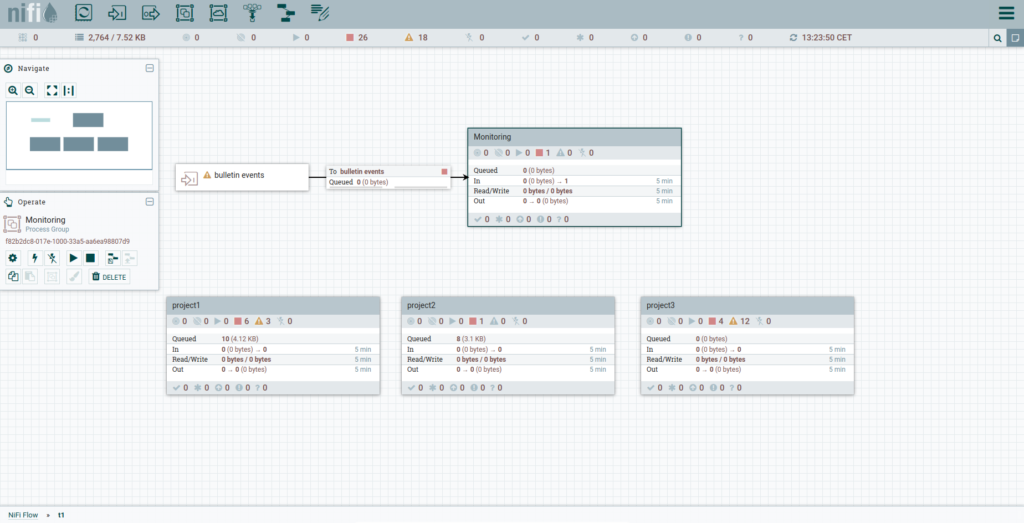
Now, in the team PGs, connect the input port “bulletin events” to the team-specific Monitoring flow input port with the same name. The team PG will look similar to this (example for team t1):
After configuring the team Monitoring flows for all the teams, still do not start any Processor or input ports. Proceed to the next step.
Connect the Monitoring Flows
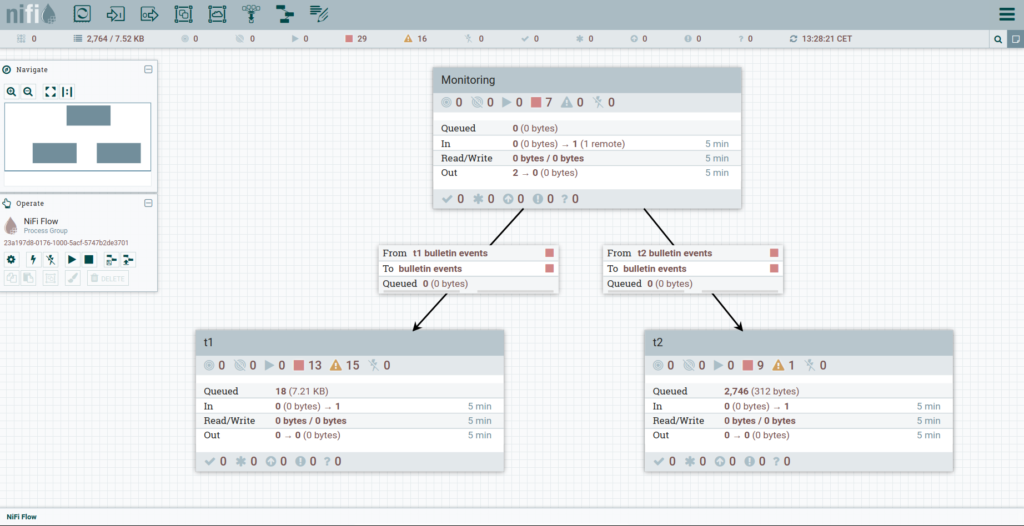
At root level, we are now ready to connect the output ports of the root-level Monitoring flow to the team-specific Monitoring flows. It will look something like this:
Once again, do not start anything at this point.
Ranger Policies
Now that we are done on the NiFi side, we need to add some Ranger policies for everything to work. Before going to Ranger, get the ID of the input port to which the Reporting Task will send the bulletin events, i.e., the S2SBulletin. Select the S2SBulletin input port inside the root-level Monitoring flow, and the Operate window in the UI will show the ID.
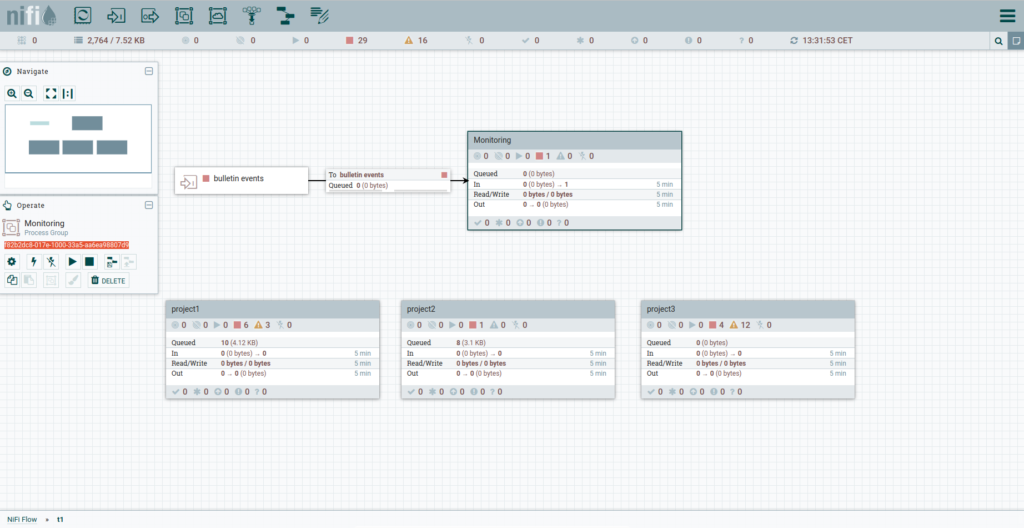
Also get the IDs of the Monitoring PGs in each team PG. Select the Monitoring PG, and the Operate window in the UI will show the ID. See the example below (the ID is the text highlighted in red):
Now, go to Ranger and add the following policies for NiFi:
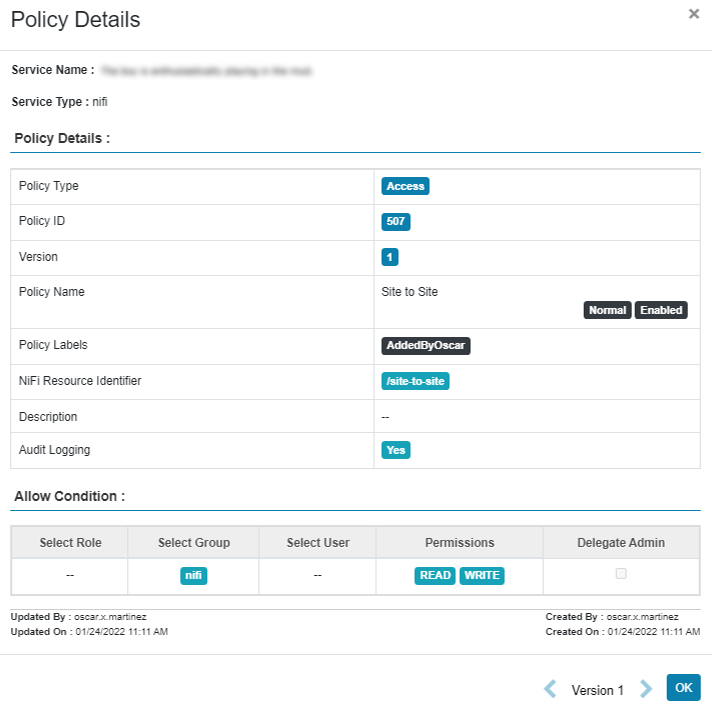
- Site to Site: RW access to NiFi group to /site-to-site – this gives access to the NiFi workers to use the site-to-site mechanism:
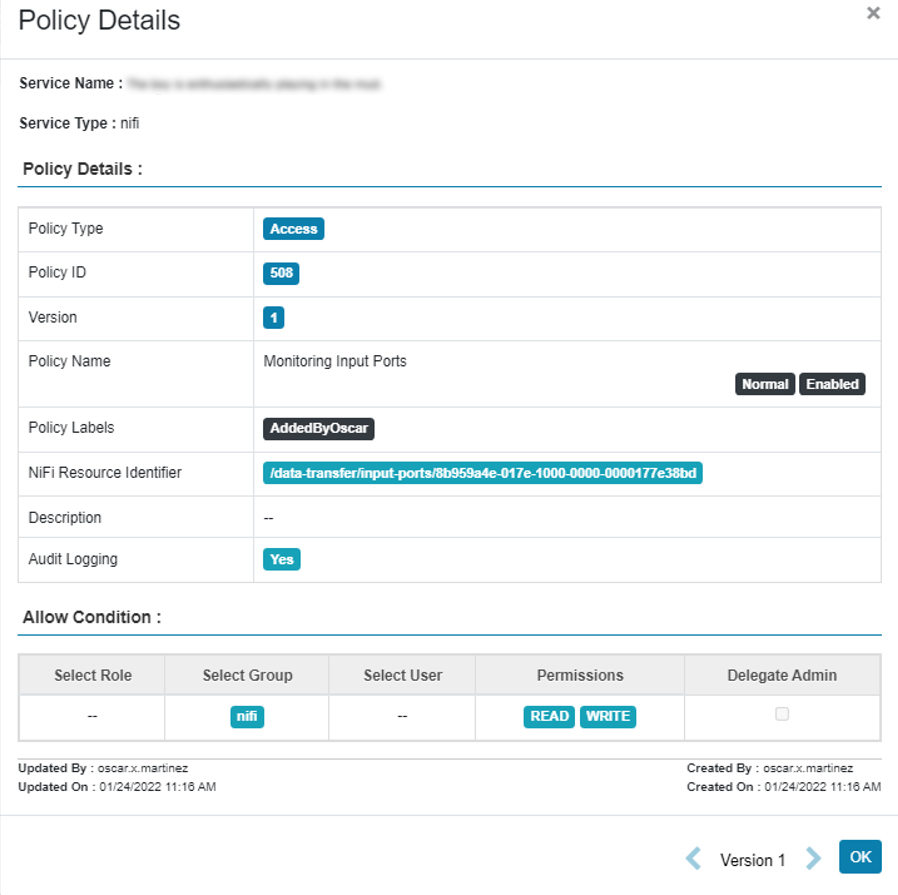
- Monitoring Input Port: RW access to NiFi group to the NiFi resource identifier /data-transfer/input-ports/[S2SBulletin input port ID] – this allows the NiFi nodes to transfer data to the input port:
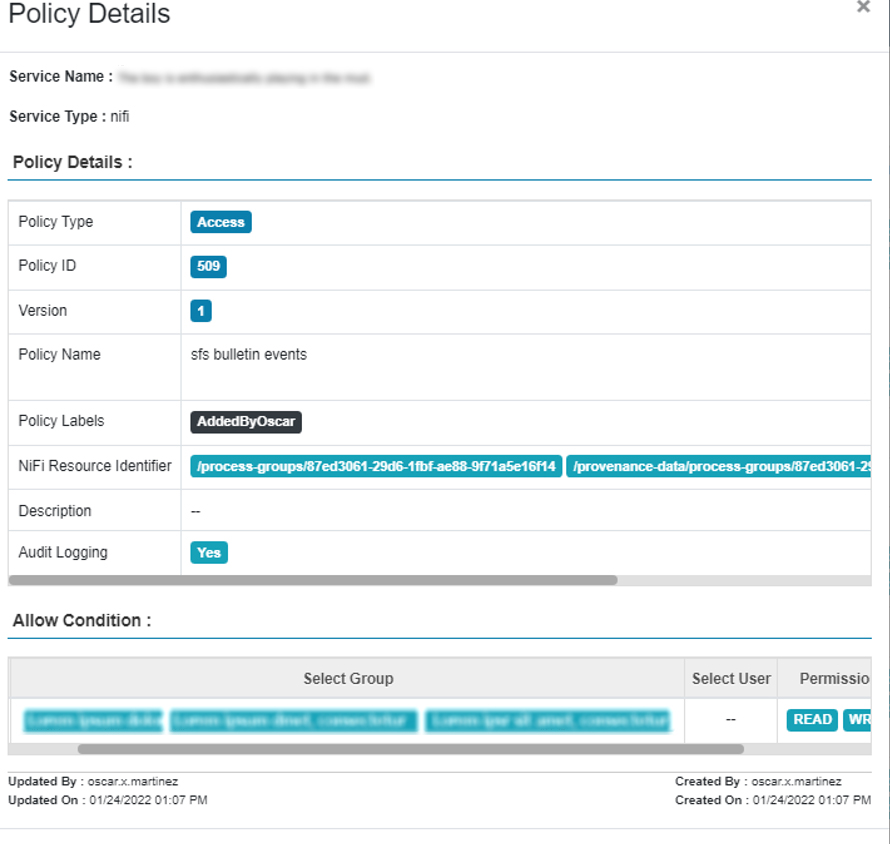
- [team] bulletin events: for every team, we need to add a Ranger policy to give the appropriate team users or groups full permission (RW) inside the team-specific Monitoring flow. The resource identifiers must be:
- /process-groups/[id team-specific PG]
- /provenance-data/process-groups/[id team-specific PG]
Example:
Start the Reporting Task, Monitoring Flow and Ports
At this point we are ready to start the SiteToSiteBulletinReportingTask and the root-level Monitoring flow, as well as the input ports in each team PG.
You can now tell the users that they can start building their custom monitoring flows in the team-specific Monitoring PGs where they will only receive bulletin events related to their team!
Conclusion
In this blog post we have gone through a solution that sets up a starting point for monitoring NiFi flows using bulletin events, and allows us to deal with a multi-tenancy cluster by routing the bulletin events to the team that owns the NiFi flows that triggered them.
As we mentioned above, for production environments you might want to extend the solution explained in this blog post to also include other diagnostic data from other Reporting Tasks. We hope the content of this blog post puts you on the right path. If you require further support with your NiFi flows, do not hesitate to contact us – we will be delighted to help you!