18 Aug 2021 Integrating Cloudera with Dataiku and Power BI for Real-time AI/ML using NiFi and Kafka (part 2/2)
This article is the continuation of our previous entry, in which we explained how to integrate Dataiku DSS with NiFi (aka Cloudera Flow Management) and Kafka to make API calls to an AI/ML model with streaming data on the fly. Now we’ll pick up from there and show you how to handle the API response and push it to a PBI Streaming Dataset, in order to build great real-time visualisations.
For our demo, we are going to need:
- Running NiFi and Kafka instances.
- A Dataiku DSS instance with a running API node, and expertise in creating Dataiku projects and deploying and consuming APIs.
- A Power BI instance with enabled access to Streaming Datasets.
1. Overview
First of all, let’s see what the overall architecture looks like, as depicted in the image below.
On one side, we can see the Kafka-Nifi platform and Dataiku DSS. The usage of these tools and their integration with one another was explained in our previous article, referred to as Part I in the image below (for more Nifi and Kafka use cases with Hive and Kerberos, check here and here).
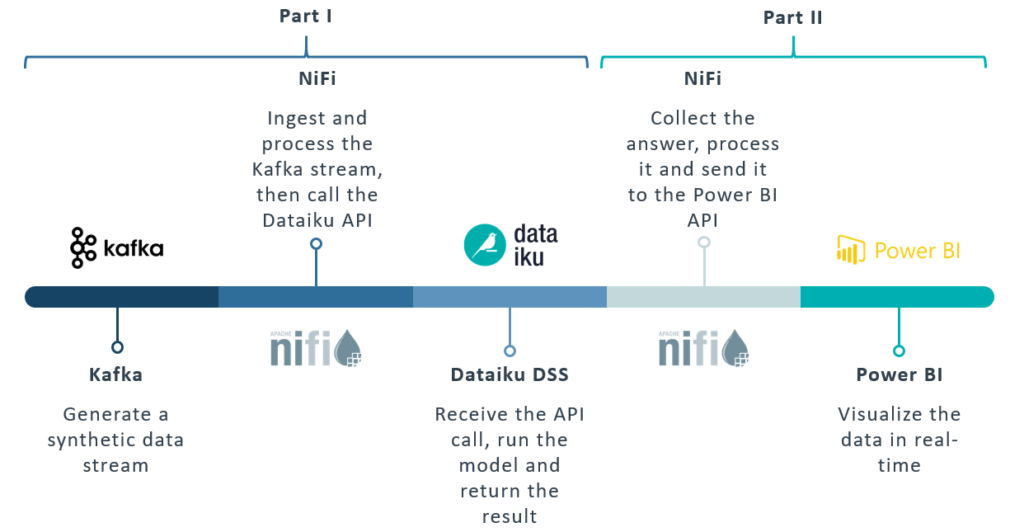
Figure 1: Overview of the full pipeline
Now, in the second part of this blog series, we’ll close the pipeline by introducing Power BI, and specifically its Streaming Dataset, which will allow us to visualise our data and detect possible failures in real time as the streaming data flows through the pipeline.
2. The NiFi Flow
The NiFi flow is depicted below:
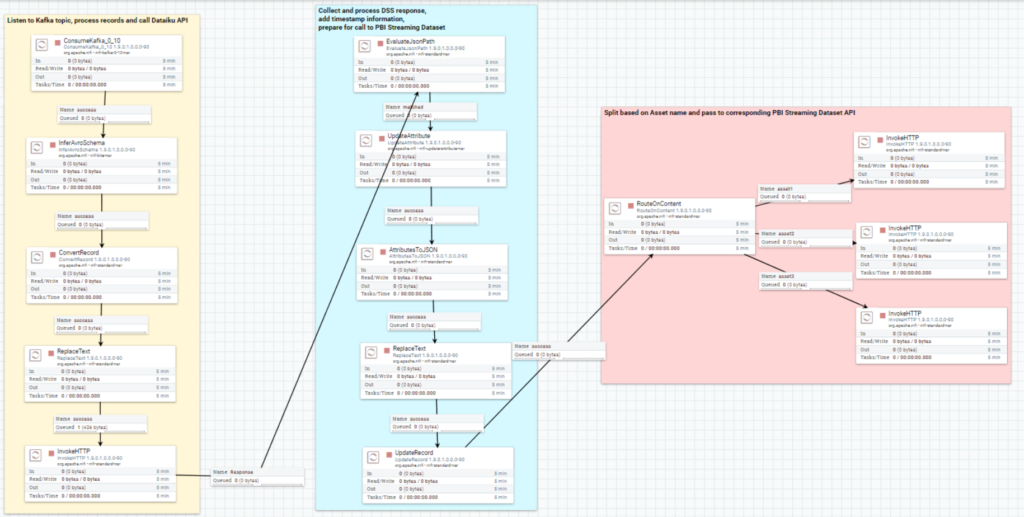
Figure 2: Overview of the complete NiFi flow
In our previous entry, we described the first segment in the yellow area. In this blog post, we’ll look at the details of the rest of the segments in the blue and red areas:
- The second segment (blue area) takes the response of the Dataiku API call, with the result and the probabilities alongside the original features, and also processes the flowfile in order to prepare it for the Power BI Streaming dataset.
- Finally, the last segment (red area) of the NiFi flow routes the flowfile based on the “asset”, which identifies the car described by a specific record. This step is sort of hardcoded, in the sense that we have to know what assets to expect before we are able to split the flowfile accordingly. Of course, there are better ways to handle this, but for the purposes of our demo, the manual split was enough.
3. The Power BI Dashboard
Now let’s take a look at the Power BI dashboard before diving into the NiFi flow details.
As mentioned, we are going to use Streaming Datasets, a custom data source that allows us to build a real-time dashboard displaying data as it flows in from the stream. One drawback of the real-time dashboards in Power BI is their limitations when it comes to customising the way that data is displayed. So, in order to visualise three different lines – corresponding to the three assets we are simulating – we have to create three different Streaming Datasets, like the example shown below:
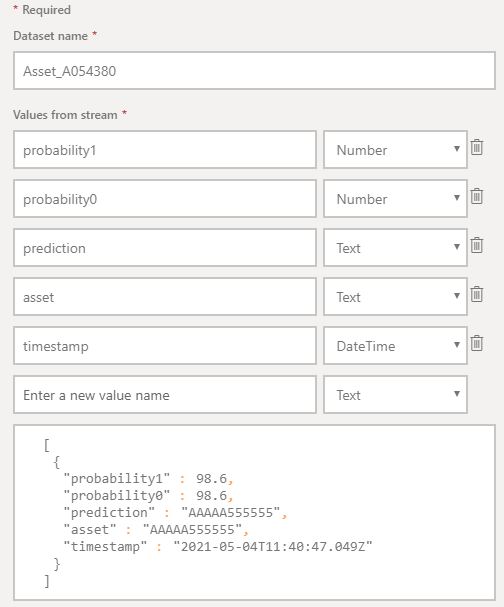
Figure 3: Streaming Dataset in Power BI
When creating the Streaming Dataset, it is important to select the API type, in order to get an endpoint to be called. We need to save that information as we will have to pass it to NiFi in order to push the data to the dataset.
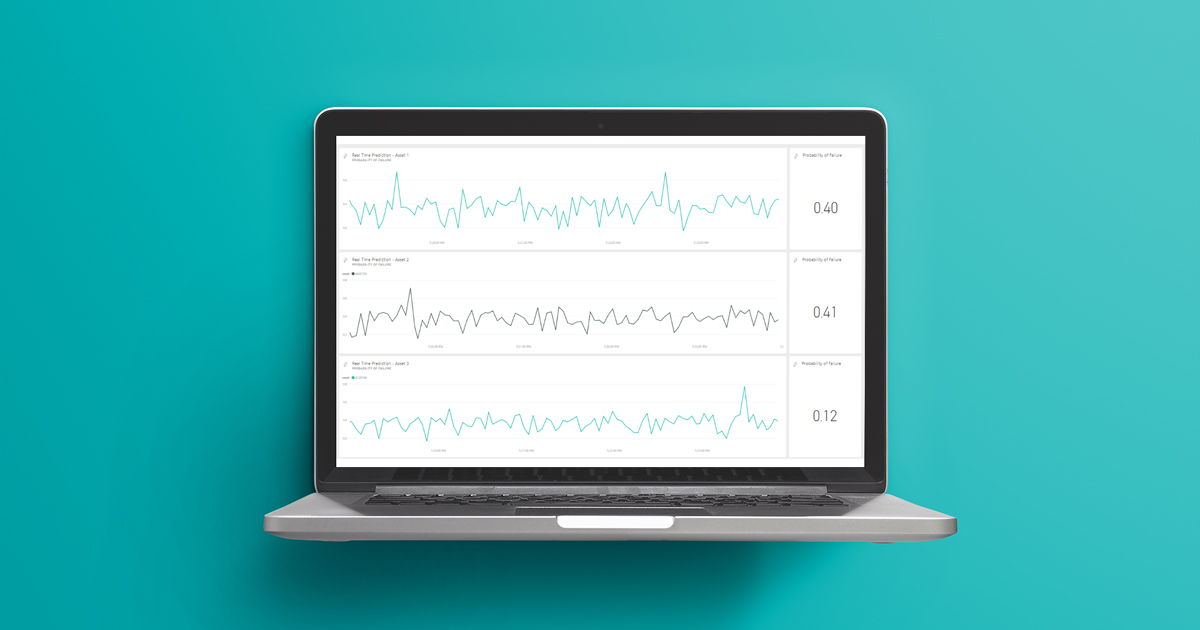
Once we have our three Streaming datasets, building the dashboard itself is quite straightforward: we just stack three line charts, with the probability1 field on the Y axis (probability for the asset to fail) and the timestamp on the X axis.
Note that the timestamp does not directly come from our Python-generated data; it will be added in NiFi, as we will see later. In a real case, however, it will most probably be part of the original source.
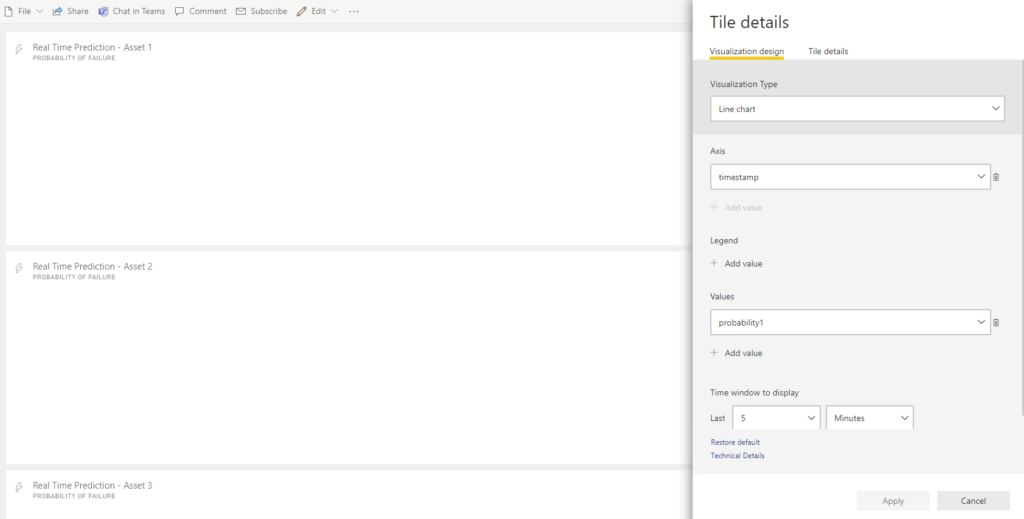
Figure 4: The simple structure of the three tiles of the real-time dashboard
4. Building the NiFi Flow
4.1. EvaluateJSONPath
Our previous blog entry closed with the Dataiku API responding back to us with the answer from the ML model. Once that answer is received, we have to make sure it adapts to the requirements of the Power BI API. As we saw, the DSS API response is rich, and includes not only the prediction from the ML model, but also statistical information, metadata and the original features. We only really need four of them:
- asset name
- predicted value: 0 or 1, where 1 represents a possible failure
- probability of not having a failure (value 0)
- probability of a failure (value 1)
The EvaluateJSONPath processor allows us to map JSON fields from the flowfile content to new attributes, which we will turn into actual values of the flowfile later on. It is important to select flowfile-attribute as Destination and to add one new Property for every field we want to capture. The syntax to parse the JSON values can be seen in the picture below: every field is identified with a $, followed by the field name of each level that makes up the JSON tree structure to the value that we want to recover.
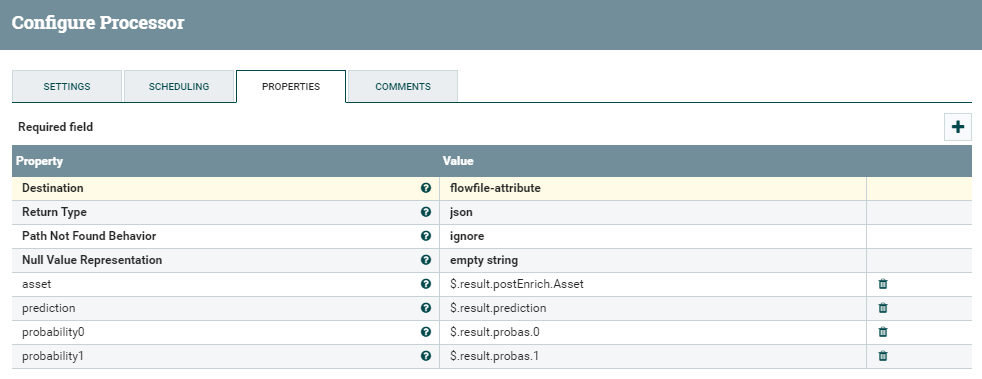
Figure 5: Details of the EvaluateJSONPath processor
The result of this processor can be seen below, where we can find some of the newly-added attributes of the flowfile (prediction, probability0, and probability1).
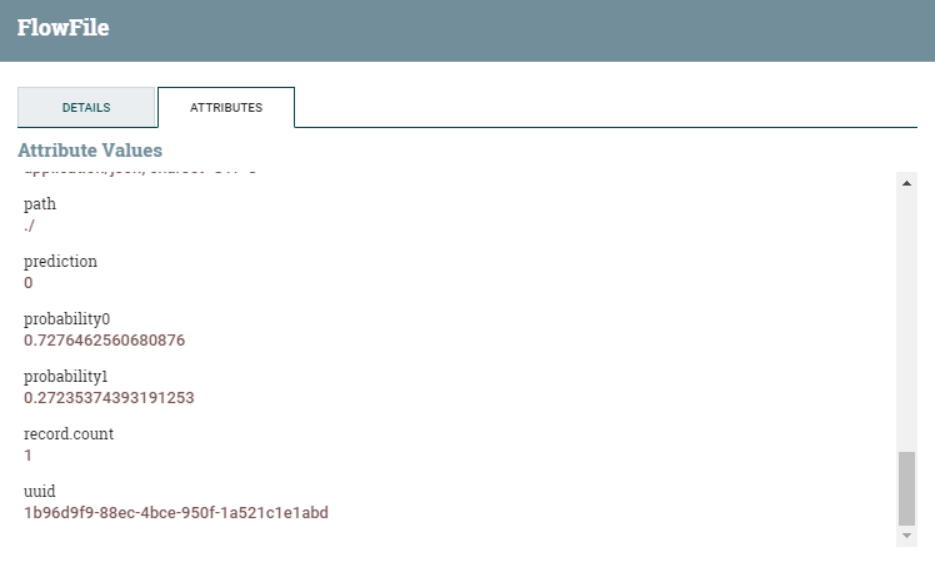
Figure 6: New flowfile attributes added by the EvaluateJSONPath processor
4.2. UpdateAttribute
In this step, we map the result of the prediction to a label: Nominal for 0, and Warning for 1. Of course, this is not necessarily required for our real-time visualisation to work, but we did include a label in the expected payload of our PBI API, and it is worth seeing how NiFi allows you to actually enrich the information in your flowfile.
The processor we need is called UpdateAttribute. It requires an existing attribute and a new value to be assigned to it, which can be the result of one or more regular expressions. In our case, the expression is:
replaceRegex(/prediction,’0′,’Nominal’):replaceRegex(/prediction,’1′,’Warning’)
As you can easily infer, this performs the exact replacements that we wanted.
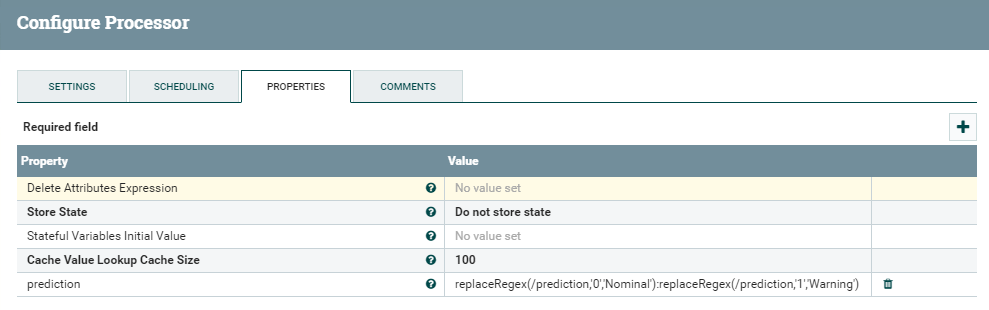
Figure 7: Details of the UpdateAttribute processor
4.3. AttributesToJSON
The logic of this processor is straightforward. As the name implies, it takes the flowfile attributes and turns them into JSON content. To make it work, we only need to specify the Attribute List and the Destination (as flowfile-content).
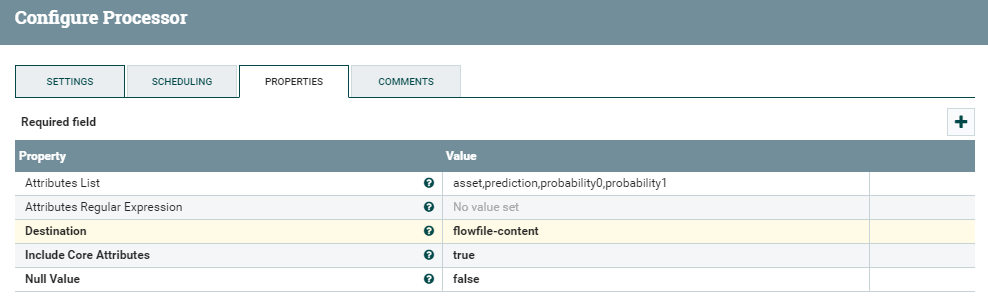
Figure 8: Details of the AttributesToJSON processor
By looking at a flowfile coming out of this processor, we can see how the content is now made up of a JSON with four fields, including the Prediction value updated in the previous step. Note that the numbers are treated as strings: we’ll fix this in the next step.
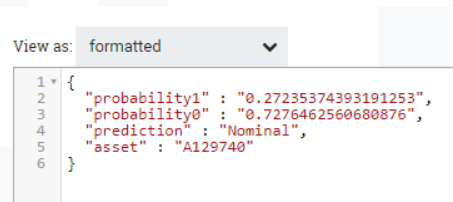
Figure 9: Example of flowfile coming out of the AttributesToJSON processor
4.4. ReplaceText
This processor allows us to replace parts of the text content of the flowfile using regular expressions. In this case, what we need to do is to look for numbers between double quotes, and turn them into actual numerical values by removing such quotes.
This can be done fairly easily with the ReplaceText processor and a simple regular expression, as can be seen in the below picture.
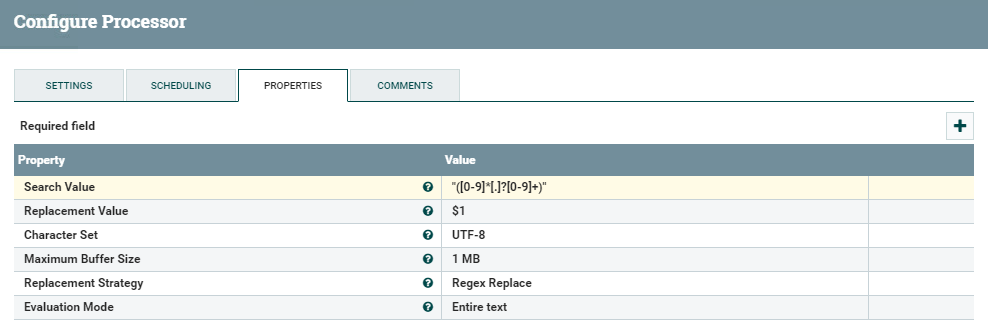
Figure 10: Details of the ReplaceText processor
If we look at the result, we can see how the values of probability1 and probability0 are no longer between double quotes:
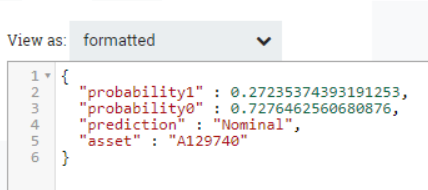
Figure 11: Example of flowfile after the ReplaceText processor
4.5. UpdateRecord
The last step before calling the PBI API is to add a timestamp to our records. In a production environment this would probably not be required, but in our exercise, it offers the double advantage of showing the capabilities of the UpdateRecord processor and of adding the time information that was otherwise missing in the flowfile (and is required by the Streaming Dataset in Power BI to correctly display the data).
The usage is quite simple: we just add a timestamp field with the following value, representing the current timestamp in the specific format required by PBI.
{now():format(“yyyy-MM-dd”)}T${now():format(“HH:mm:ss.SSS”)}
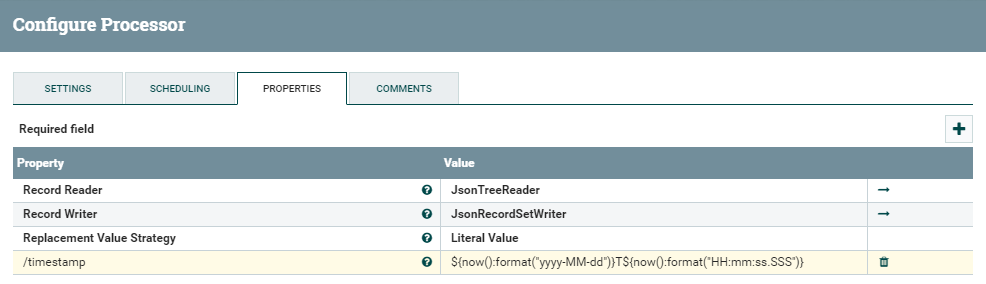
Figure 12: Details of the UpdateRecord processor
The Record Writer used in this step is the one we defined in the first part of this demo. The Record Reader is very straightforward: a simple Json Tree Reader will do the job, with no special changes.
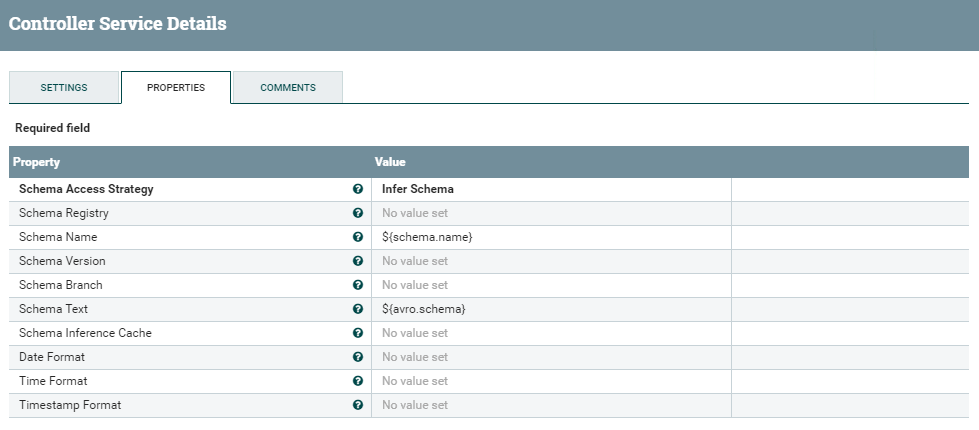
Figure 13: Details of the JsonTreeReader controller service for the Record Reader
The output of this processor is the final JSON flowfile that we will pass to the Power BI API.
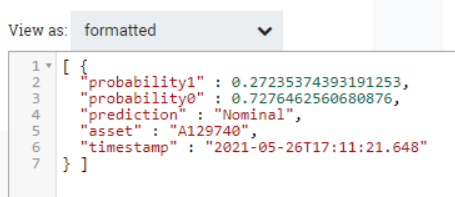
Figure 14: Final content of the flowfile before the call to the Power BI API
4.6. RouteOnContent
Before the actual call to the Power BI API, we need to split our flow (route the flowfiles) into three different branches, one for each asset. As we mentioned, in fact, we need as many Streaming Datasets as the number of assets we want to display.
To do so, we use the RouteOnContent processor, which splits the NiFi flow based on the number of Properties defined in its setting. In this example, we manually specify the value of each of the three assets we have, creating three new processor relationships: asset1, asset2, and asset3.
This would probably not be ideal in a real environment, and there are alternative solutions to reach the same objective, perhaps in a more efficient way: for example, we could use the RouteOnAttribute processor, since we have the asset information as an attribute as well, and then the LookupAttribute to map each asset to the specific Streaming Dataset URL. The optimisation of this step, however, is beyond the scope of this article, and for our purpose – to send data to three different Power BI APIs and visualise it in real time – the solution presented is enough.
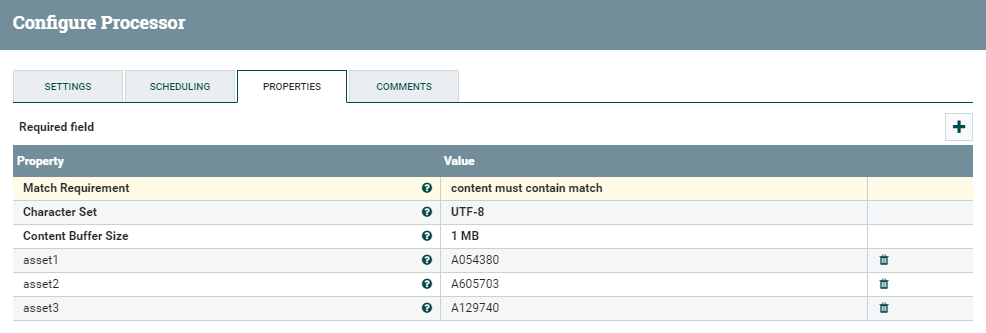
Figure 15: Details of the RouteOnContent processor
4.7. InvokeHTTP
To complete the flow, we have three separate InvokeHTTP processors, one for each asset and related Streaming Dataset. Their settings are very similar: for all of them, we specify POST as the HTTP Method, application/json as the content-type and an SSL Context Service, and the dataset URL provided by Power BI. We also need to specify an SSL Context Service.
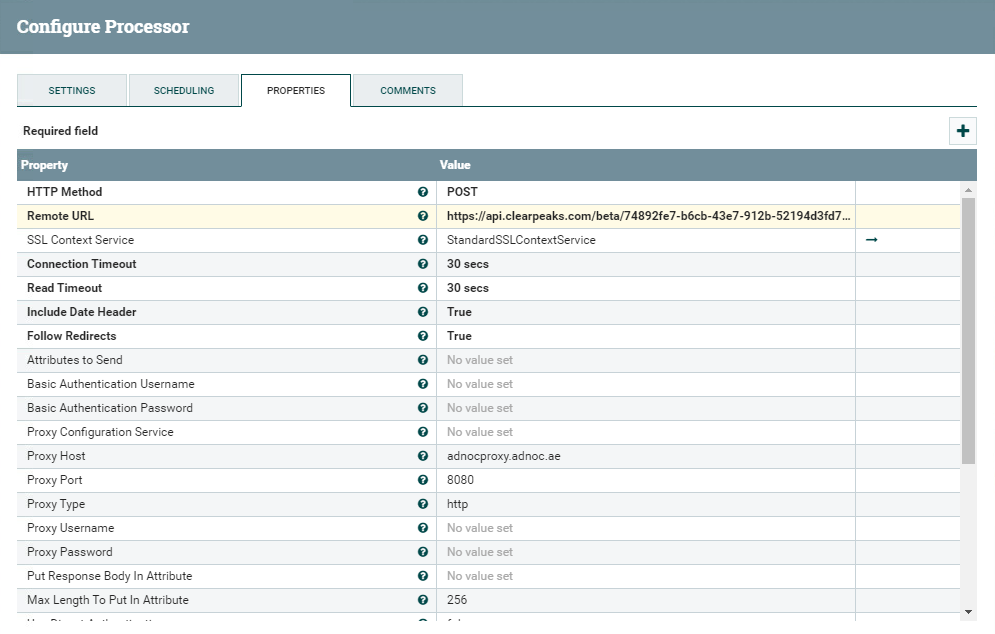
Figure 16: Details of the RouteOnContent processor
4.7.1. SSL Context Service
This service controller allows us to tell NiFi the location of the keystore and truststore in the NiFi host(s), in order to correctly set up a secure communication with the DSS node. Of course, keystore and truststore between the two parties need to contain the required certificates for this to happen. In this case, we can use the same service controller that we defined in the previous part of this demo; the details specified in the picture below are purely indicative and need to be adapted to your specific case:
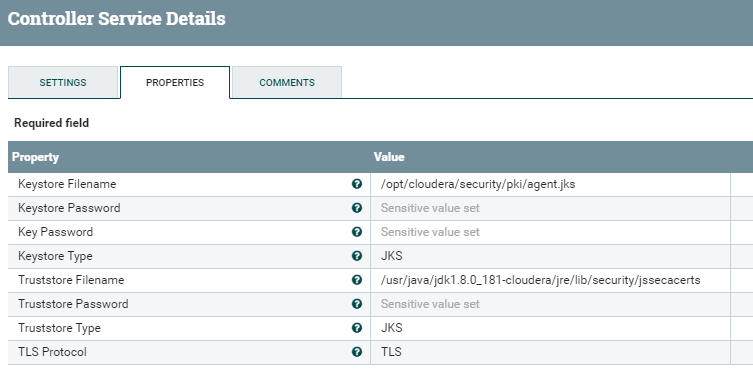
Figure 17: Details of the SSLContextService controller
5. Running the Data Flow
At last we’re ready to start our pipeline! After starting our producers and the NiFi flow, we will see data starting to flow into the Power BI dashboard. Eventually, it will look like this:
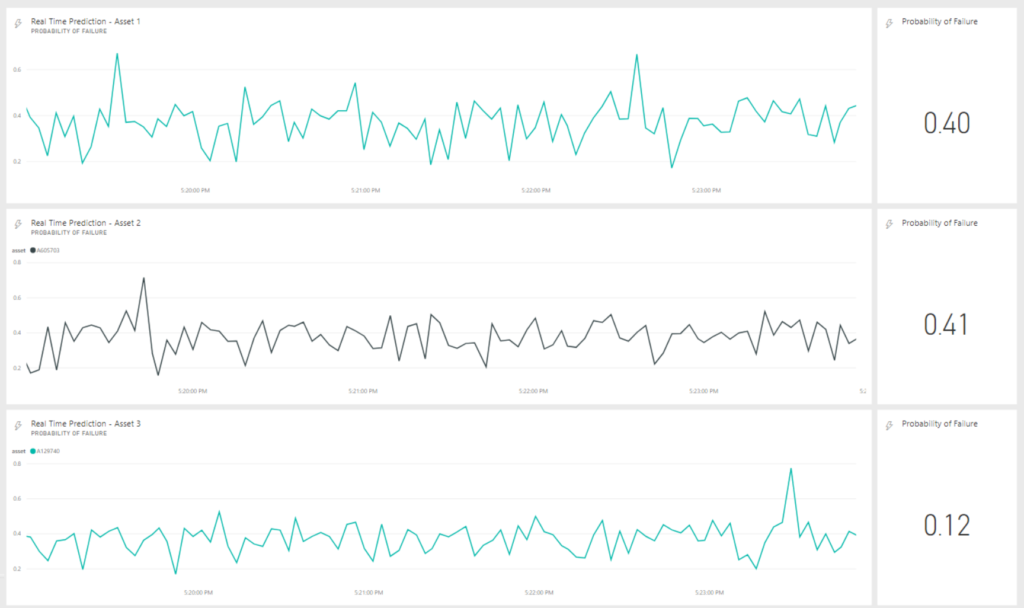
Figure 18: Example of the real-time dashboard running in Power BI
The interaction is neat and clean, and data is really appearing in real time as it flows through our pipeline. There is no need to refresh; and it even works very smoothly on mobile devices!
Note that the dashboard in the above picture is showing data for the last five minutes; this is editable in the dashboard settings.
Finally, also note that NiFi might not be able to correctly interpret the response from Power BI (basically, there is no response) and it might throw a warning in the last three InvokeHTTP processors. However, this is not something that we should worry about.
Next steps
In this article, we’ve completed our look at the integration of three very popular tools: Dataiku, NiFi, and Power BI. While each of them is strong on certain specific data aspects, as you can see, there is so much more we can do when they’re joined together. This example of a real-time AI/ML prediction and visualisation is very powerful, as it enables you to unlock the hidden potential of your data by using slick and user-friendly GUIs. We did not have to write any code at all (except to simulate the stream, but hey, that should not be the case in a real environment!).
It is worth mentioning how Dataiku has recently included streaming capabilities in its latest version (as experimental features – read more here) and we are already working on some tests and potential use cases to showcase this feature as well. So, stay tuned for more content about that!
Finally, if you have any questions, doubts, or are simply interested in discovering more about Cloudera, Dataiku, Power BI – or any other data tool for that matter – do not hesitate to contact us at ClearPeaks. Our certified experts will be more than happy to help and guide you in your journey through Business Intelligence, Big Data, and Advanced Analytics!