10 Jan 2024 Kubernetes Observability with Grafana Cloud
This article is a continuation of our previous blog post Observability in Kubernetes, where we built a Kubernetes cluster and monitored it using the Kubernetes Dashboard tool. As we saw, observability is key to being fully aware of what’s happening with our applications, services, and infrastructure. However, as the observability tool was installed within the same cluster, in the case of cluster disruption we would lose access to see what had happened.
In this blog post, we’ll see how to solve this problem in a more productive environment: Kubernetes in an Azure Kubernetes Service (AKS) with Grafana Cloud as the external observability platform. Decoupling the observability tool from our system will improve observability significantly, because even in the event of cluster outages, we will still be able to access the logs and metrics.
In the following sections we will run through the Grafana Cloud components and functionalities, see how to connect it to an AKS, as well as how to create dashboards and alerts.
An Introduction to Grafana Cloud
Grafana Cloud is a fully managed, cloud-hosted observability platform ideal for cloud-native environments. It is a tightly integrated stack for metrics, logs, and traces, unified within the best dashboarding platform for visualising data.
The platform is built on several open-source projects such as Loki, Grafana, Tempo and Mimir, also known as the LGTM stack.
- Loki is a log aggregation system inspired by Prometheus, responsible for storing logs, processing queries in the LogQL language, and indexing a set of labels for each log stream.
- Grafana is a platform for monitoring and observability, allowing you to query, visualise, alert on, and understand your metrics no matter where they are stored. You can also create, explore, and share dashboards with your team.
- Tempo is a high-scale distributed tracing backend; it ingests batches in several formats, buffers them and then writes them to Azure, GCS, S3 or a local disk. It processes queries in the TraceQL language.
- Mimir is an open-source software project that provides scalable long-term storage for Prometheus.
Prometheus is an alerting and monitoring system and stores metrics and processing queries in the PromQL language. In our case, we used Prometheus instead of Mimir because we did not need Mimir’s scalable long-term storage feature.
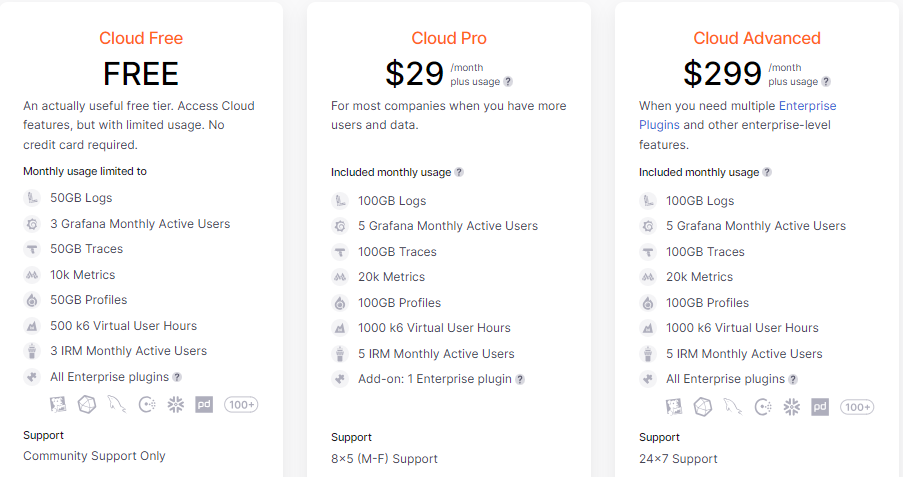
Now that we’ve introduced the LGTM services in the Grafana Cloud stack, let’s check on the pricing options available.
There is a free trial version which allows the storage of 50GB of logs and 10K metrics per month, plus access for 3 active users; this is enough for a development or testing environment.
Grafana Cloud Integration with the Application
Here we’ll see how to integrate Grafana Cloud with the application. In our use case we worked with Loki, Grafana, and Prometheus. We selected these services because Loki gives us vital information about the system from logs, Prometheus from metrics, and with Grafana we can visualise them both and extract powerful insights.
In the picture below you can see our project integration:
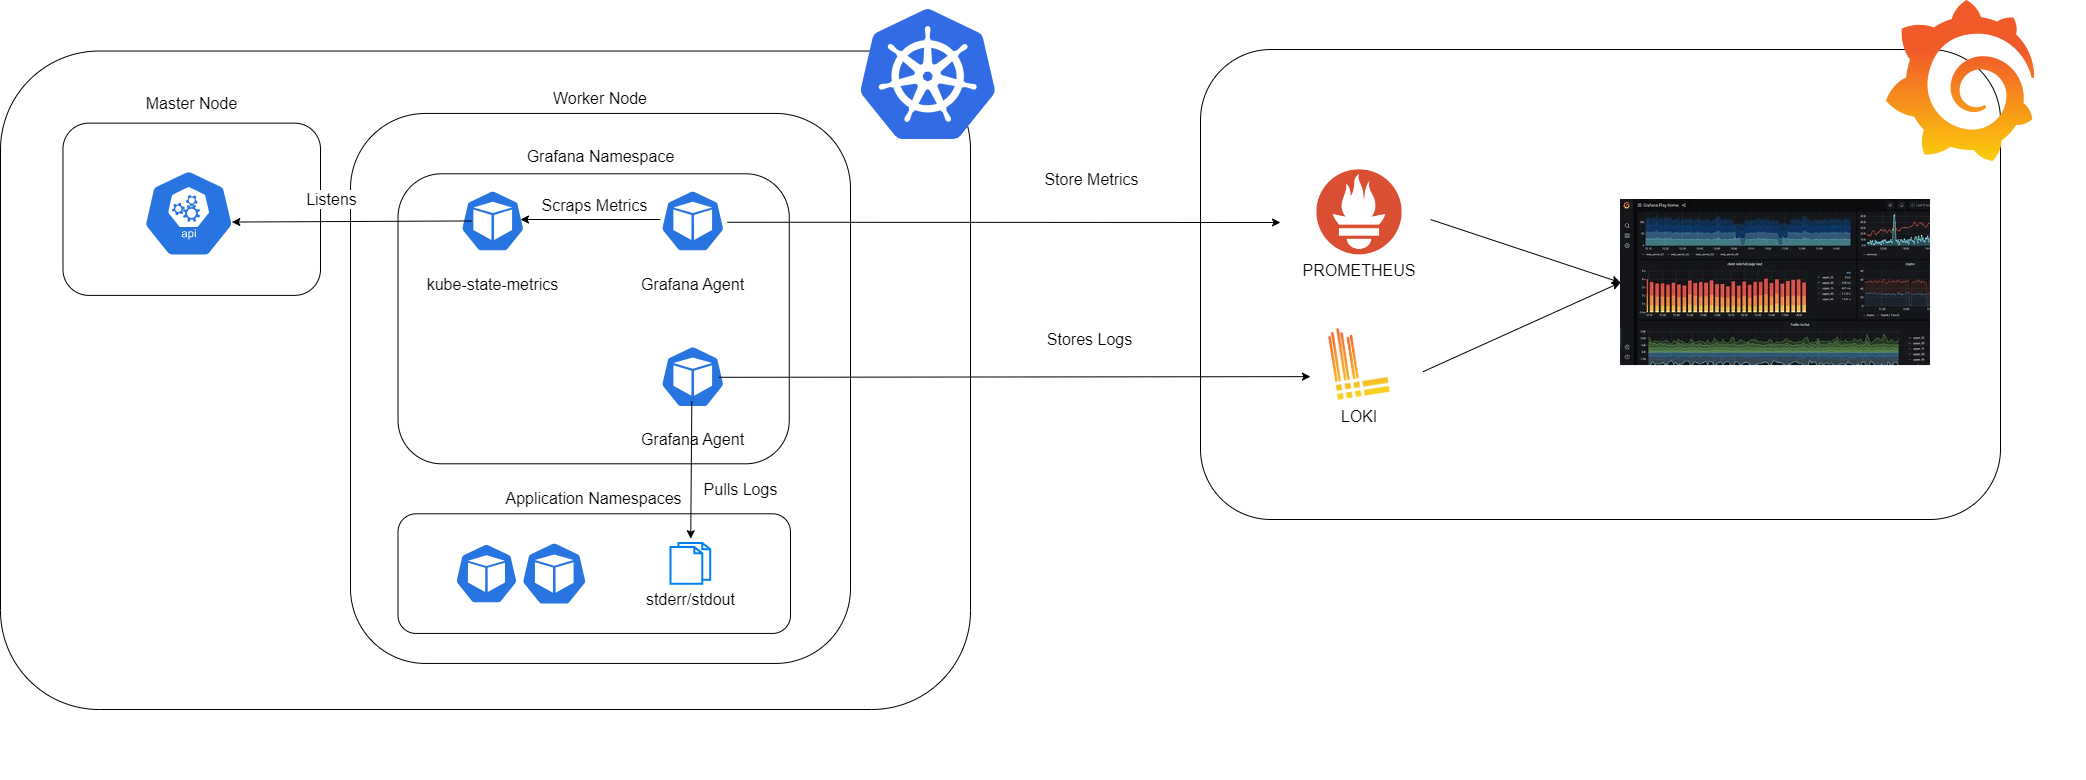
On the left, we have the Kubernetes environment, and on the right, the Grafana Cloud environment. The Kubernetes setup is organised by nodes: at the forefront is the master node, which exposes the API server. This setup allows us to query and manipulate the state of various API objects within Kubernetes, such as Pods, Namespaces, ConfigMaps, and Events. Additionally, there are the worker nodes. In our project, the Grafana Namespace is implemented alongside the Application Namespaces.
Within the Grafana Namespace, we have installed all the necessary agents and services to collect system metrics and logs: one agent specifically for logs, another for metrics, and the kube-state-metrics service. The kube-state-metrics service is constantly monitoring the API server to generate metrics about the state of the objects. These metrics are then made available through an HTTP endpoint. Finally, the agent responsible for collecting metrics scrapes them from this endpoint and stores them in Prometheus.
The logs generated by the Application Namespaces are first stored in the output streams stderr and stdout. The Grafana agent subsequently pulls the logs from these streams and stores them in Loki.
Once the metrics and logs are available in the Prometheus and Loki systems of the Grafana Cloud environment, they can be queried by using the appropriate languages, PromQL and LogQL, to craft the dashboards.
Connect Grafana Cloud to an AKS
Before jumping into how to connect Grafana with an AKS, you should already have a deployed AKS environment, containing a microservice. We’re using the Google Online Boutique microservice, as explained in our previous blog post.
First, go to the Grafana Cloud homepage and find the Kubernetes section.
Then, click on Start sending data > Configuration > Cluster configuration. An easy-to-follow guide to configure the cluster will appear.
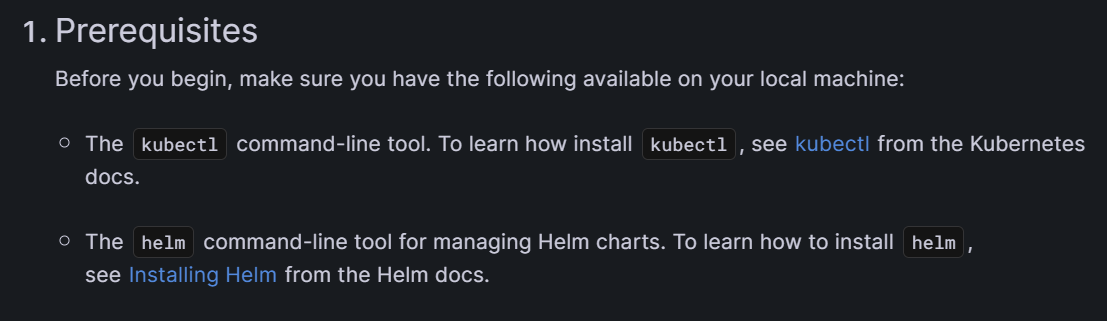
First, we must install some prerequisites to be able to carry out the next steps. Here are the links you’ll need to install kubectl and helm.
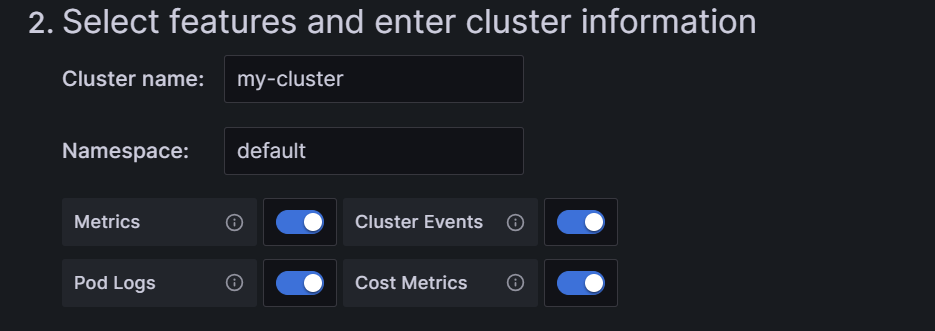
In step two, we have to write the cluster name and namespace, and select the agents that we want in our cluster. The most important are Metrics and Pod Logs, essential to get Prometheus and Loki operational.
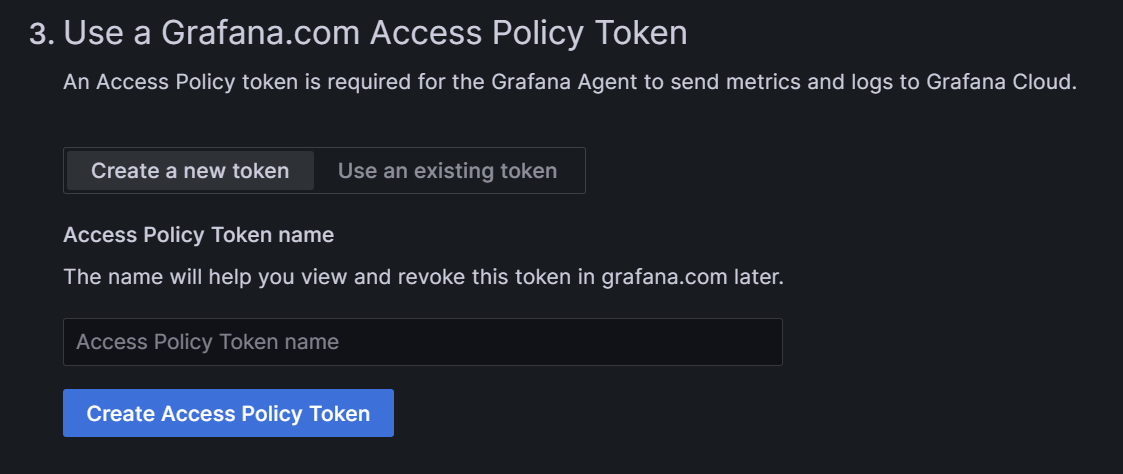
In step three, we get the access policy token: we can either create a new token or use an existing one. If it is your first time configuring a cluster, create a new token, encrypt it, and store it for further use.
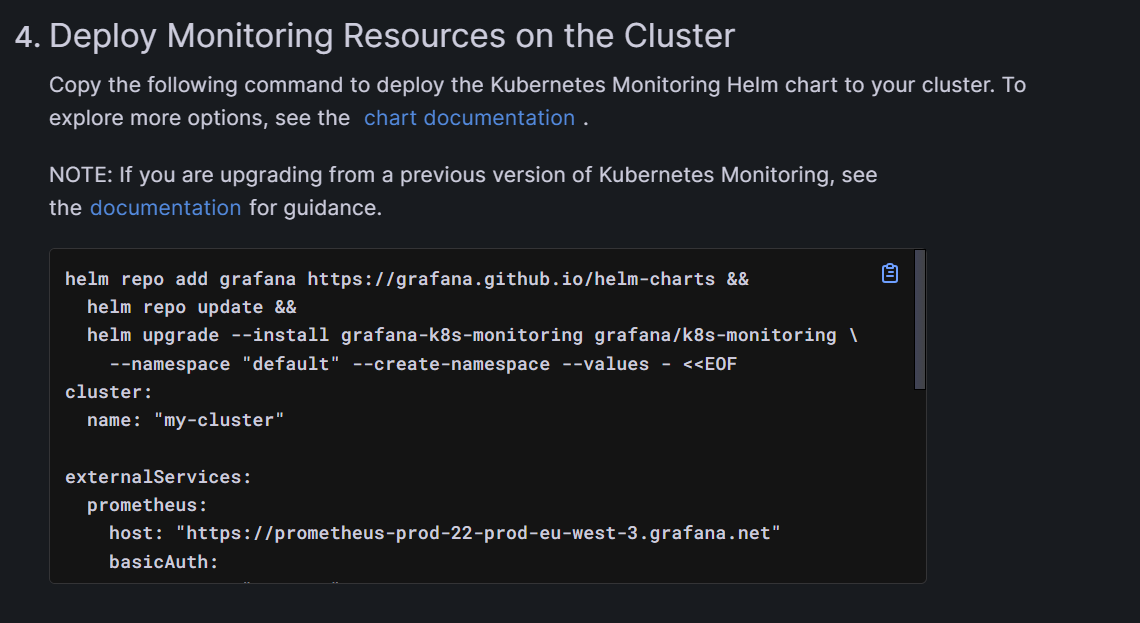
In step four, Grafana prepares a script to install and configure the agents, previously selected in step 2, that run on the specified namespace inside your cluster. You can either use the script as it is, or tune it if you need to change some parameters.
And you’re done! Now go back to the home page and check if the cluster is ready by going to the Kubernetes section, selecting Configuration, and then clicking on Cluster status, where you should see the configured agents running inside the cluster:
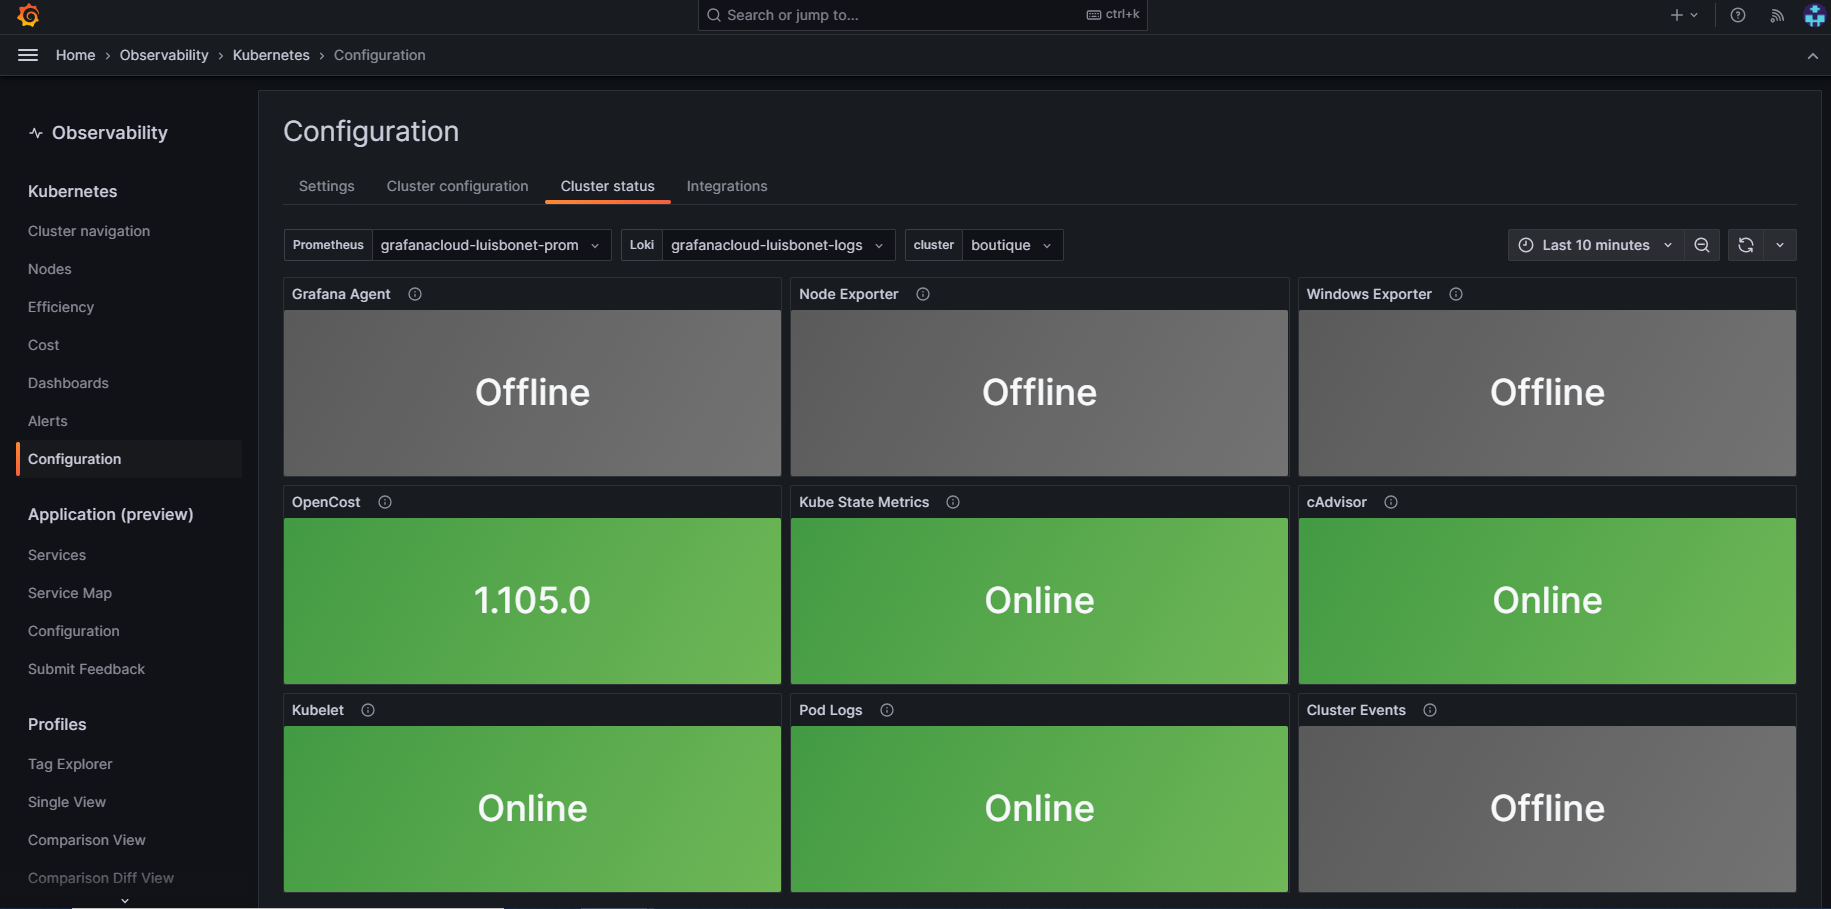
Grafana Cloud offers many functionalities, like real-time insights, customisable dashboards, enhanced troubleshooting, alerting and notifications, etc. But the key feature is that even if the cluster crashes, the logs will persist, and we can still access the application and check the cluster status.
In the following sections we will explain some different ways to create dashboards, and how to set up an alerting system.
Creating Dashboards in Grafana
Now that the application is seamlessly integrated with Grafana Cloud, logs and metrics will be scraped by the Grafana Cloud environment by means of the agents configured previously. Now we can create dashboards that will be useful to monitor the system.
In Grafana there are two different ways to create dashboards: importing them from the community or creating them from scratch.
Community dashboards can be very useful for learning, for getting new ideas, and for their rapid deployment. Nevertheless, these pre-built dashboards don’t always meet our needs, so sometimes we find ourselves adapting them. You can search for community dashboards in Grafana at the following link: Grafana Public Dashboards.
Bear in mind that if you work with community dashboards you might need to adapt the parameters, because the configured global variables may not synchronise with those you have configured, so queries will receive the wrong values.
It’s also possible to simply reuse a specific panel from a community dashboard by just copying it then adding it to the desired dashboard.
If the dashboard you are about to build does not require specific metrics, visualisations, colours, corporate appearance themes, etc., you could work with community dashboards. If not, we recommend building them from scratch.
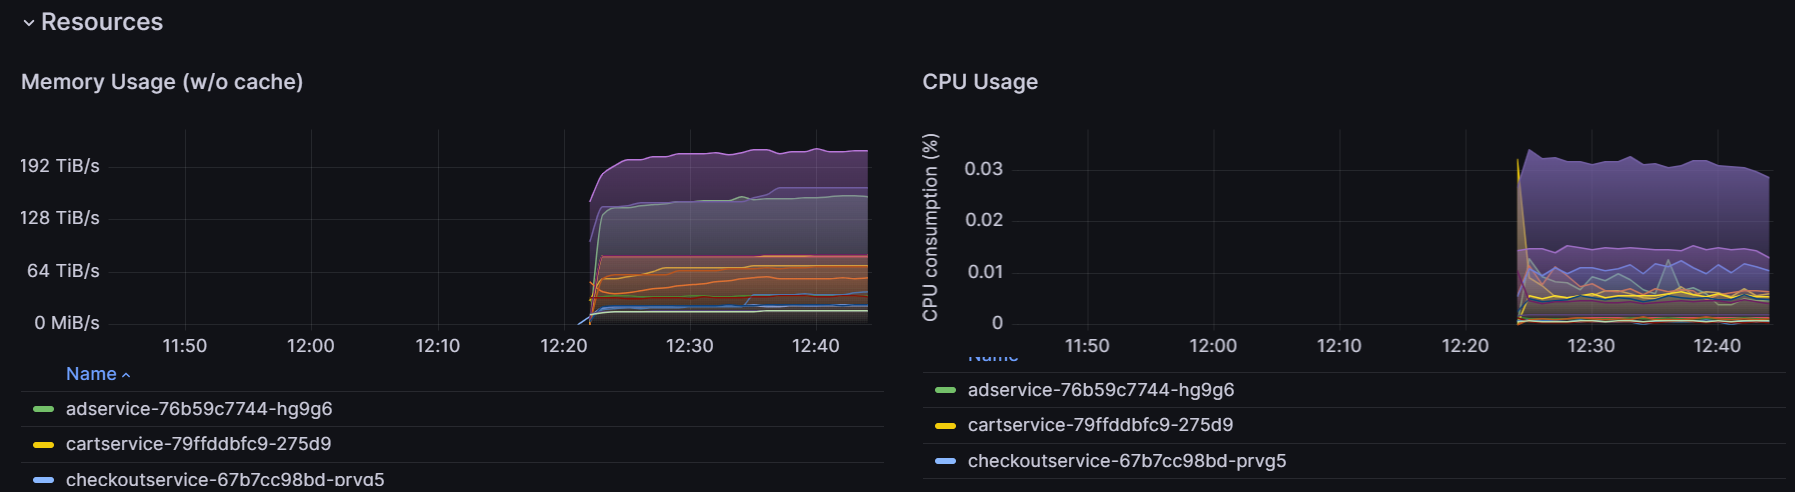
For this blog post, we created some custom visualisations to monitor our AKS cluster. Here are some of them:
- Two panels showing the memory and CPU usage of each pod inside the cluster over time:
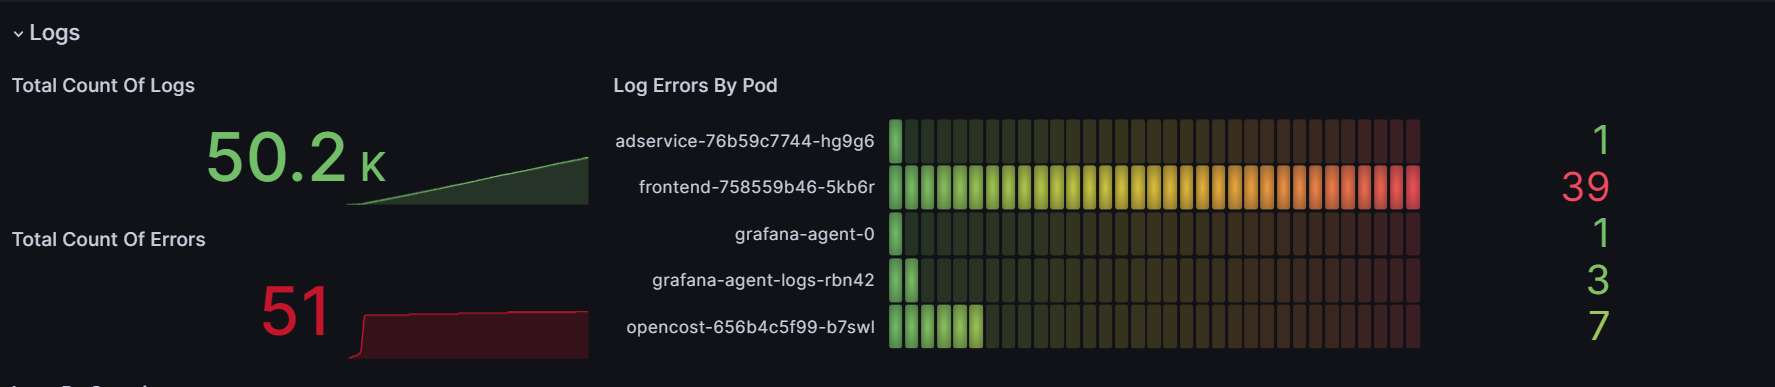
- Three panels giving us core information about the system logs. The first two panels are counters, one for the total count of logs and the other for the total count of errors. The third panel shows “Log errors by pod”, i.e. the number of errors per pod:
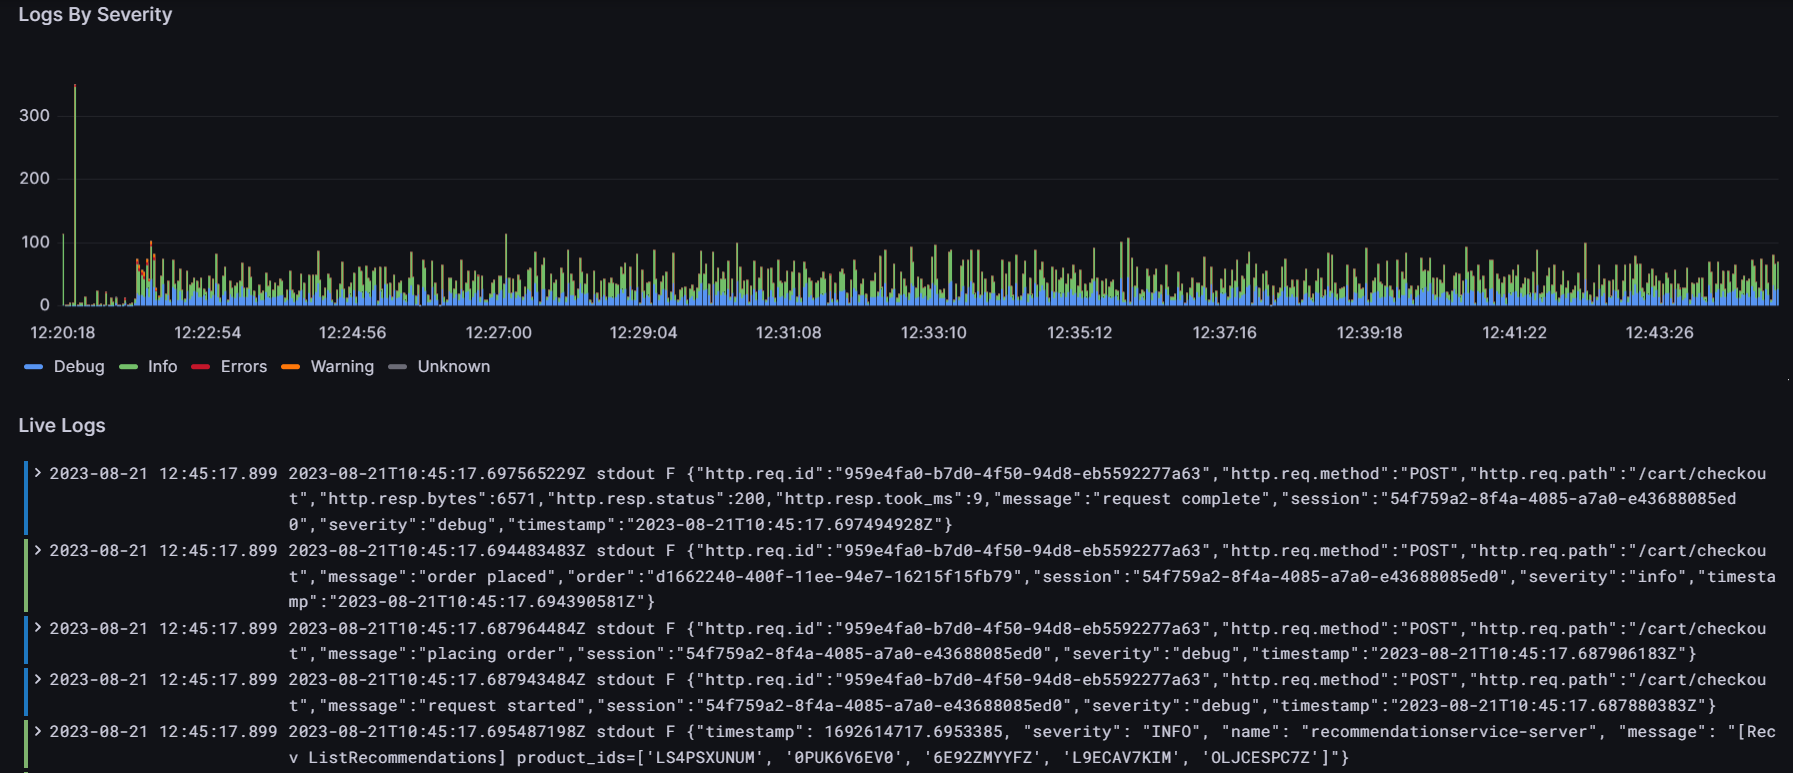
- There’s also a panel that shows the number of logs over time grouped by their severity: info, debug, error, warning, unknown and critical. Linked to this panel, we created a list of the latest logs in the system that can be filtered by selecting a specific time range in the “Logs by severity” panel. The colours of each log in the list indicate their severity level:
We’ve found that importing community dashboards can be highly beneficial and save you a lot of time. However, when creating dashboards from scratch, we can achieve a more comprehensive outcome, allowing us to tailor panels to our specific requirements and to give them our own unique design.
Alerting
In this section we will explore how to configure alerts that notify support teams in the event of unexpected behaviour in metrics and/or logs. This serves as a crucial first line of defence, enabling teams to respond swiftly and prevent minor issues from escalating into major incidents.
Grafana Alerting allows us to promptly detect issues within our system as they arise, monitoring incoming metrics and logs, setting up a system to watch for specific events or circumstances, sending notifications when necessary.
To create and configure alerts, and to establish some contact channels in case something unexpected happens in the system, we must first click on the Toggle Menu on the left side of the Grafana Cloud homepage and then click on Alerting , Alert rules, then Manage alert rules.
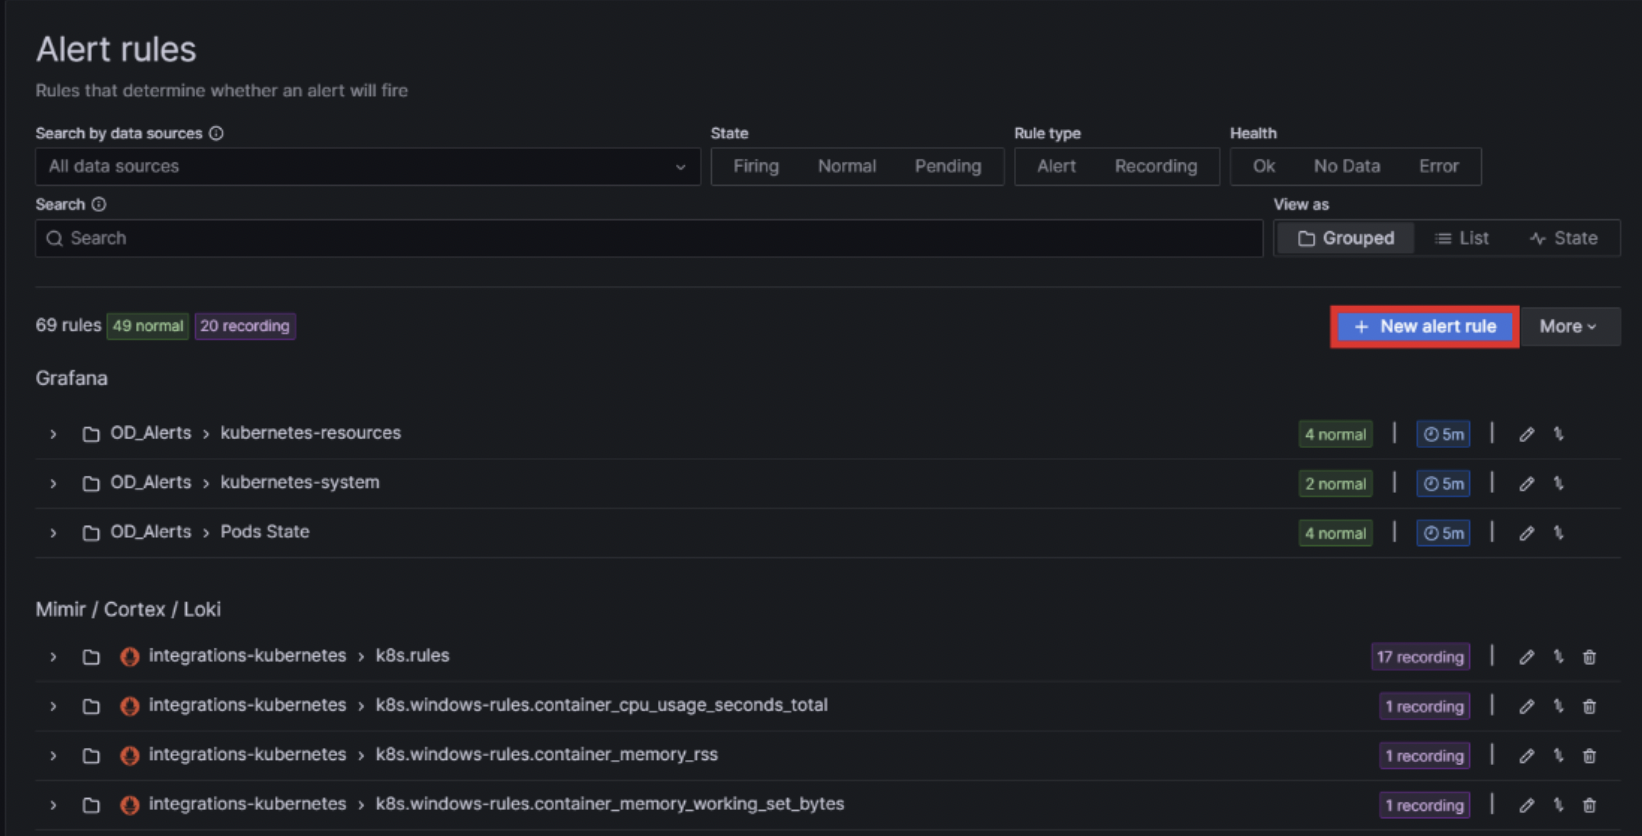
This is where all the configured alerts are displayed; they can be organised in folders. The alerts named “OD_alerts” are those that we have created, whilst the others are from Grafana by default. To create a new alert, click on + New alert rule:
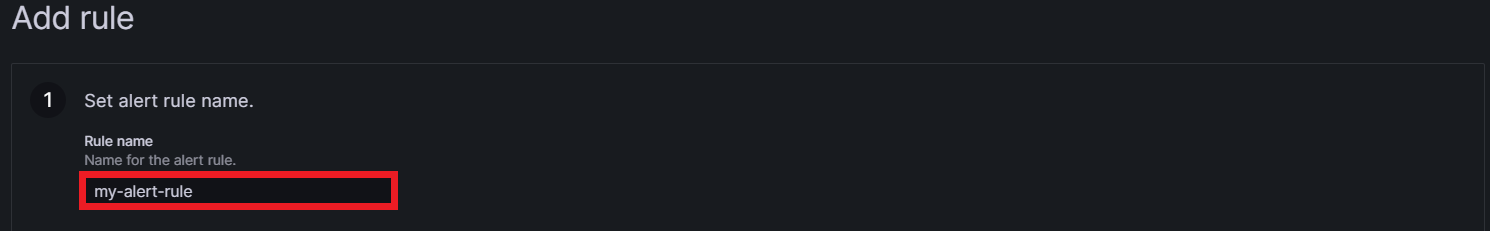
A section named Add rule will appear on screen showing the necessary steps to create an alert. Step one is to set an alert rule name:
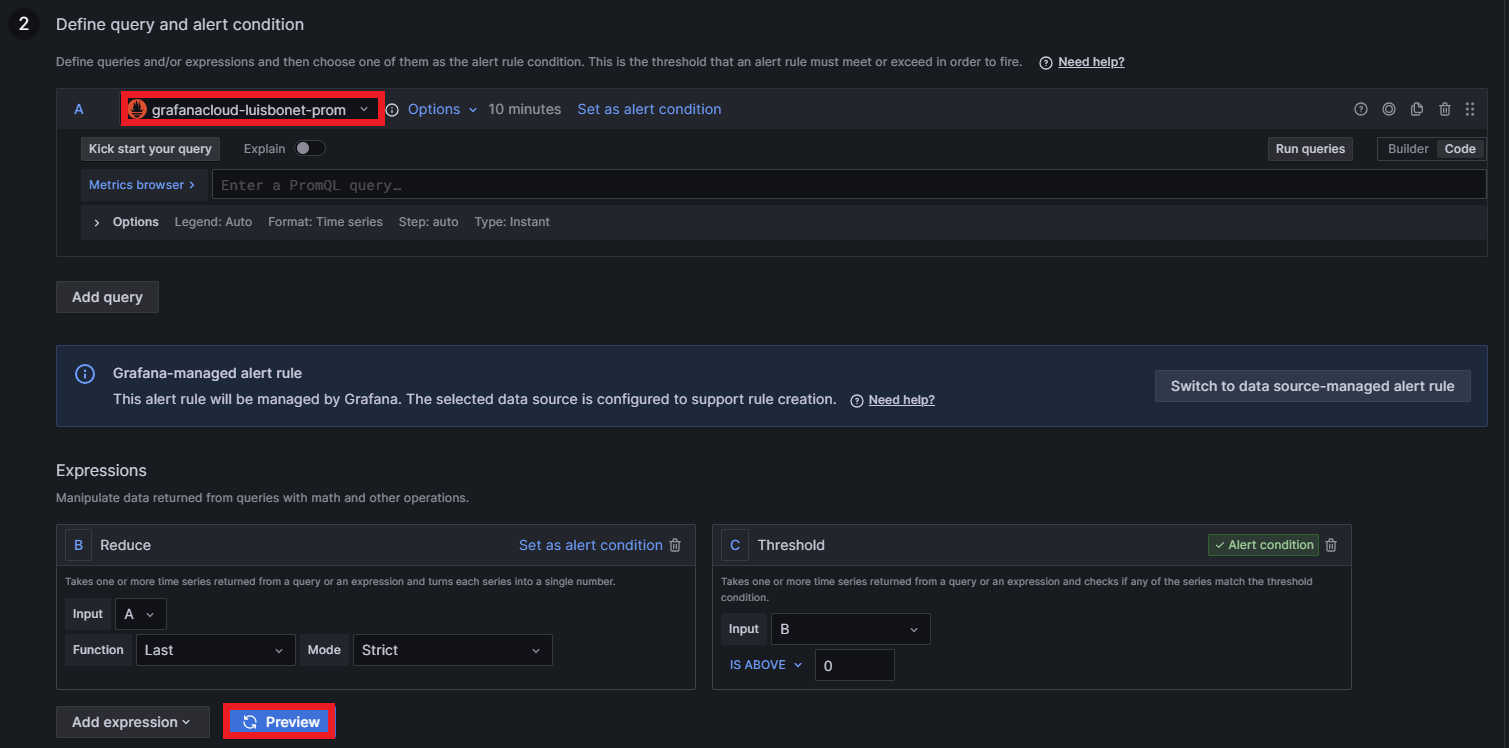
Step two defines the query. Any data source can be selected: Prometheus, Loki, Tempo, etc. It is also possible to add expressions that manipulate data returned from queries with math or other operations. Grafana offers a preview of the alert by clicking on Preview:
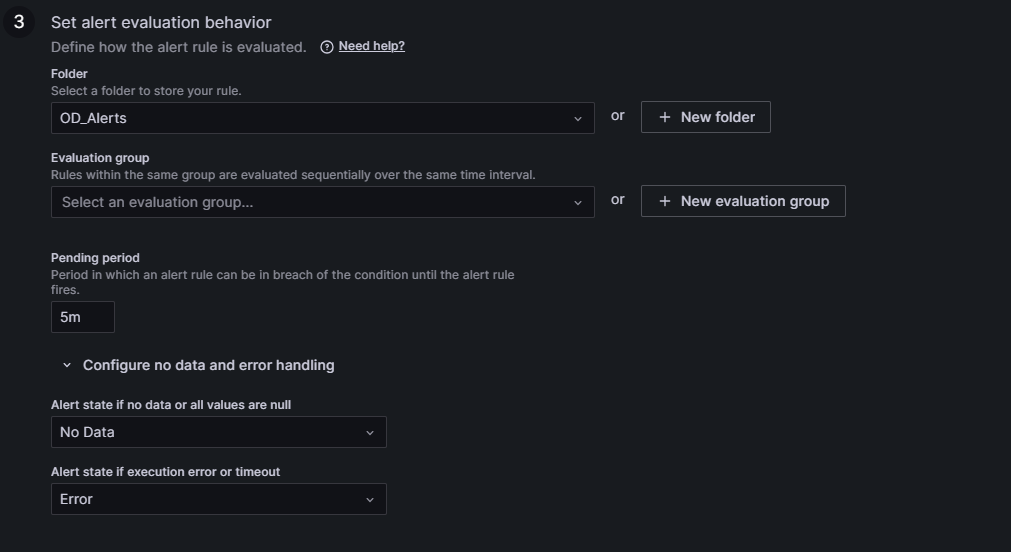
In step three, the alert evaluation behaviour is set: the folder to store the rule and an evaluation group (like a subsection inside the folder) must be selected. Then choose a pending period (the time during which an alert rule can be in breach of the condition until it is triggered). Finally, configure the alert state for scenarios involving no data or error handling:
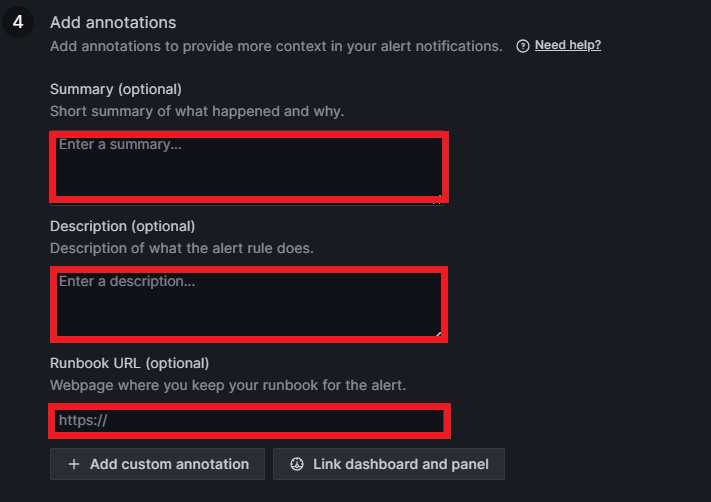
In step four, you can add annotations which will be visible where the alert rules are displayed. An annotation can be a summary, a description, or a runbook. A runbook is a guide that includes a list of all alerts with definitions. You can also link the alert rule to a concrete dashboard and panel by clicking on Link dashboard and panel:
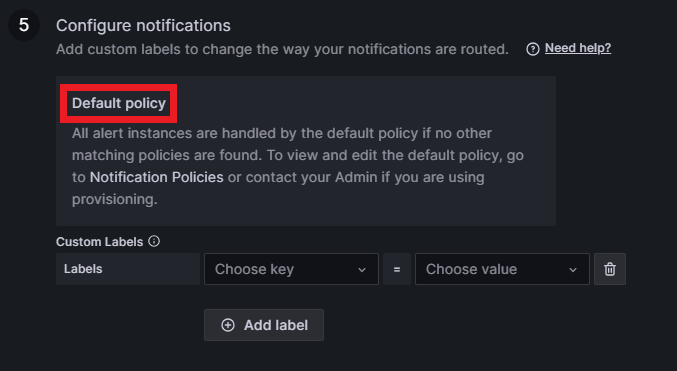
In the last step we configure the notifications. Grafana sets a default policy for notifications that can be updated with a personal contact point; we’ll go into that later. Finally, select a custom label to set the alert as severity = warning:
Now your new alert rule will be created!
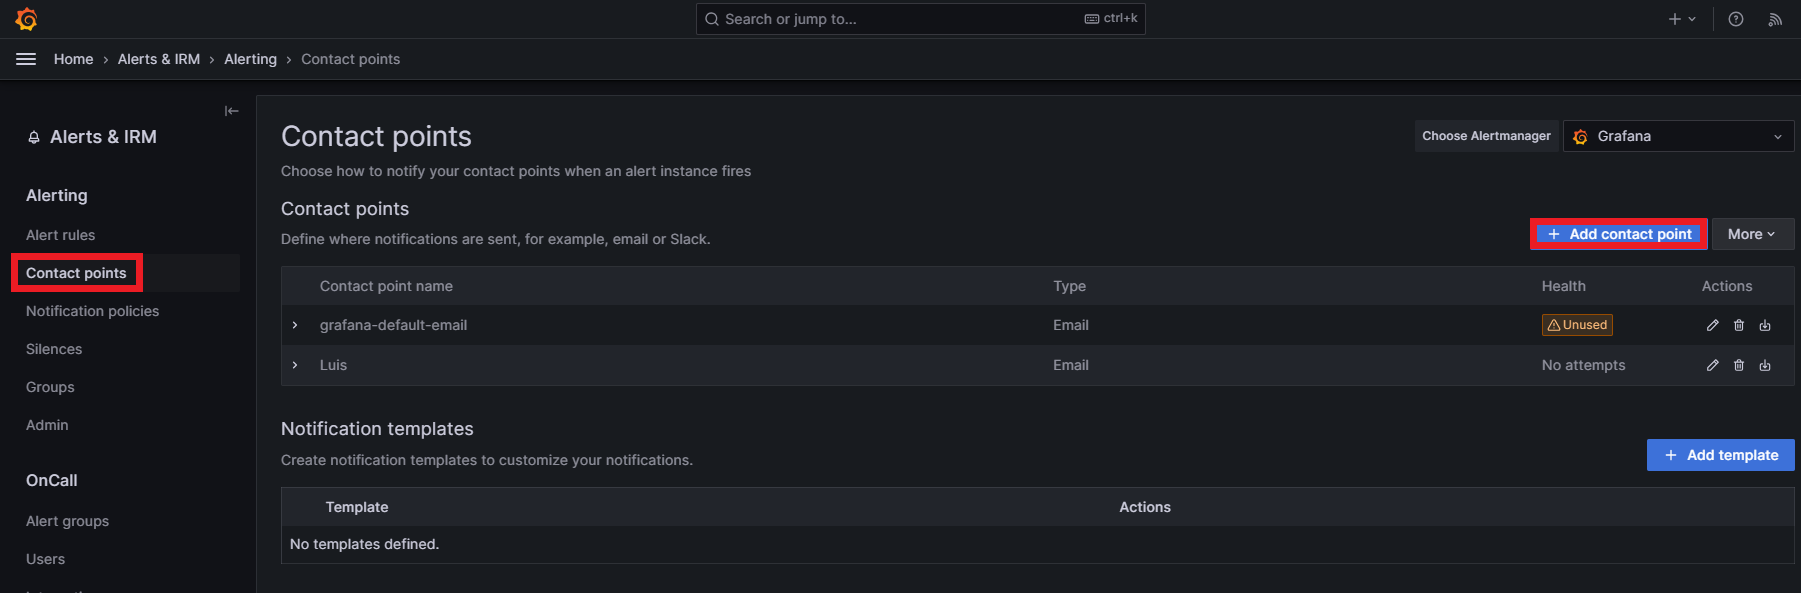
Remember that it’s also important to configure the contact points and notification policies. Grafana sets a contact point called “grafana-default-email” with the email you used to create the account by default. To add a new contact point, just go to the Contact points section and click on +Add contact point:
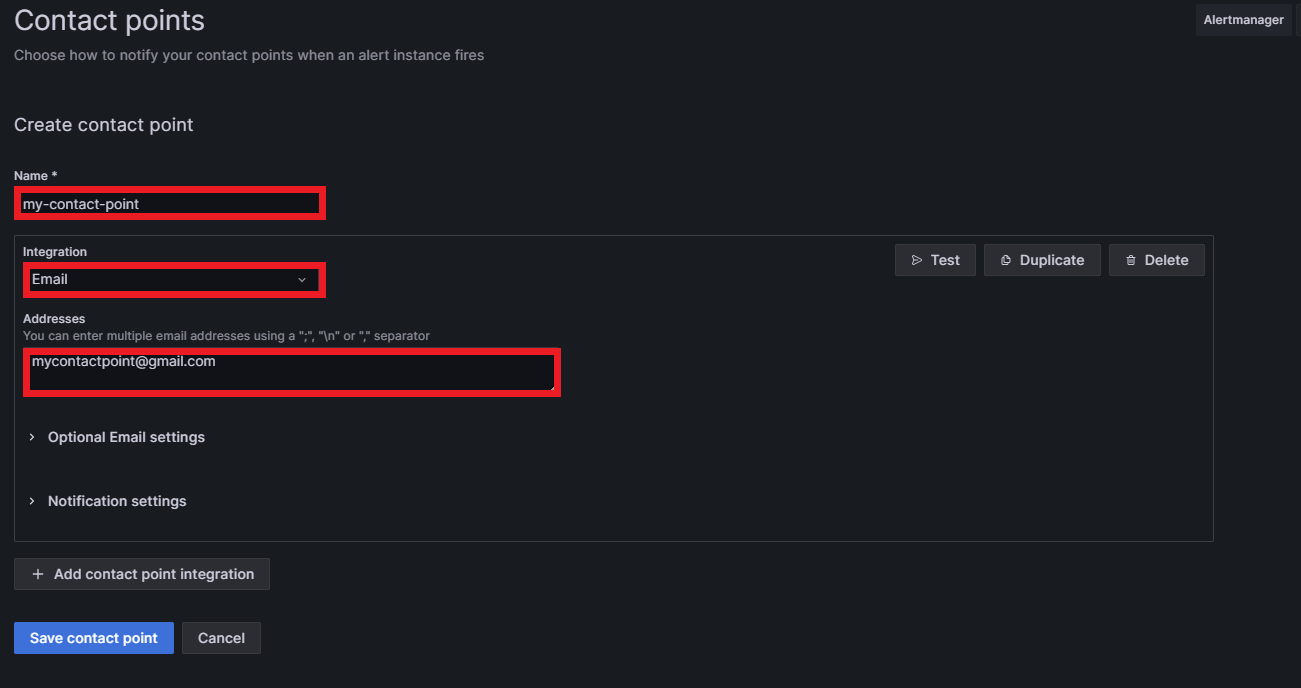
Then, by setting a name for the contact point and selecting the integration type, the contact point will be created. Grafana offers many different integrations, like Discord, Slack, Google Meet, Microsoft Teams, email, Telegram, etc. In our case, we used an email. Write an email inside “Addresses” (you can put more than one address) and the contact point will be completed:
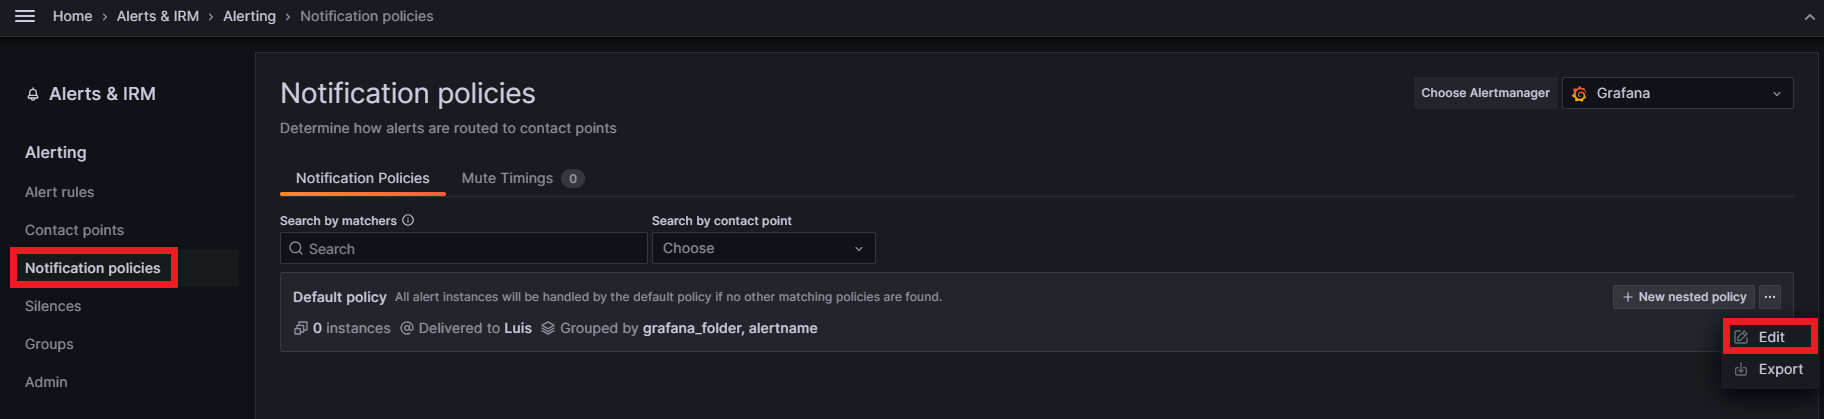
The last thing to do is to set this new contact point as the default notification policy. Go to the Notification policies section and click on Edit inside the default notification policy:
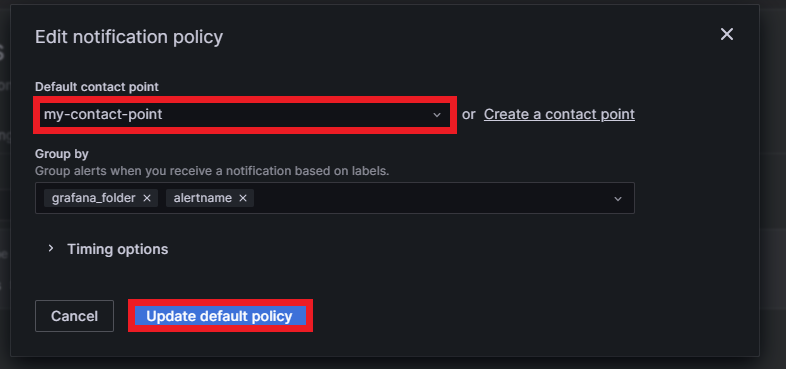
Then select the desired default contact point, group it by labels if needed, and click on Update default policy:
Now our alerting system is fully set up and ready to advise us whenever something unexpected happens to our system.
Some monitoring systems might send a lot of alerts notifying you about an issue, and if these notifications are not consolidated they might flood your inbox, making the detection of the root cause more difficult. Grafana allows you to group alert instances by labels to avoid receiving too many notifications: you will only receive one email, grouping all the triggered alerts rather than one email per alert. What’s more, if for some reason the problems causing the alerts are automatically solved, you will also be notified about that in another consolidated email.
Conclusion
Observability is a core element when talking about Kubernetes (and every IT system). Grafana Cloud provides many features such as real-time monitoring, capturing logs generated by applications, setting alerts and notifications, troubleshooting and debugging, identifying inefficiencies and wastage in resource consumption, and anomalous behaviour. It also promotes a culture of continuous improvement by providing data-driven insights into the effectiveness of code changes, infrastructure modifications, and overall system performance.
Today we have seen some of the Grafana Cloud features in action; it offers tools to create handy, practical dashboards for metrics and logs, and to configure an alerting system to react as soon as possible to system failures. Harnessed together, they bring powerful insights into what is happening inside the cluster, and as the observability system is uncoupled from the cluster, it is possible to see its state even if it’s down.
If you are interested in improving observability in your platform, products or services, simply contact us and our team of experts will be happy to help!