
18 Mar 2020 OAX – Oracle Analytics for Applications Hands On
Editor’s Note, October 2020: Oracle Analytics for Applications (OAX) is now called Fusion Analytics Warehouse (FAW). You can read our most recent article on FAW here.
In 2019 Oracle announced Oracle Analytics for Applications, a new solution oriented to Fusion customers to enrich their analytics platform; let’s check out the main characteristics of this tool.
1. What is “Oracle Analytics for Applications”?
Oracle Analytics for Applications (OAX) is a set of packaged analytics for Oracle ERP, HCM, CX, and SCM SaaS applications. It is built on top of Oracle Analytics Cloud (OAC) and powered by Oracle Autonomous Data Warehouse; the ETL process is managed by Oracle Data Integrator Cloud.
On first using the tool, we were amazed at its potential and the possibilities offered to businesses on a daily basis.
2. OAX Data Enrichment Architecture Overview
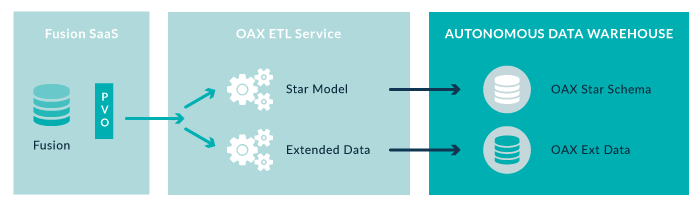
Figure 1: Architecture Overview
OAX will extract information from Fusion PVOs, will process the data through the immutable Oracle-managed ETL Service, and then load the data to ADW. Star Model/schema flow belongs to the out-of-the-box deployment, but you will also be able to enlarge the model to fit your business using the Extended Data. Customization, scalability and flexibility are attractive features of OAX.
3. OAX vs BI Apps
A lot of customers with BI Apps deployments will ask “Does OAX replace BI Apps?” Oracle says ‘No’, and states that OAX is a new product line oriented to Cloud deployments. Current Oracle BI Apps customers are guaranteed support through to at least 2030, according to Oracle.
4. OAX Modules Availability
The first release of OAX includes integration for the Fusion ERP (Finance) module; the other modules will be available in the future.
- Oracle Analytics for Fusion ERP (initial offering)
- Oracle Analytics for Fusion HCM
- Oracle Analytics for Fusion SCM
- Oracle Analytics for Fusion CX
- Oracle Analytics for NetSuite
5. OAX User Experience
OAX is based primarily on 3 notions: Decks, Cards and KPIs. Decks are like dashboards pages from OBIEE classic, where we can group Cards, and Cards work like reports where we can analyse KPIs.
Let’s review Decks:
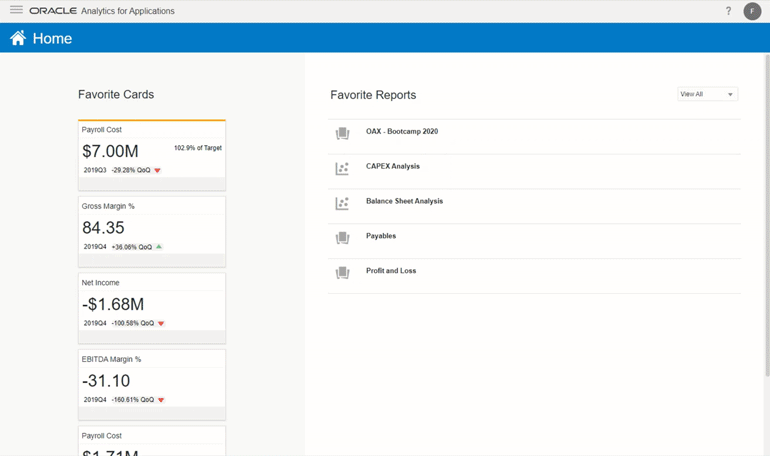
Figure 2: OAX Decks video
Now let’s check out Cards and analyse all the information provided in detail. The component Cards have two views, condensed and expanded.
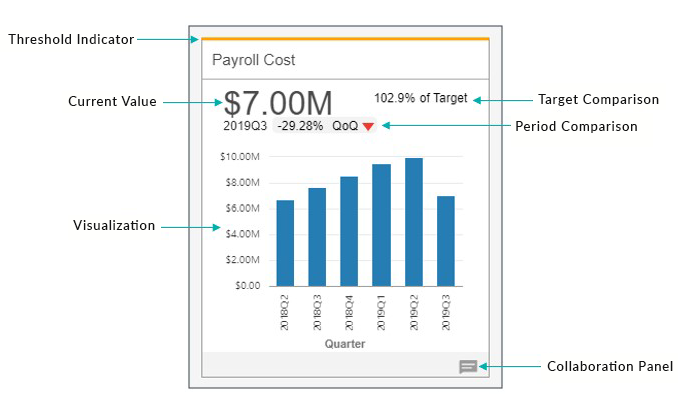
Figure 3: OAX Cards – Condensed view
- Threshold indicator: Semaphore conditions set in KPI definitions.
- Current Value: Shows value according to Time Period selected.
- Visualization: Plenty of options available as in OAC OTB.
- Target Comparison: We can show “Value”, “Variance” or “% Variance”.
- Period Comparison: We can choose QoQ or YoY.
And the expanded view:
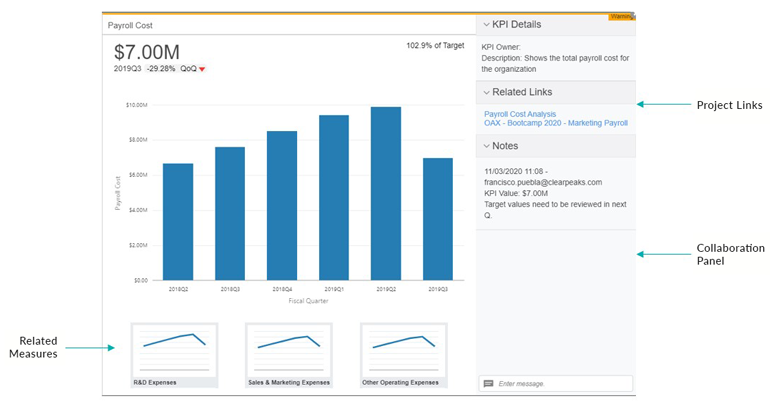
Figure 4: OAX Cards – Expanded view
- Related Measures: In the KPO definition we can include measures to visualize in the card.
- Project Links: Shortcuts to projects related to the card.
- Collaboration panel: Binnacle for team interaction.
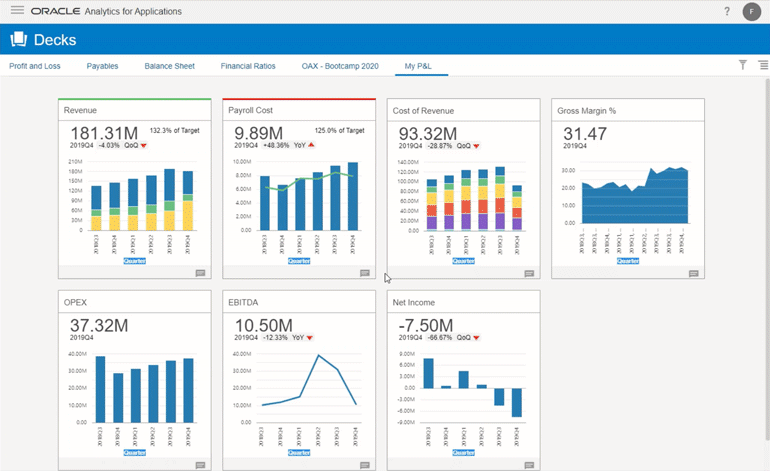
Figure 5: Cards in Action
As you can see in the video, all the OAC native features are inherited by OAX in Cards.
Pre-built KPIs under best-practice development are one the most important components provided by OAX. Using the resulting machine learning-driven insights and self-service analytics, users are enabled to monitor and improve business performance. OAX also includes dashboards and visualizations delivered via OAC, connecting the entire enterprise and unifying KPIs across functions for a holistic view of enterprise performance, as we can see at the end of the previous video.
Now let’s review KPIs, the component where the “magic” happens:
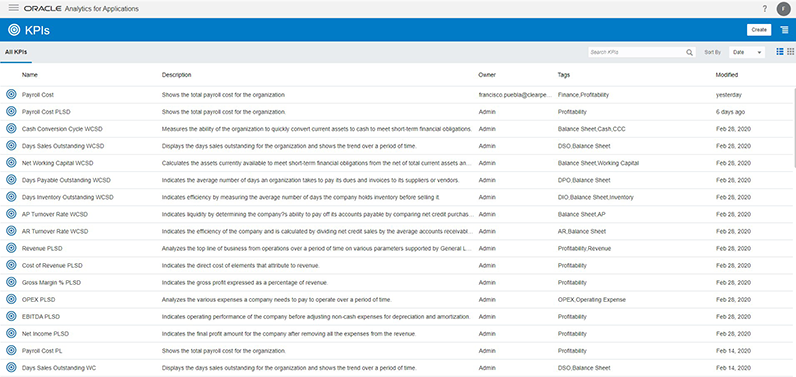
Figure 6: KPIs – Panel List
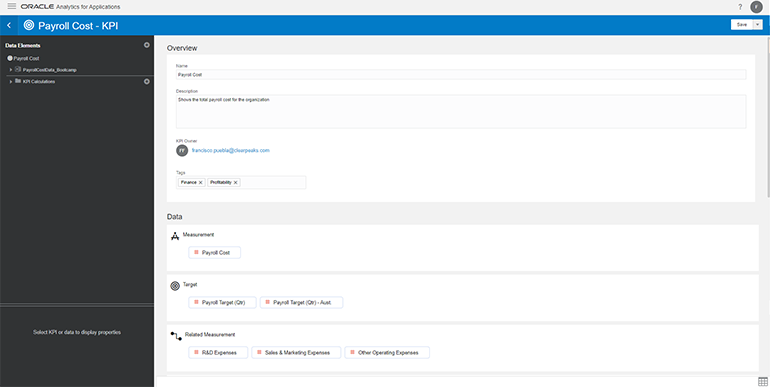
Figure 7: KPIs – Definition I
In this case we used a xls file, but Subject Areas from a pre-built RPD are available to use.
Key fields to populate in the KPI process creation:
- Measurement: We must drag the measures we want to analyse from the data elements panel.
- Target: If we have a target measure to compare we should drag it to this box. We can create derivated measures on top of the original measure.
- Related measures: We can drag accessory measures to visualise in the card.
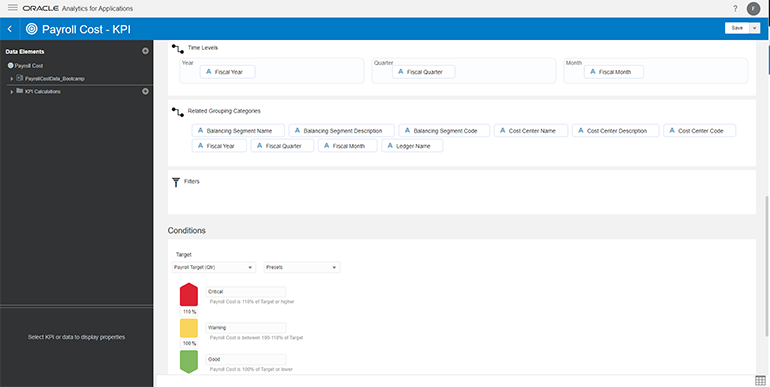
Figure 8: KPIs – Definition II
- Time Level: We must drag the time periods attributes from the data elements panel.
- Related Grouping Categories: We can drag columns from the elements panel to have another point of view of the KPI.
- Filters: Expression filters can be added into this box to filter out data.
- Conditions: Here we define the threshold parameters that will impact on the semaphore.
- Links: We can add links to a Project, Dashboard, or Analyses; we can also include custom URLs.
You can see that the KPI creation process is straightforward and business users with no technical knowledge will be able to set a KPI in a few steps and then start to build their own cards and decks.
Conclusion
Change is on the horizon, and Oracle is positioning itself as a leader in Cloud platforms, providing customers with a broad portfolio of Cloud solutions. We strongly believe OAX will help companies to gain insight from their data, improving the decision-making process, increasing operational efficiency and business productivity with a small implementation effort and low maintenance cost. If you think OAX could meet your business needs, do not hesitate to consult our BI and Cloud experts, who will be happy to help you through the implementation process.
