17 Feb 2022 Operationalising a Fraud Detection Solution Based on Machine Learning
In this article we will go through a fraud detection and prevention solution using Machine Learning (ML) and Tableau dashboards. We will show you some of the deliverables enabled by this technology and look at the advantages of using this solution, rather than the traditional rule-based approach, in terms of productivity, robustness, and overall results.
Introduction
Fraud is rife around the world and on the rise, affecting a wide range of sectors such as banking, insurance, tax, intellectual property, etc.
Fraud can have a series of impacts:
- Financial: Not only the money lost through fraud, but also the associated costs: assessment, detection, investigation, and response.
- Reputation, brand, and employee morale: Fraud always induces a negative corporate image, and can ruin careers by association and deter employees, investors, suppliers, and customers.
- Accounting and capital: Once fraud is detected, there may be programme reviews or audits; attracting funding could also be affected.
- Digital disruption: New systems may need to be put in place, as well as a security overhaul.
In Experian’s 2020 Global Identity and Fraud Report, we can see that around 50% of businesses report the highest fraud losses to be associated with account opening; and even though the majority know that Advanced Analytics must be a part of their strategy, only half think that it is important for identity and authentication.
So, we decided to do some research and come up with an ML solution to improve fraud detection and prevention in those companies experiencing it.
The Problem with Fraud
At ClearPeaks, we are aware of the difficulty of detecting and preventing fraud, as well as the importance of having a set of tools to ease the work of fraud departments and specialists.
Due to legal questions, fraud detection is rarely fully automated, so there is a heavy human workload to check suspicious operations. Instead of automating this work, we decided to reduce the number of cases for analysis and also empower the resources tasked with analysing these cases by offering tools.
Without a model, or using models based on logic rules – which are prone to miss – we are not working with data insights, causing a lot of false positives and creating a lot of profiles for review by workers, with the human error this implies.
Our model approach can understand the connections inside the data and find fraud patterns impossible for a human to spot, able to classify operations clearly as potentially fraudulent or licit. Our solution significantly decreases the number of false positives and gives a precise rating of fraud probability, showing these results in several dashboards for the separate roles in the company fraud department.
Interactive Tool
We believed it was important to offer an interactive dashboard capable of using our ML model to make inferences in real time using parameters set up in it. Sadly, this is still not a standard in dashboard technology.
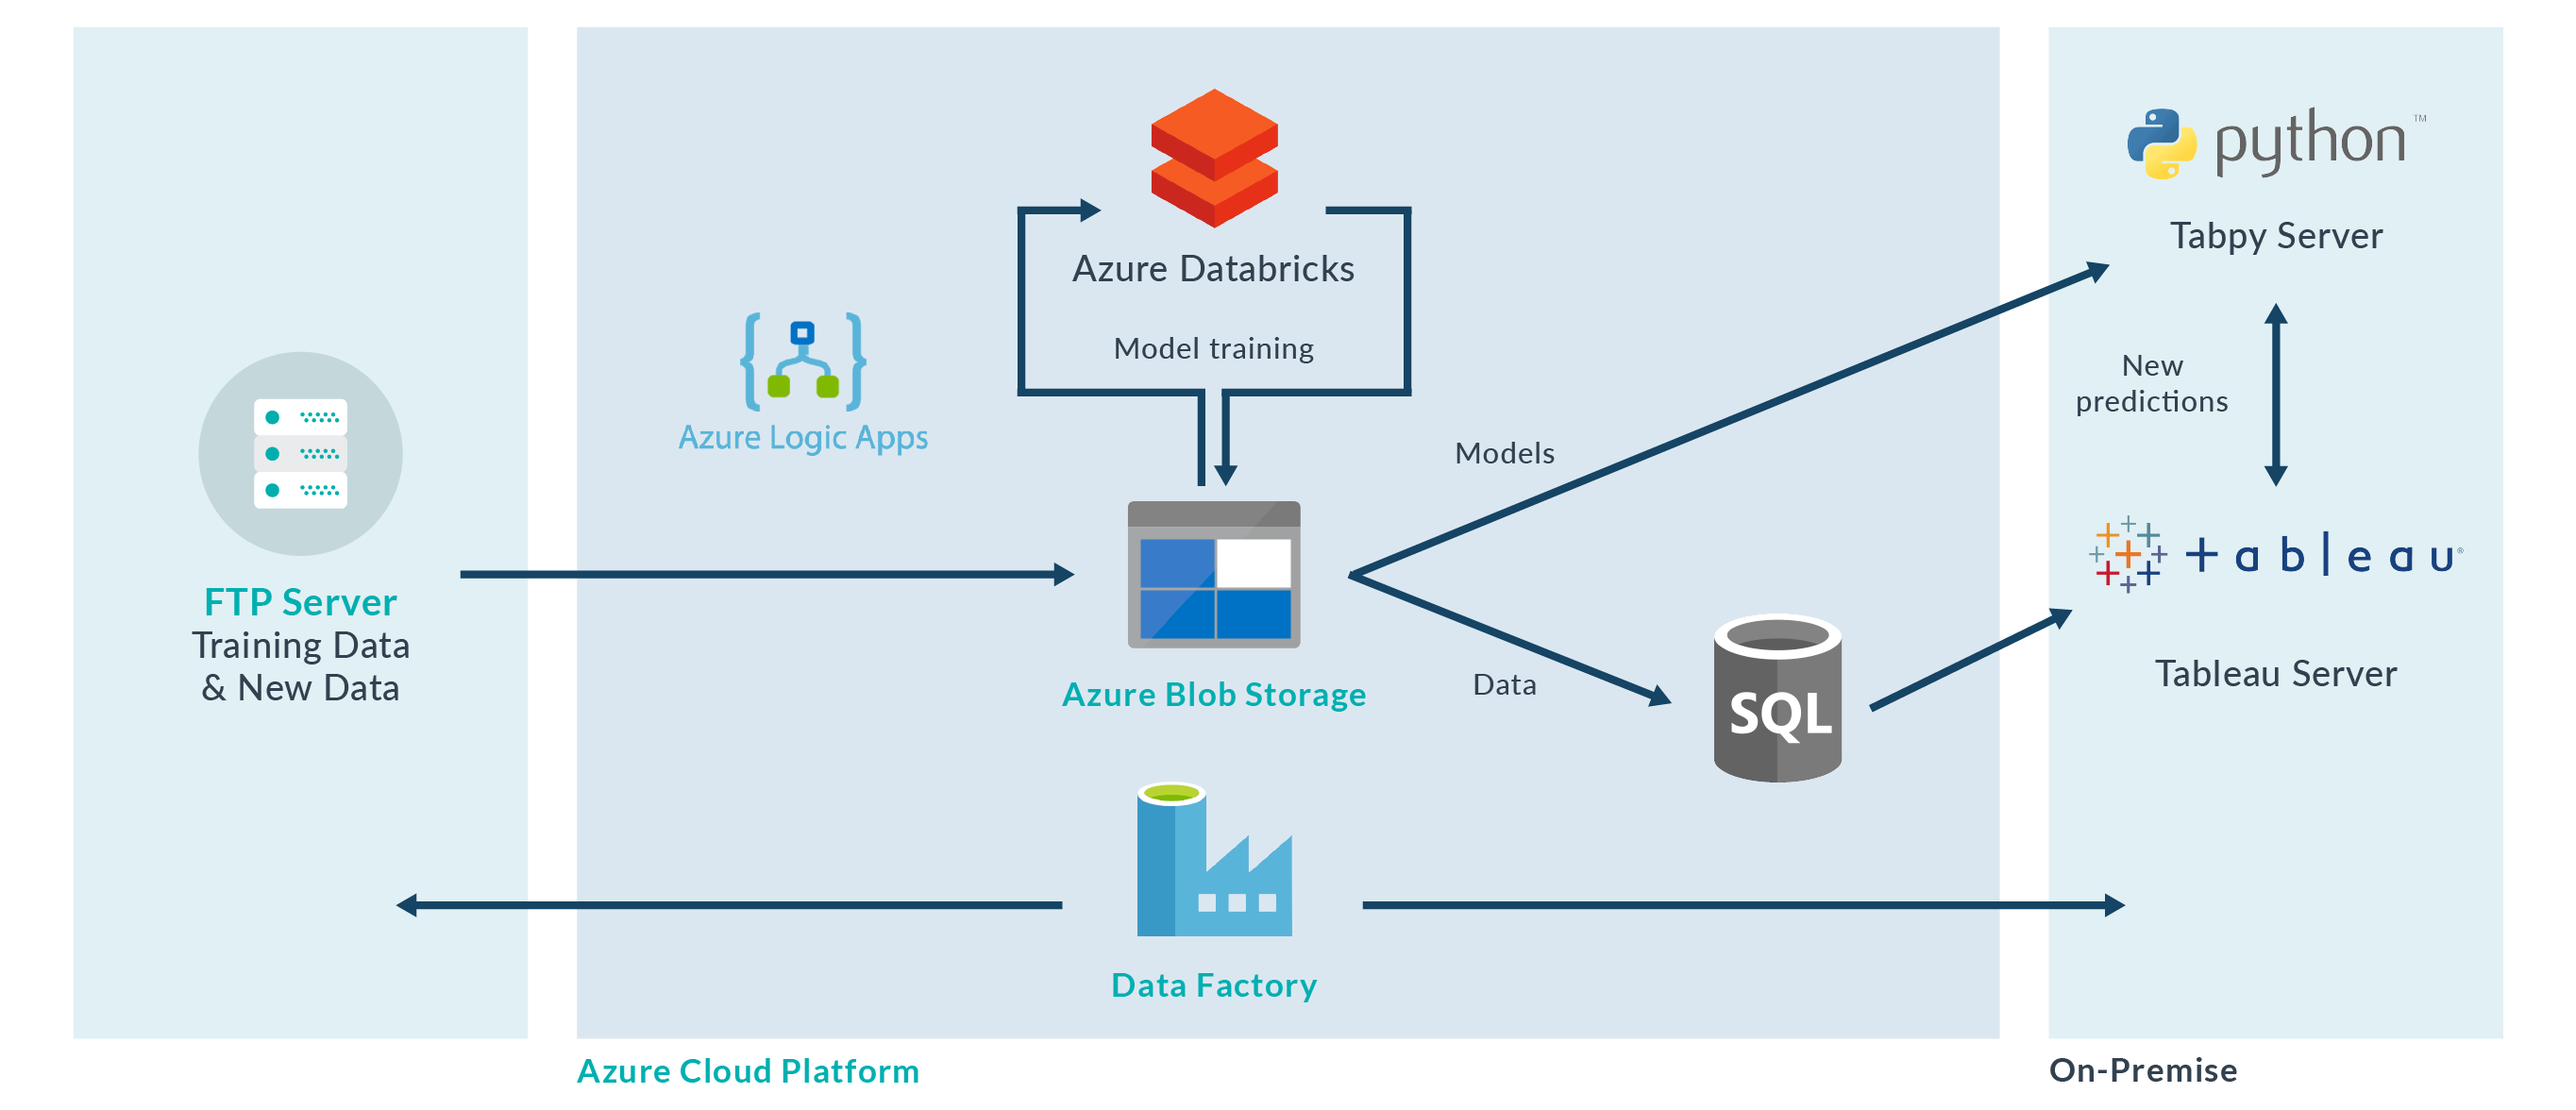
To do so we opted for Tabpy, a tool capable of using Tableau data in Python. Tabpy is officially supported by Tableau, and it allows us to extract the data input in the dashboard to execute the ML model and display its results.
For the other parts of the solution we used a traditional Azure structure, using Data Factory as the orchestrator and adding Databricks to handle all the model-related tasks.
Resulting Dashboards
When designing this tool we had multiple user roles in mind, each with their own user stories. We wanted to provide a minimum number of dashboards to help these particular profiles.
For our specifications we considered the following user roles:
- Fraud Analyst: The key role for this iteration of the solution, the fraud analyst is tasked with checking all the transactions flagged as fraudulent and with carrying out a deep analysis of each, determining which are fraudulent while clearing the legitimate ones.
- Business Analyst: Taking a more BI-based approach, this user is tasked with analysing the state of the business, detecting trends, alerting to possible complications, and coming up with plans to adapt the business to market requirements.
- Data Scientist: This user maintains and improves the fraud detection model: refreshing the model when data drift is detected, and also ensuring that the model is as impactful as possible. To do so, they need detailed information about exactly how the model is working with recent data.
- Finance User: This user is tasked with fraud prevention, using the tool as an assistant and a guideline when deciding whether to approve new credit requests. This user’s analysis is more time-critical than the others, so we want to highlight just one or two points from the full analysis for them.
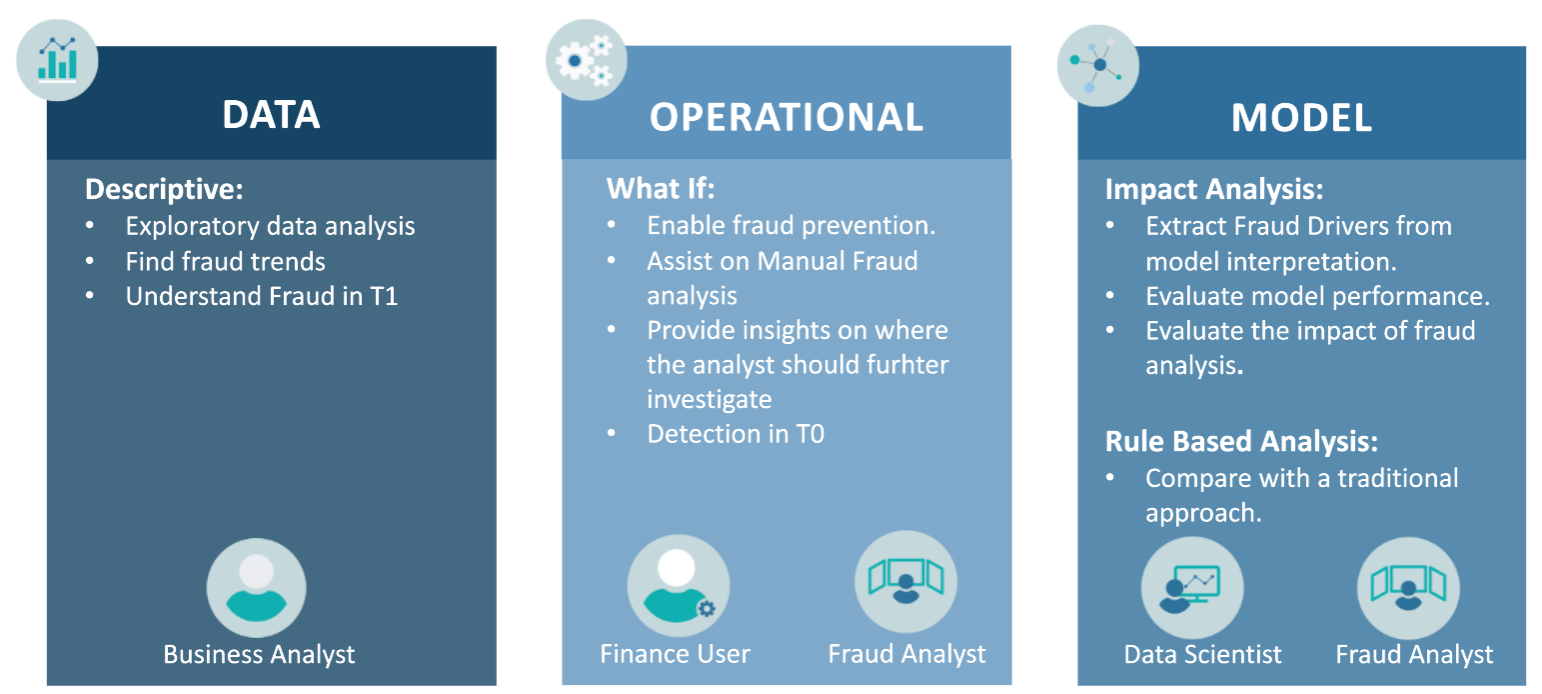
To satisfy the requirements for these users, we decided on 3 different dashboards tackling the different parts of the problem. These can be seen in the figure below, together with the user roles they aim to help:
Now that we have established the user and objectives for each dashboard, we can analyse how well they perform.
Data Dashboard

In this dashboard we aim to offer a quick overview of the business, displaying multiple KPIs indicating how fraud is affecting us and where exactly it is affecting us the most. This dashboard is apt for high-level decision-making, such as deciding what kind of fraud to tackle next.
Operational Dashboard
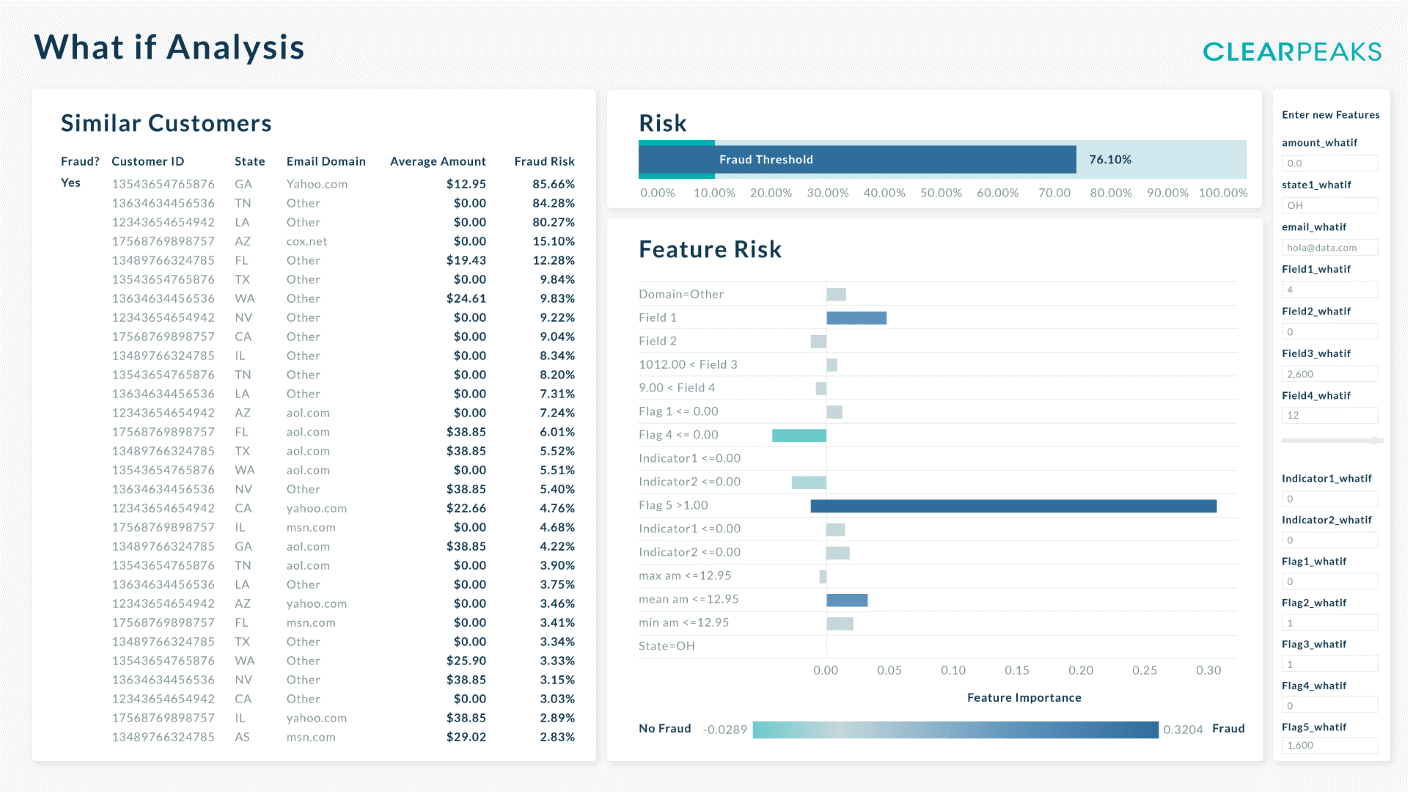
This dashboard provides something more akin to a tool: you can input the data of a new or existing customer and get a real-time prediction of fraud probability, as well as an explanation of the reasons behind this classification. This can highlight the riskier parts of the transaction early in the conversation, or be used by a fraud analyst in order to know what to look out for, allowing the operator to gather more details.
Model Dashboard
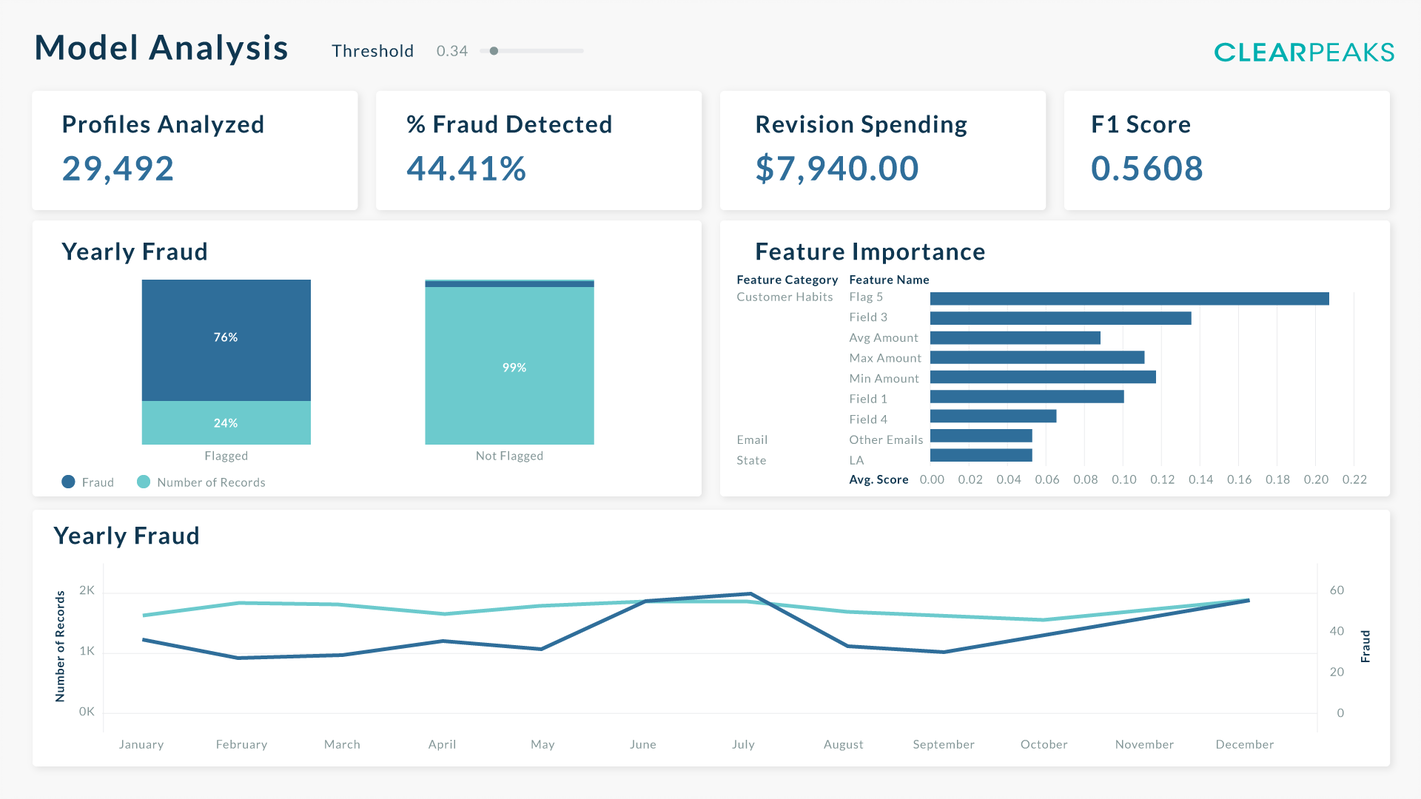
In this dashboard we can take an overall look at the model metrics, making this the dashboard where we can certify that the information given by the model to the other dashboards is reliable. With this objective in mind, we have also included some explainability metrics, exploring the features and the evolution of the model’s accuracy, offering the data scientist some insights into ways to improve the model, and the business user some statistics to support certain business actions.
We also provide the revision spending metric for the business user, indicating the amount saved by using the model in revising cases.
Measuring Cost Benefit
To measure the total cost benefit of this solution, we must split and measure both sources that affect it:
Fraud Revision Reduction:
This is the reduction in cost gained by reviewing less false positives: if we reduce the number of transactions wrongly marked as fraudulent, we can reduce spending. This is the major component in measuring the cost benefit, as the savings here can outgrow the losses due to fraudulent transactions. To calculate this, we can define “Revision Spending” as:

Of course, this just tells us what we are spending on reviewing cases that are not really fraudulent. To see the real benefit of the tool, we must compare it with something, so as a baseline we used a rule-based model – as is suggested by law and commonly used – and we then compared the revision spending of both models, providing us with the exact amount saved in a month by using the tool.
Reducing the cost of reviewed cases not only affects the use of time and resources, but it also impacts analysis quality and the time spent on flagged cases.
Fraud Prevention:
Fraud prevention comes into play before accepting the customer as a client, giving us deep insights into fraudulent customers and allowing us to avoid them, thus reducing the amount of fraud cases and improving the overall quality of the service.
Sadly, this component is hard to quantify, as without an ablation study we cannot clearly understand the tool’s contribution to helping operators prevent fraud. Nevertheless, while we do not know the exact amount of help the tool provides, we believe that it brings a net benefit to the operator’s user experience.
Conclusions
Fraud is a growing crime and it’s a big problem across many businesses and companies, who need to invest heavily to be able to deal with it. At ClearPeaks, we believe that the use of Advanced Analytics offers a major step forward in the fight against fraud, and in this article we have shown how this help may come in the form of fraud revision reduction. Some of the key factors behind its success are the ability of the model to explain the rationale behind its decisions, and the ease of interaction with the model to explore its learned knowledge.
For more details and interesting cases like this, please do not hesitate to contact us at info@clearpeaks.com and we will get back to you as soon we can. If you have enjoyed what you have read here, please follow the ClearPeaks blog as well as our YouTube channel for more interesting articles and topics.