07 Dec 2022 Oracle Analytics Cloud – Highlights from the November 2022 Update
Today we’re continuing with our coverage of Oracle Cloud releases, looking at the last update of the year, November 2022. Just like before, we have tried and assessed some of the new features from this release, and here is an overview of those that we found the most interesting.
1. Slider Filters and Auto-Play
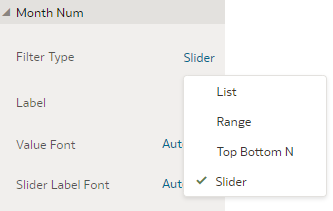
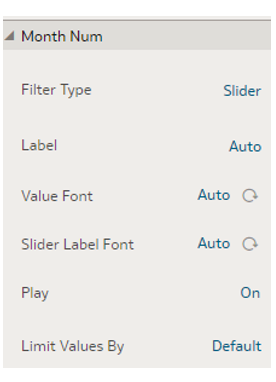
This new feature enables users to animate visualisations and dynamically show how the data is changing. When a user adds the dashboard filter to an analysis, they can change the Filter Type to Slider in the filter controls panel, as shown below:
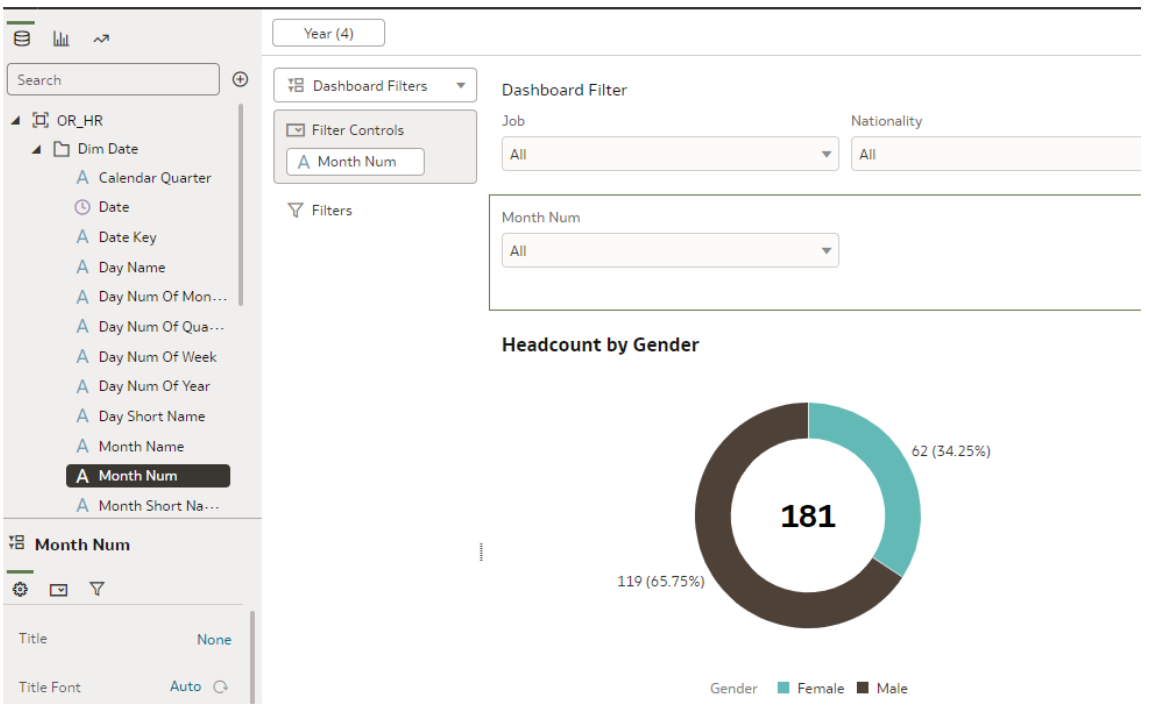
Let’s run through a brief example of how it works: we will add a simple slider filter to an already existing analysis. First, from the panel on the left, we select Dashboard Filters in Dashboard Controls and drag them onto the canvas. Then we select the column we want to use for the filter (in this case Month Num) and drag it over to the Dashboard Filter we have just added:
The default filter type is List, so we need to change it to Slider as shown at the beginning of this part. When the filter changes, the user can drag the slider and change the months, subsequently changing the data in the report:
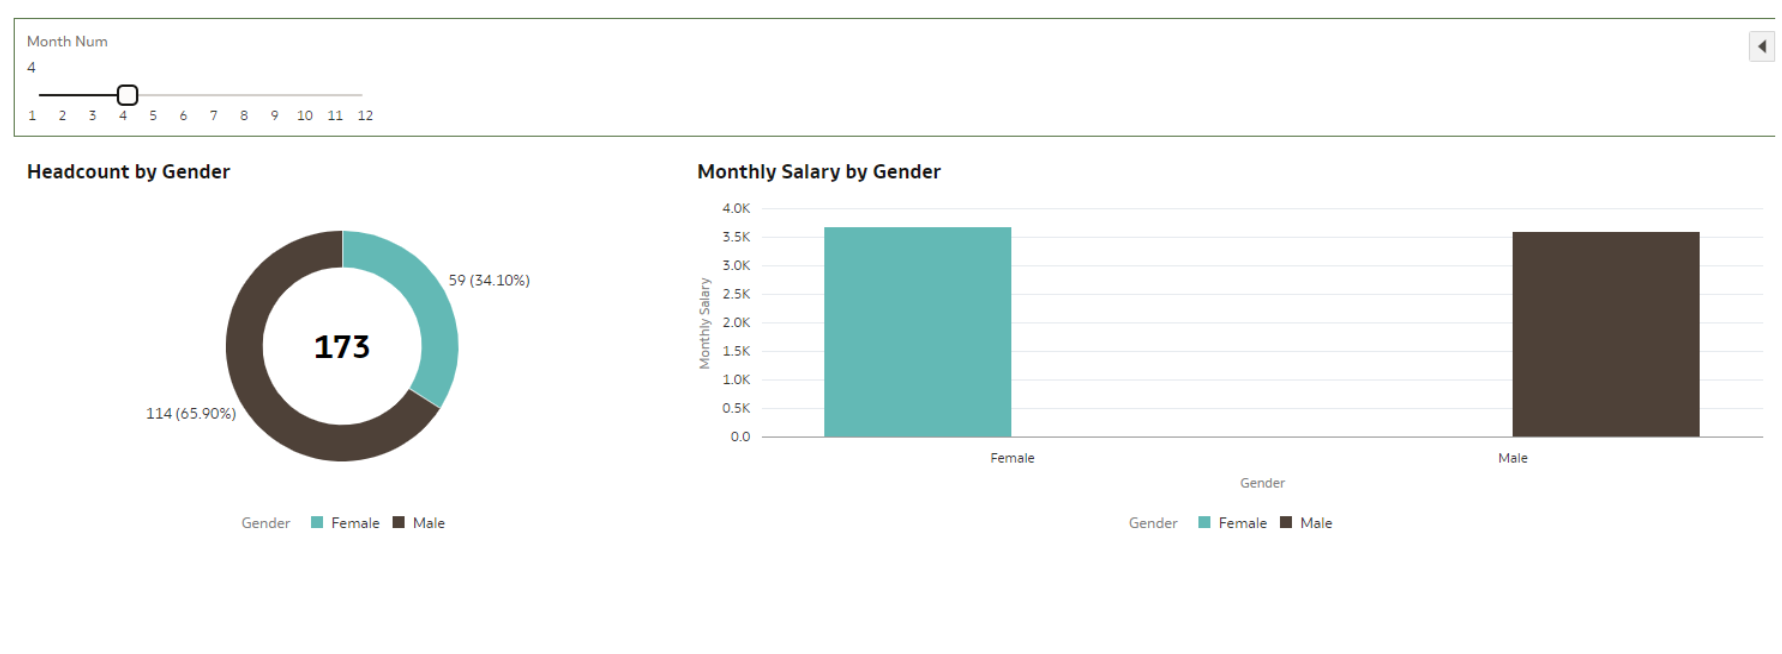
This feature also offers an Auto-Play function which can start and stop the animation of the slider. In the Filter Controls we need to enable the Play button by setting the Play option to On:
The play button appears next to the slider filter; there are Speed and Repeat options for playback control:
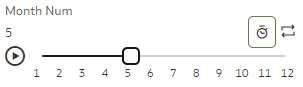
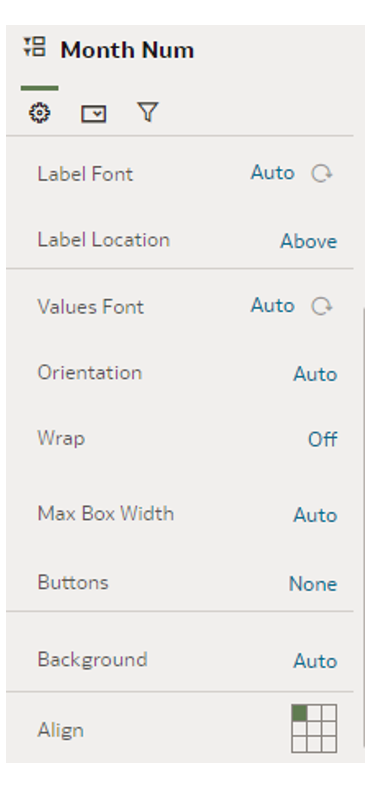
If we hit the play button, we can see the data change for each month; and just like with other filters, we can change the titles, fonts, labels, etc., in the General tab panel on the left. This feature can be especially useful when presenting, as the dashboard will change automatically as the presenter speaks.
2. Converting Text Columns to Date Using Oracle Analytics Recommendations
Date manipulation in reports has always been a bit challenging for users, especially when you have date columns in formats and data types that are out of the ordinary. As the example below shows, we have several columns with different date formats that are also text data type. The semantic profiler automatically detects the date columns and in the panel on the right provides transformative enrichment recommendations that can be accepted with a single click.
We’re going to evaluate this feature by uploading a Sample Order Lines CSV document provided by Oracle. First, we click on Create Dataset and select the option to upload it from our computer. We can see the uploaded csv file in the image below:
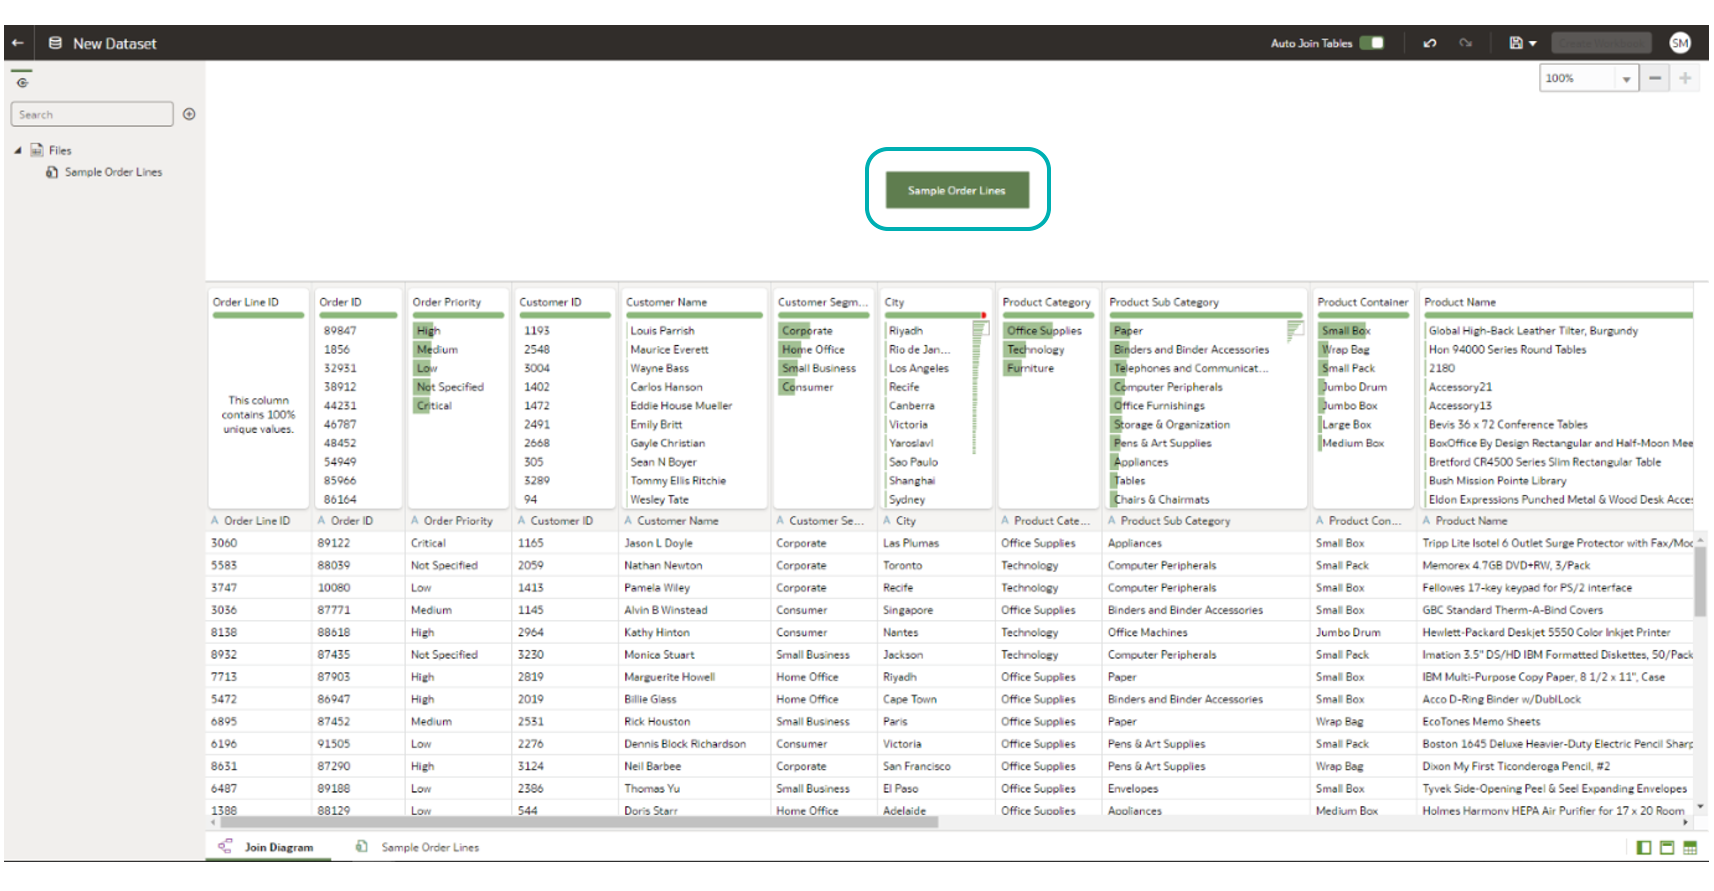
We then double-click on the green box displaying the name of the CSV file in order to enter Preparation Script mode, where we can see the Recommendations panel on the right where the profiler automatically detects the column data types and adds best practice recommendations. In this example we will concentrate exclusively on the Date recommendations:
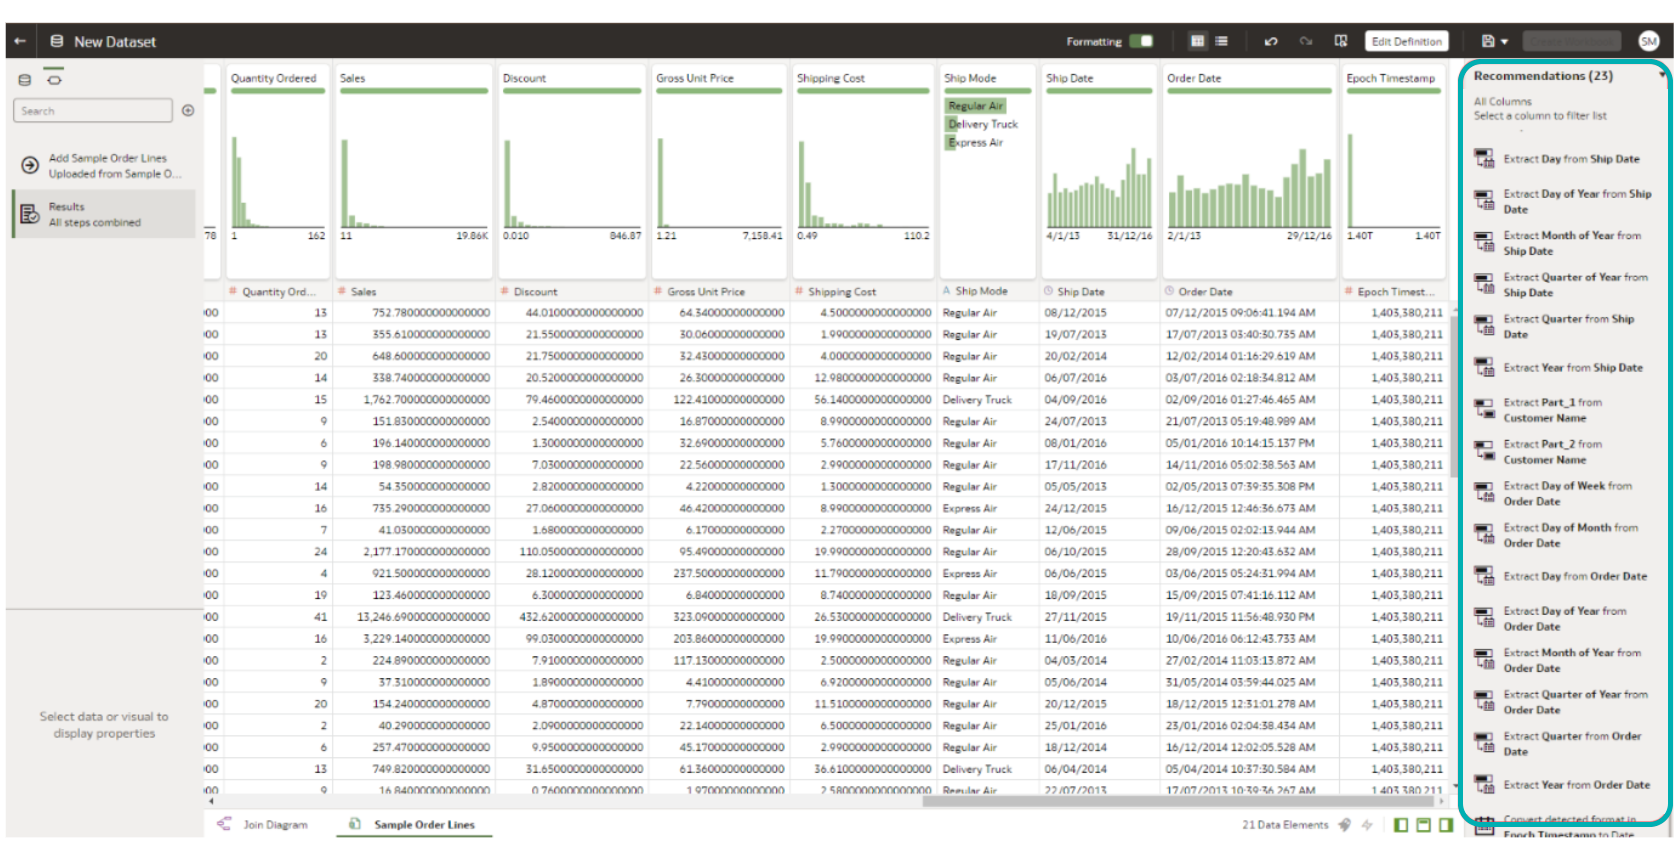
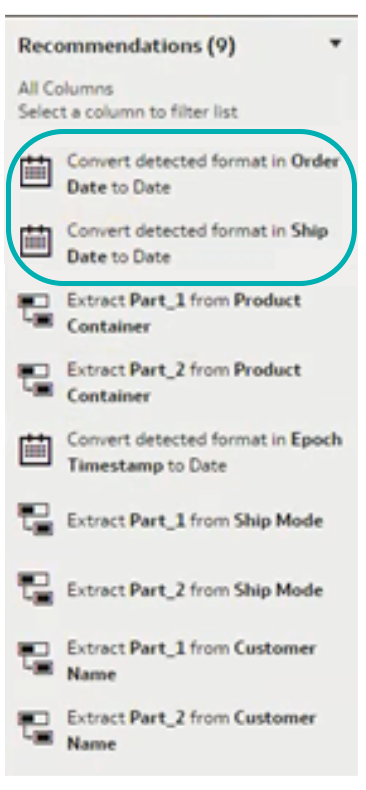
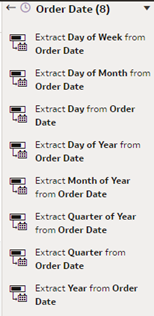
The document in question had Order Date and Ship Date columns in text format, but the profiler detected those were date columns and recommended they be converted into date format. As well as the conversion of the data type to date, the profiler also makes additional suggestions, as we can see in the image below for the Order Date column:
Note that the profiler can also recognise many different date forms, such as epoch date columns, common in order and shipment reports. The epoch date is a way of measuring time in programming, and it represents the number of seconds that have elapsed since 00:00:00 UTC on January 1st, 1970. So, with just a single click we can convert this user-unfriendly format into a more familiar one, as shown below:
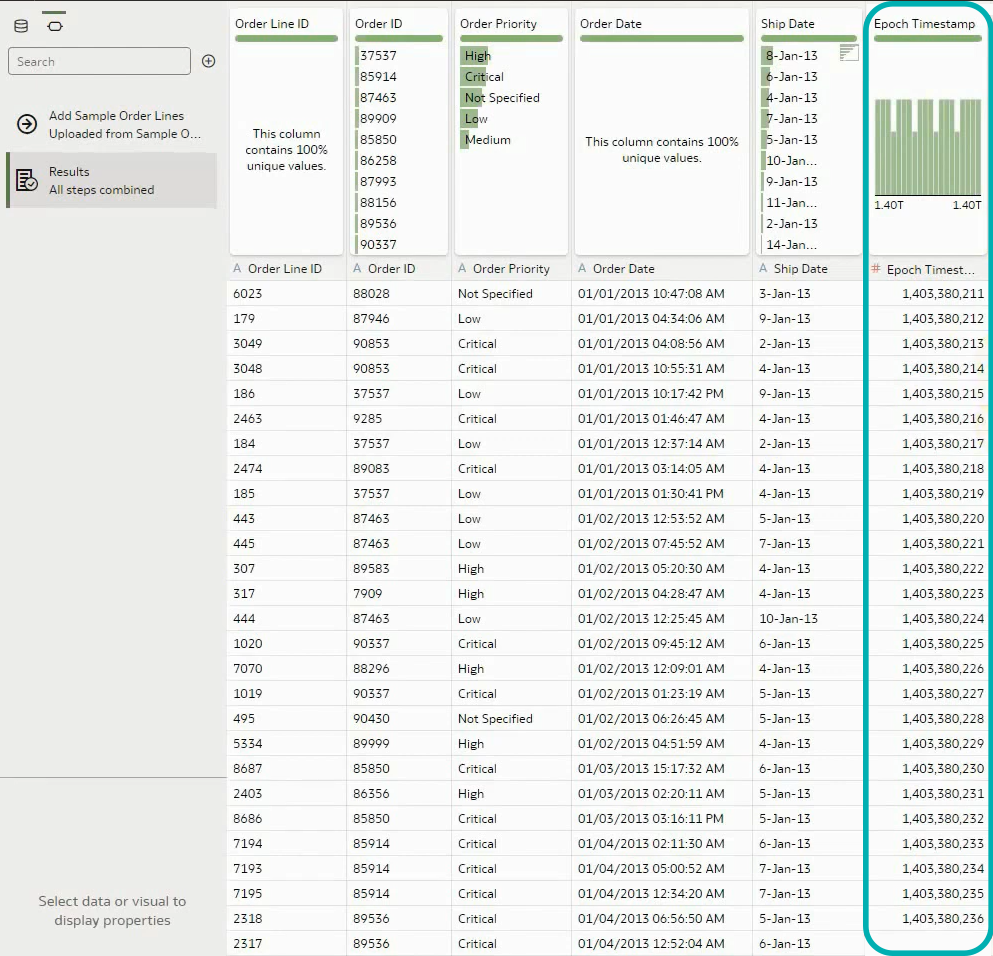
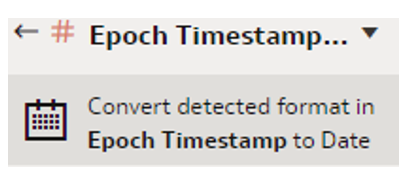
We click on the recommendations on the right for Epoch Timestamp:
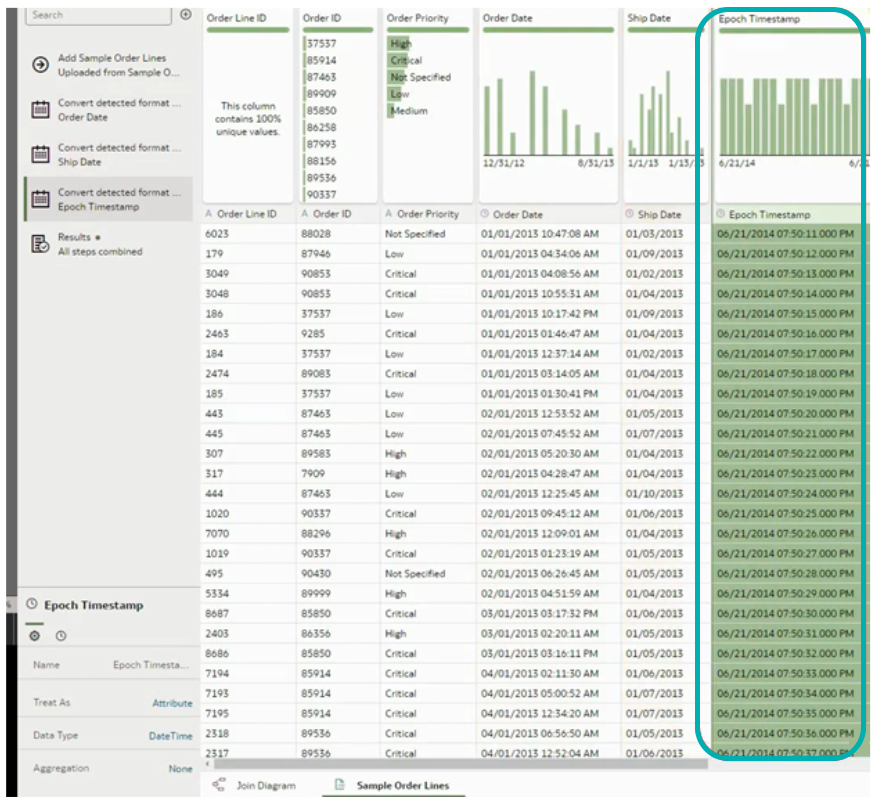
This is the result after converting:
3. Customised Header Bar
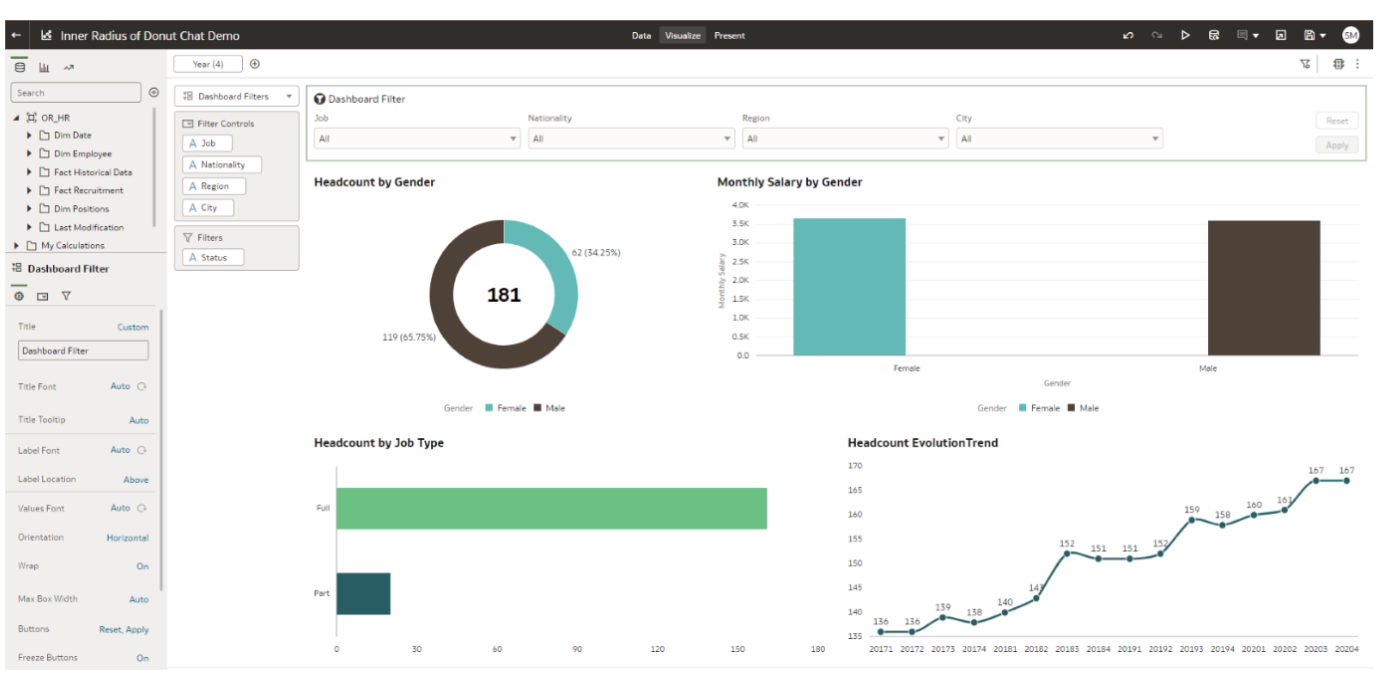
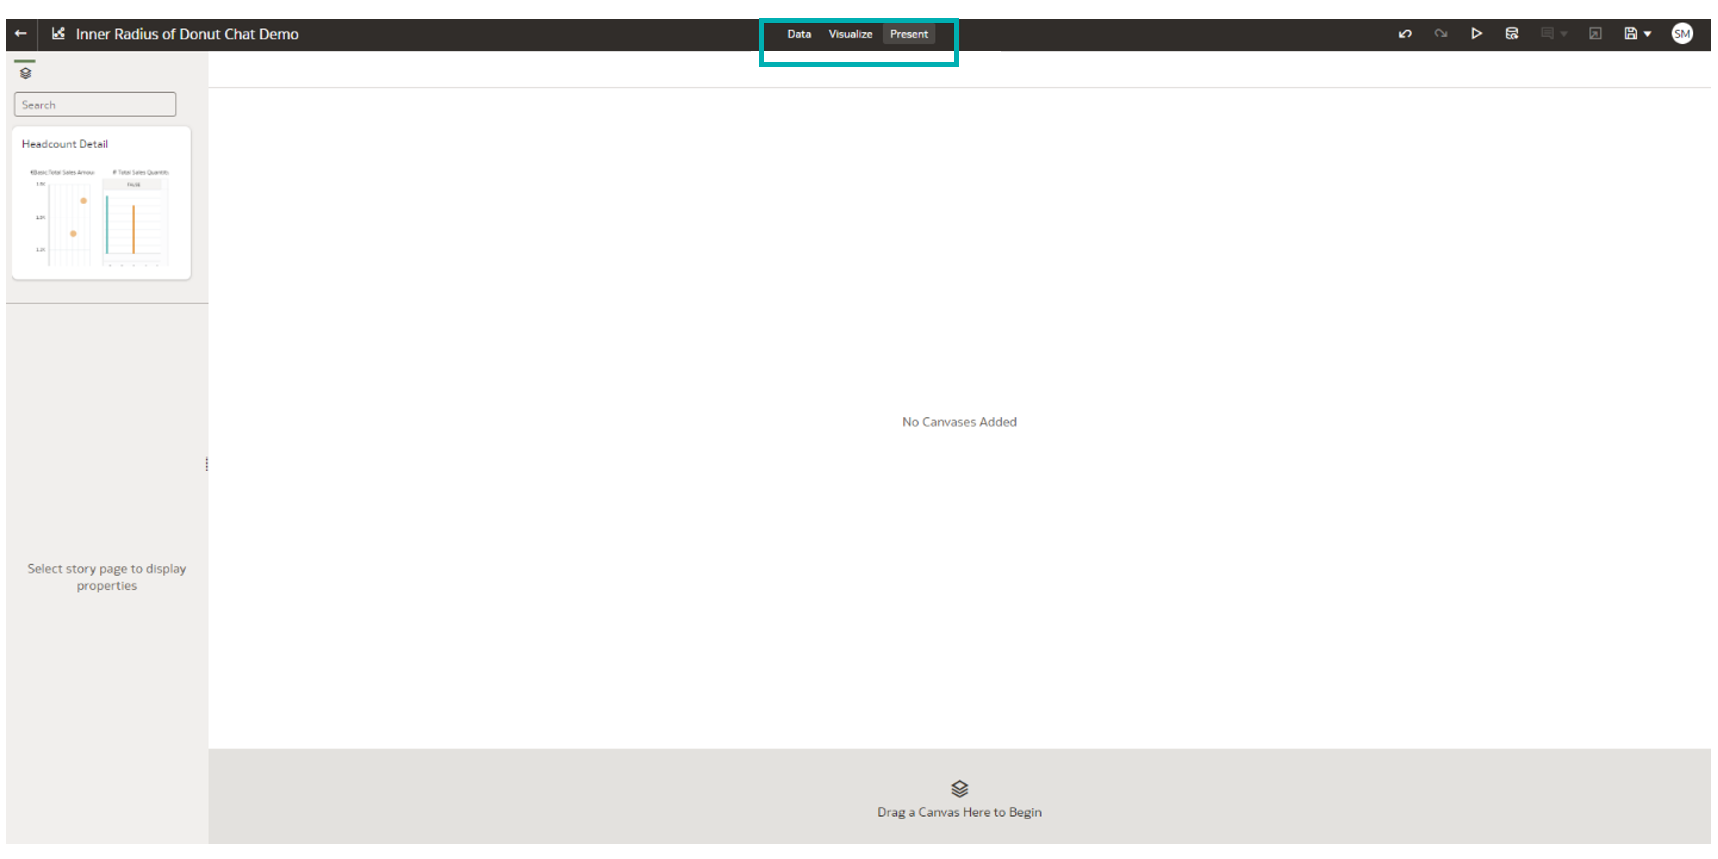
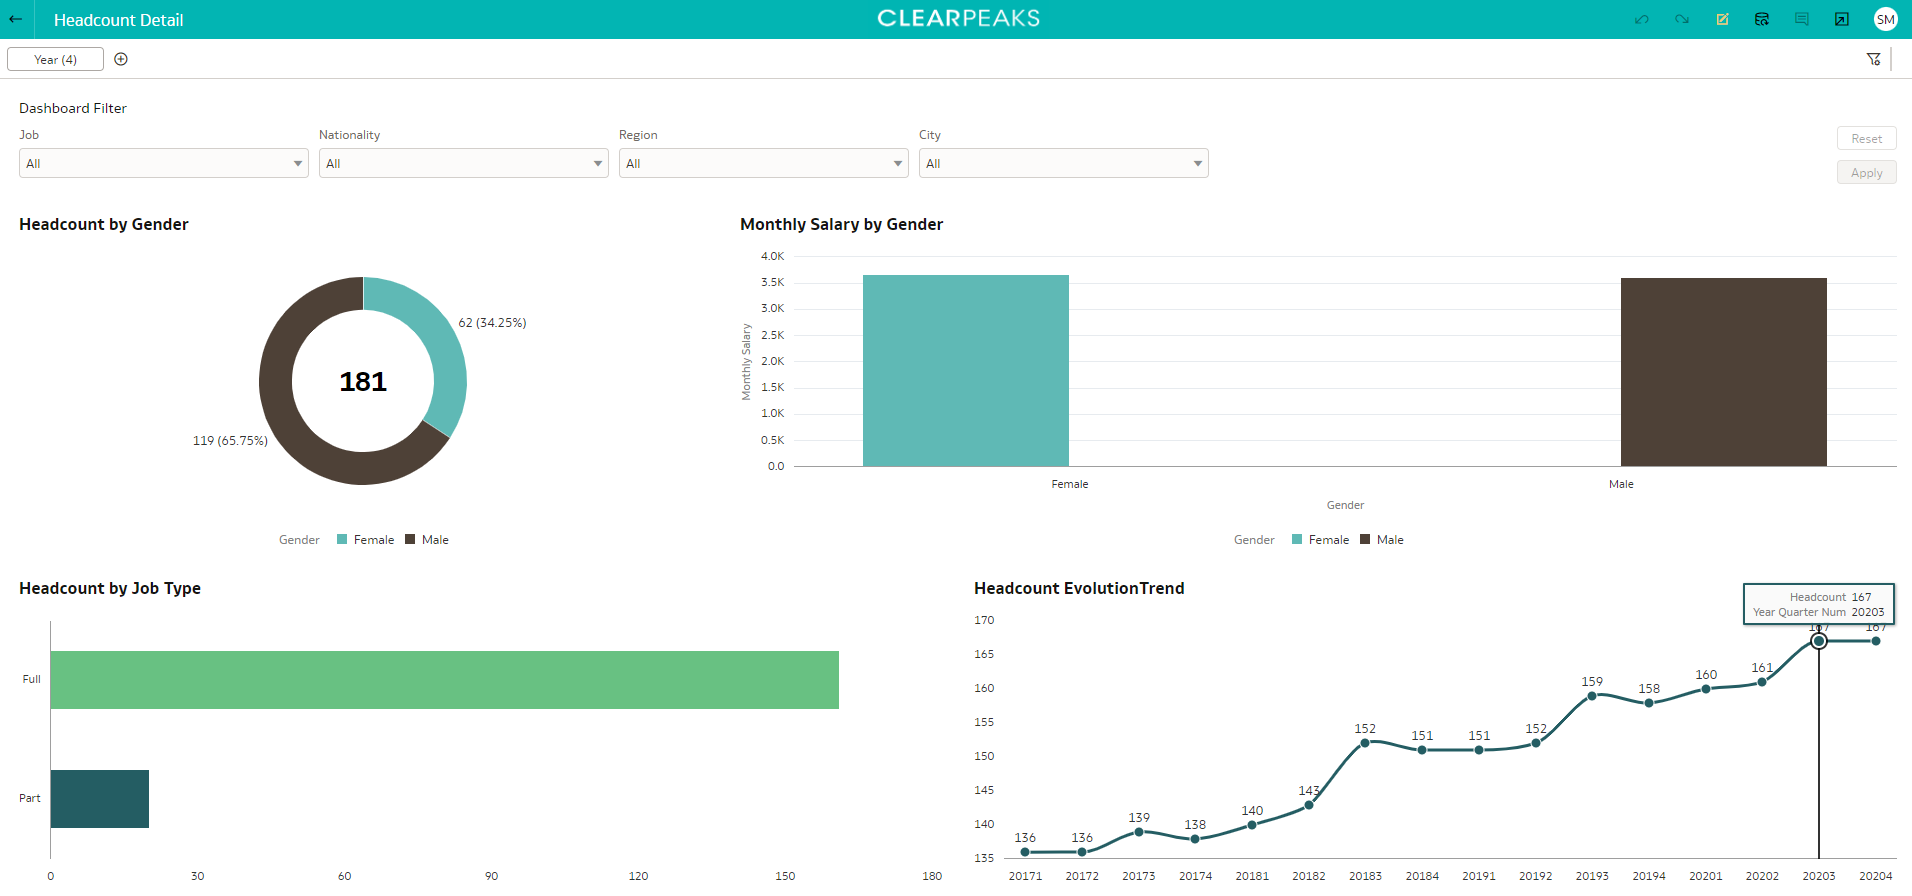
Oracle Analytics has added a new feature where the user can add a custom header bar to the dashboard above the report. This header can contain custom text or even a corporate logo, useful for reports for management or for sales pitch presentations. Let’s see how to add a custom header to the report shown below:
When in Edit mode, we need to switch from the Visualize tab in the report header to the Present:
Note that the canvas we want to edit is in the panel on the left; now we need to drag it to the grey area at the bottom of the page. Once again, we can see the canvas with the report, and we need click on Presentation properties on the left:
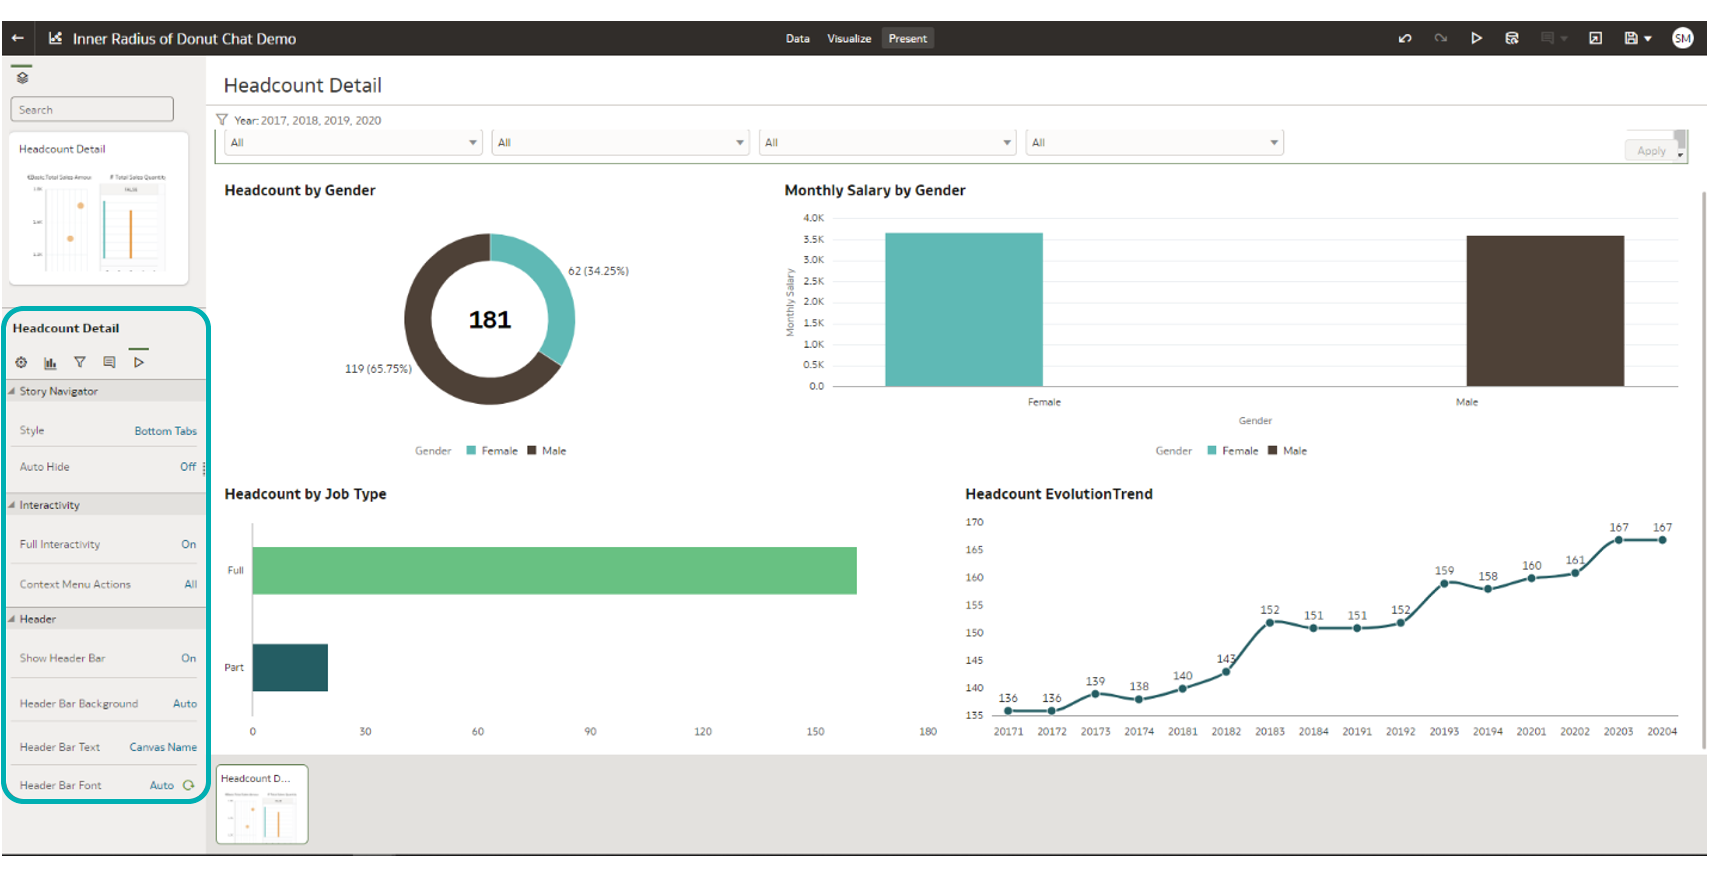
Let’s take a closer look at the options in the Presentation properties tab:
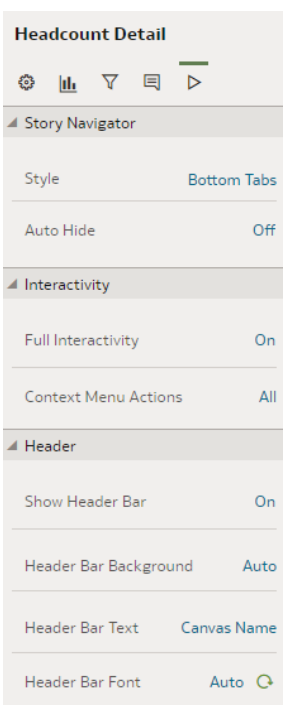
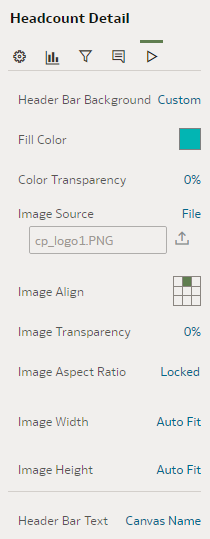
First, we need to make sure that Show Header Bar is set to On. Then we need to switch Header Bar Background from Auto to Custom, and additional options will appear in the Header properties:
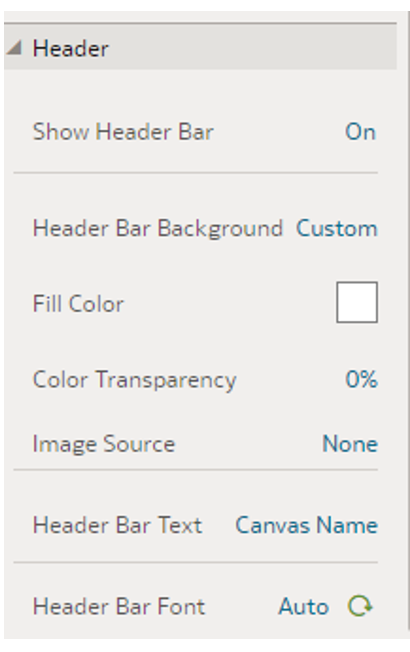
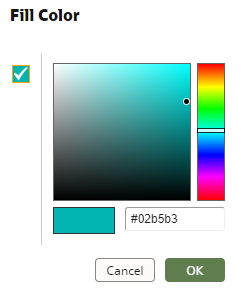
For this example, we’ll select the Fill Color options to add some colouring to our header bar. We’ve chosen a shade of cyan:
We also want to add the ClearPeaks logo to our header for that professional look, so we need to go to Image Source and select File to select a picture from our computer:
There are additional adjustments that we can make, such as Image Align, which we will set to Center. We must make sure that the logo fits in the margins of the header bar, and we can do so by setting Image Width to Auto Fit:
Now that we have finished all the adjustments for our customised header bar, we can click on the preview button in the upper-left corner to see how it looks before saving the changes:
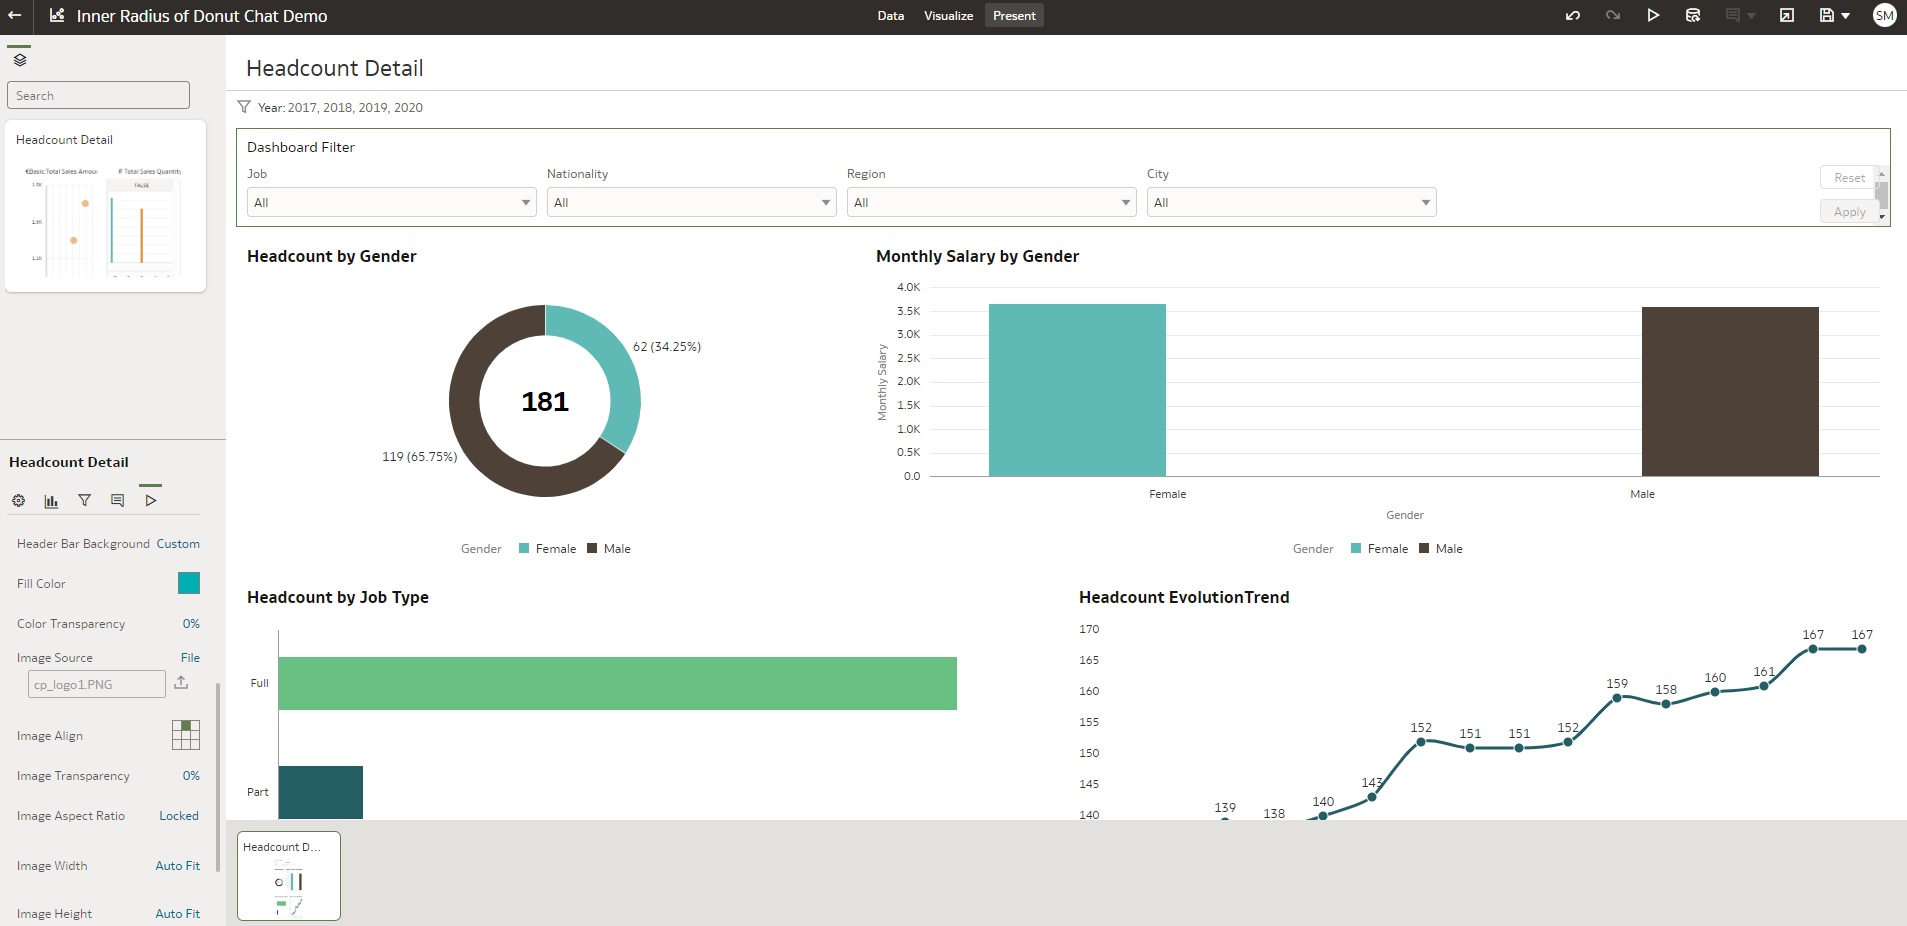
As we can see above, the header bar is now in cyan with the ClearPeaks logo. If we are happy with the changes, we just enter Edit mode once again and save them.
Conclusion
As 2022 is coming to a close, Oracle has issued the last release of the year with several nice additions that improve the customer’s OAC experience. Some of the bugs from previous releases have been fixed, and we can safely say that data visualisation has been improved and is now even more user-friendly.
Analytics and Business Intelligence (ABI) platforms enable less technical users, like business executives, to model, analyse, explore, and manage their data, as well as to collaborate and share findings.
According to Gartner’s market share analysis, revenue in ABI platforms grew by 16% in 2020, compared to 19% in 2019, to reach just over $7 billion. Pricing pressure and fierce competition were mainly responsible for this small deceleration in growth. Even though spending on ABI is growing more slowly than in the 2010s, the number of people using ABI platforms is accelerating massively, reaching into the millions.
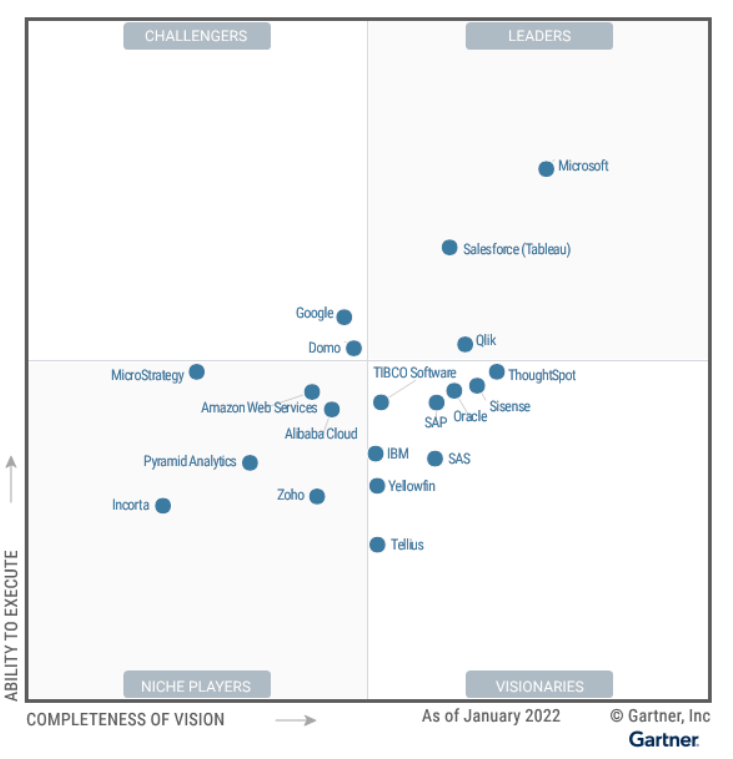
Oracle is keeping up with the competition, carefully listening to its community, keeping its eye on the ball, and applying trends to the platform – so it’s no wonder that Gartner has placed Oracle in Visionaries in their Magic Quadrant annual report for 2022.
ClearPeaks will be following along closely, since the future of Oracle Analytics lies in their new and exciting Semantic Modeller, which will be covered in our blog posts next year.
In the meantime, if you want to see how Oracle can bring even more value to your business, simply get in touch with our certified and experienced consultants here!