
11 May 2016 Oracle Data Visualization Desktop – April 2016 Release
1. Introduction – Oracle Data Visualization Desktop
With the release of Oracle Business Intelligence Enterprise Edition 12c (OBIEE 12c), Oracle announced a new Data Visualization tool, aimed at ad hoc personal data discovery tasks. Oracle is putting a great deal of effort into developing this new tool, that is available as:
* component of Oracle BI Cloud Service (BICS)
* standalone cloud service named Data Visualization Cloud Services (DVCS)
* component of OBIEE 12c on premise
* a standalone desktop tool named Data Visualization Desktop (DVD)
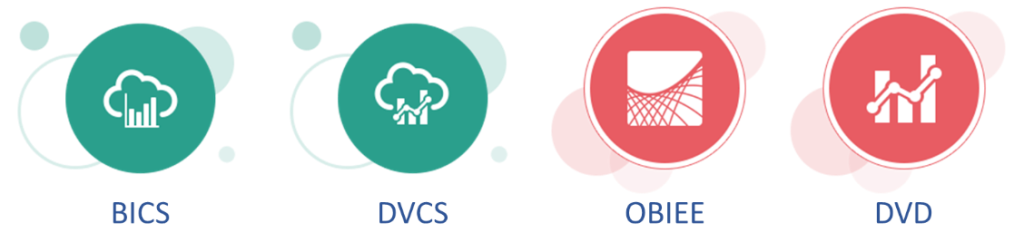
At the end of April 2016 Oracle released the first publicly available version of Oracle Data Visualization Desktop (DVD), under version 12.2.1.0.0 (and timestamp 20160422085526). In this blog post we will present the main characteristics of this tool (DVD); but most aspects are common to the other three above modalities.
2. Data Sources and Data Management
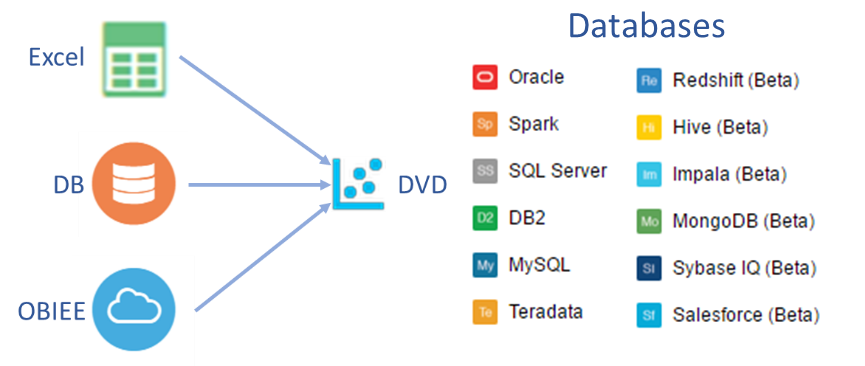
There are 3 types of data sources that can be used in DVD:
- Excel sheets, which allow complete offline analysis
- Databases like Oracle, SQL Server, MySQL, Teradata, Redshift, MongoDB, Spark, etc.
- OBIEE, where the user can connect to an existing Analysis or use a Logical Query

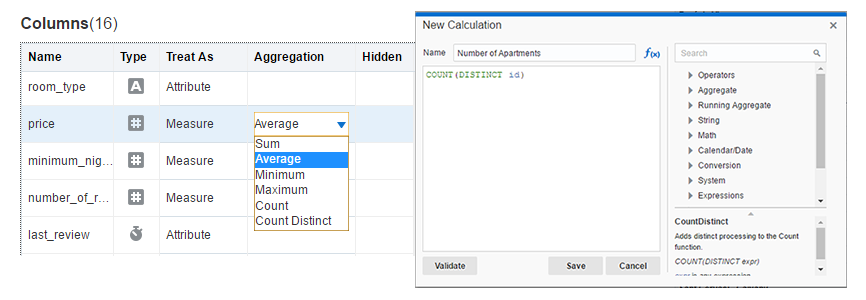
Once a source has been added to a project, DVD offers different options to manage the data:
* Modify data types (string, number, date, etc.)
* Alternate between Attributes and Measures
* Select the Aggregation rule of Measures
* Create Calculations using a wide variety of functions
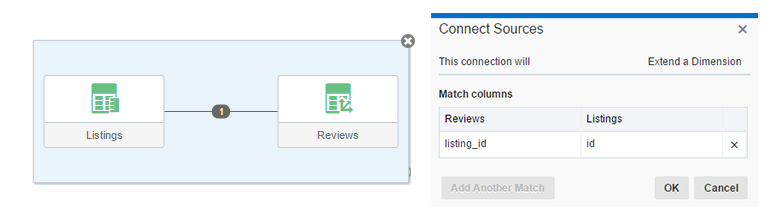
Multiple sources of different types can be added to a DVD project, joined automatically using fields with matching names; the joins can always be edited using the Source Diagram.
3. Visualizations
One of the most important characteristics of DVD is the high number of visualizations available out-of-the-box. There are 22 data visualizations in total, plus the possibility of including Text Boxes and Images. All the available visualizations are shown in the image below:
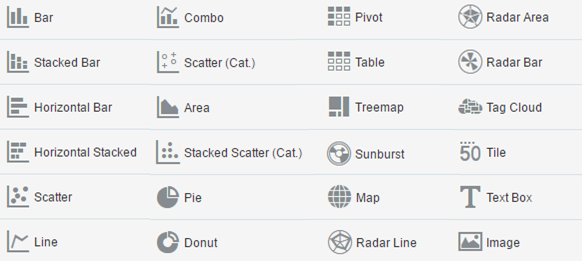
The visualizations are very easily created by dragging and dropping Data Elements (data columns in DVD) to the different Drop Targets (that is, the corresponding visual dimensions of the visualization).
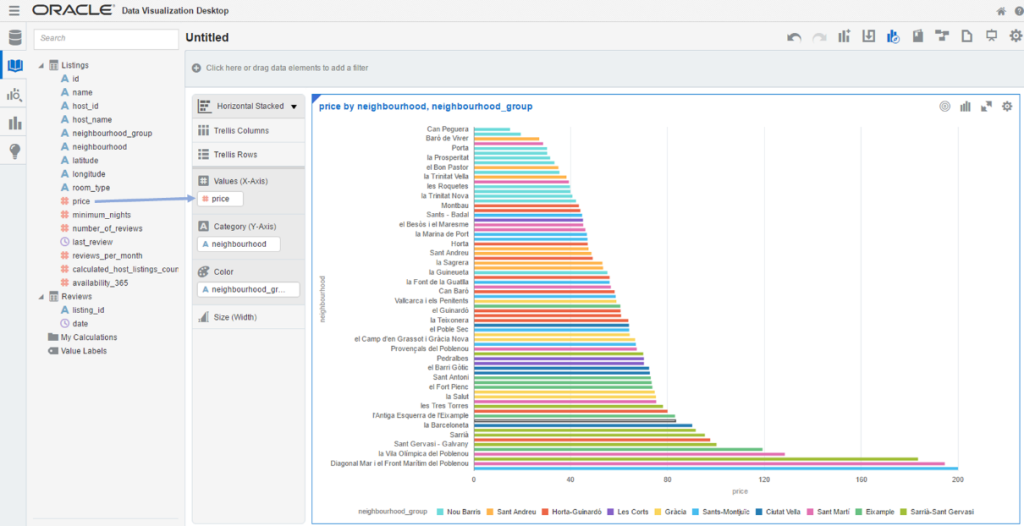
The visualizations can be highly customized in DVD. The user can edit the titles and axis, modify the colour schemes, sort the data, change the data format, etc.
In addition, the Map visualization allows you to create custom maps using the GeoJSON format. The underlying map engine is able to render the new maps and join them to the corresponding data element.
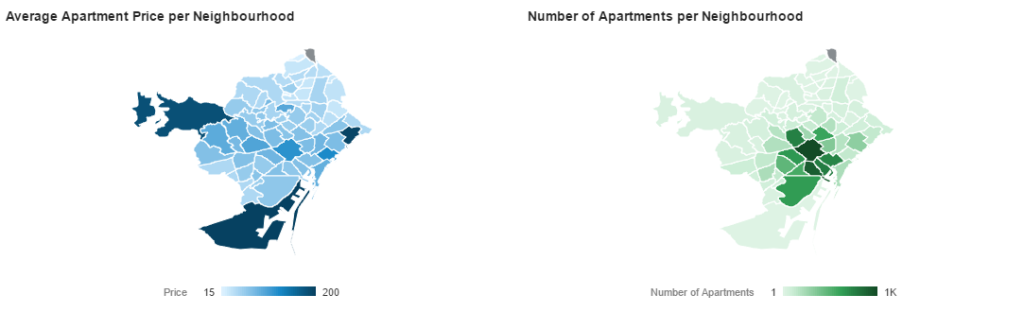
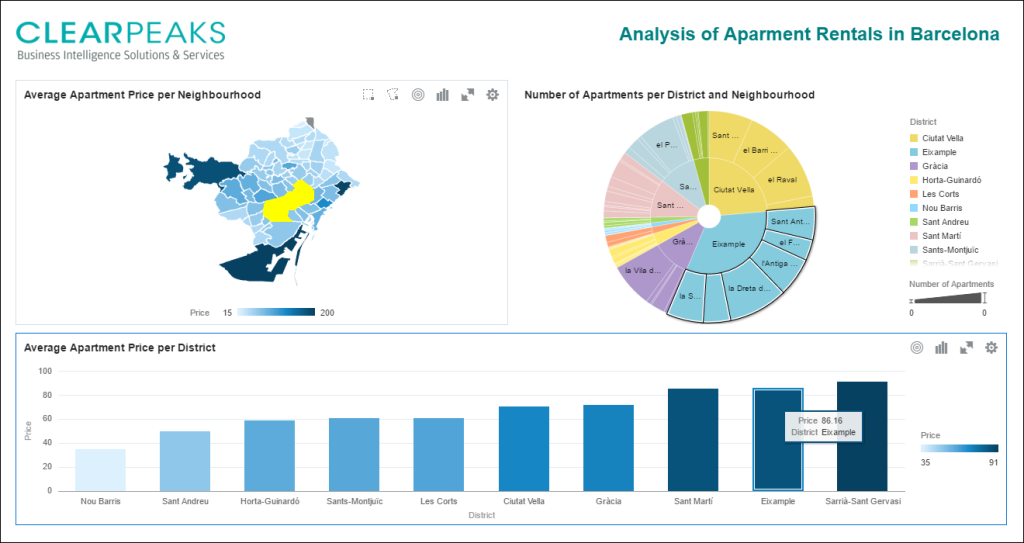
Multiple visualizations can be combined in the Canvas, thus allowing the creation of complete dashboards to analyse the data. In addition, through the Data Brushing feature, the data selected in any visualization is highlighted in the others.
4. Data Discovery and Advanced Analytics
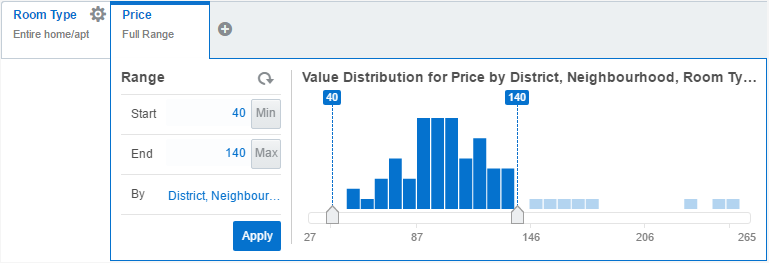
As a Data Discovery tool, DVD includes multiple features to facilitate the data analysis process. One simple tool used for data discovery is the filters: the user can decide to filter Attributes based on values or Measures based on ranges.
Together with the filters, Reference Lines and Trend Lines are available in DVD straight out-of-the-box. As well as these features, more Advanced Analytics tools are available in combination with R. For this reason, DVD includes an Oracle R Distribution (version 3.1.1) installer executable after the installation of DVD. When R and the required libraries are installed, we will be able to use Clustering, Outlier Detection and Forecasting, as well as custom R scripts.
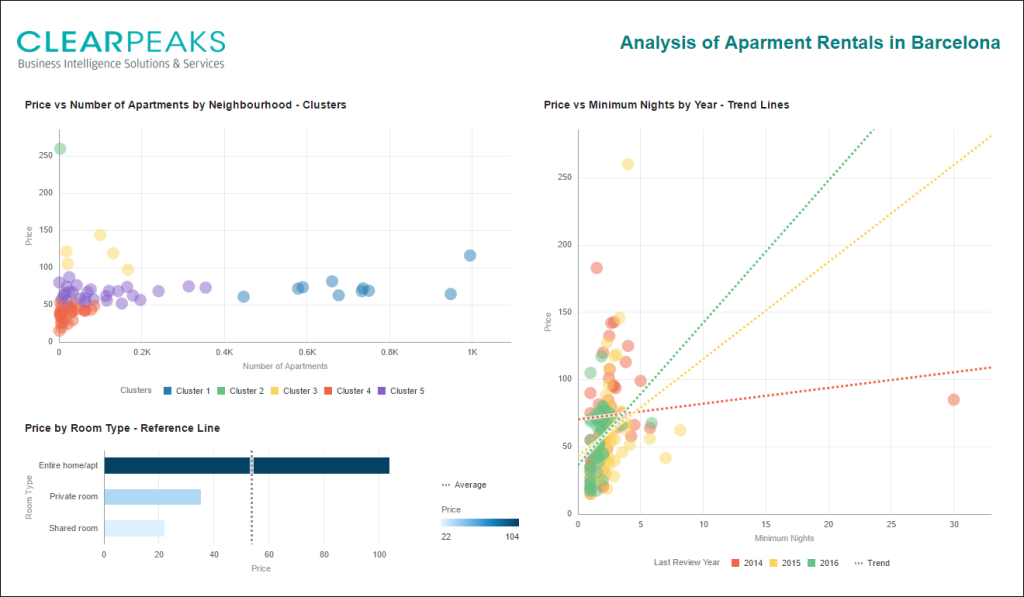
In the example below we use Clusters to identify how the number of apartments by neighbourhood affects the price. In addition, we have a Reference Line to analyse the average apartment price for different room types. Finally, using Trend Lines, we can see that the relationship between minimum number of nights and price has been increasing over the last few years.
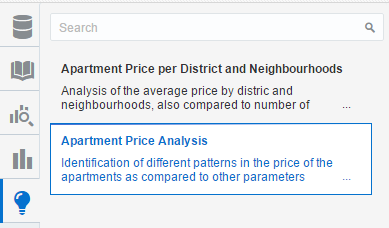
Thanks to the data discovery and advanced analytics capabilities of DVD, we can easily identify hidden information and patterns in our data. In order to keep track of the data discovery flow, we can use the Story Navigator, which allows different insights to be saved. These insights are very useful when we want to share a project, letting other users understand our findings fast.
5. Managing Projects
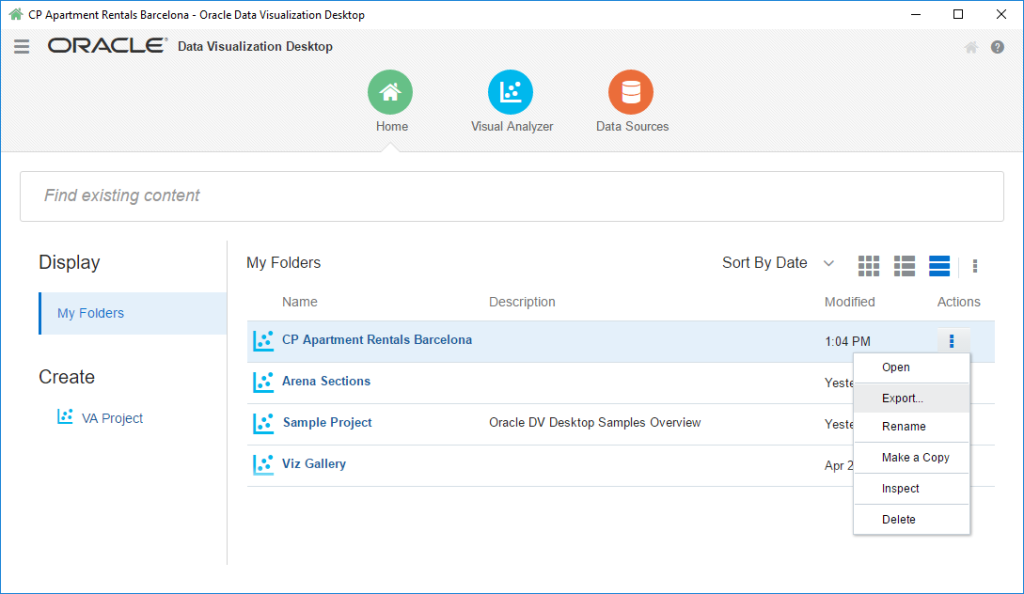
It is very easy to share Projects in DVD. The first thing to do is to save them locally; the different Projects are shown in the Home page. From the Home page we can select the option to export the Project, which will create a DVA (.dva) file. It is possible to store the source data in this file and protect it with a password.
At the other end, we can similarly use the Import option to add the Project to our main folder in the Home page.
6. Oracle Data Visualization Training
We provide a wide range of training services designed to propel course delegates to a project-ready state, ensuring they have both the necessary BI theory as well as the hands-on practical skills needed to engage in a BI project with confidence.
Here in ClearPeaks we are experts on Oracle Data Visualization and we can offer you this expertise in our specialized training sessions.
Get in touch with us and see what we can do for you!