25 May 2022 Paginated Report Visuals in Power BI
As we have seen in recent years, Microsoft is trying to integrate all its BI and analytics programmes together to optimise and facilitate their use (one example is Power Platform, where programmes like Power Apps, Power BI and Power Automate are completely integrated with each other).
Since December 2021, Power BI Desktop comes with the option to include a paginated report visual inside a report or dashboard. This visual allows us to interact with a Power BI paginated report (created by Power BI Report Builder) directly from the Power BI Desktop version itself, making the creation, visualisation and exportation of paginated reports much easier.
Requirements
There are a few requirements to bear in mind before creating a paginated report:
- In order to create a paginated report, you need to have a Premium user workspace. It is also highly recommended to publish the paginated report in the same Power BI report workspace – if we can see the Power BI report, we will be able to see the paginated report visual too.
- Check that the data type of the parameters inside the paginated report and the data used in the Power BI report are the same.
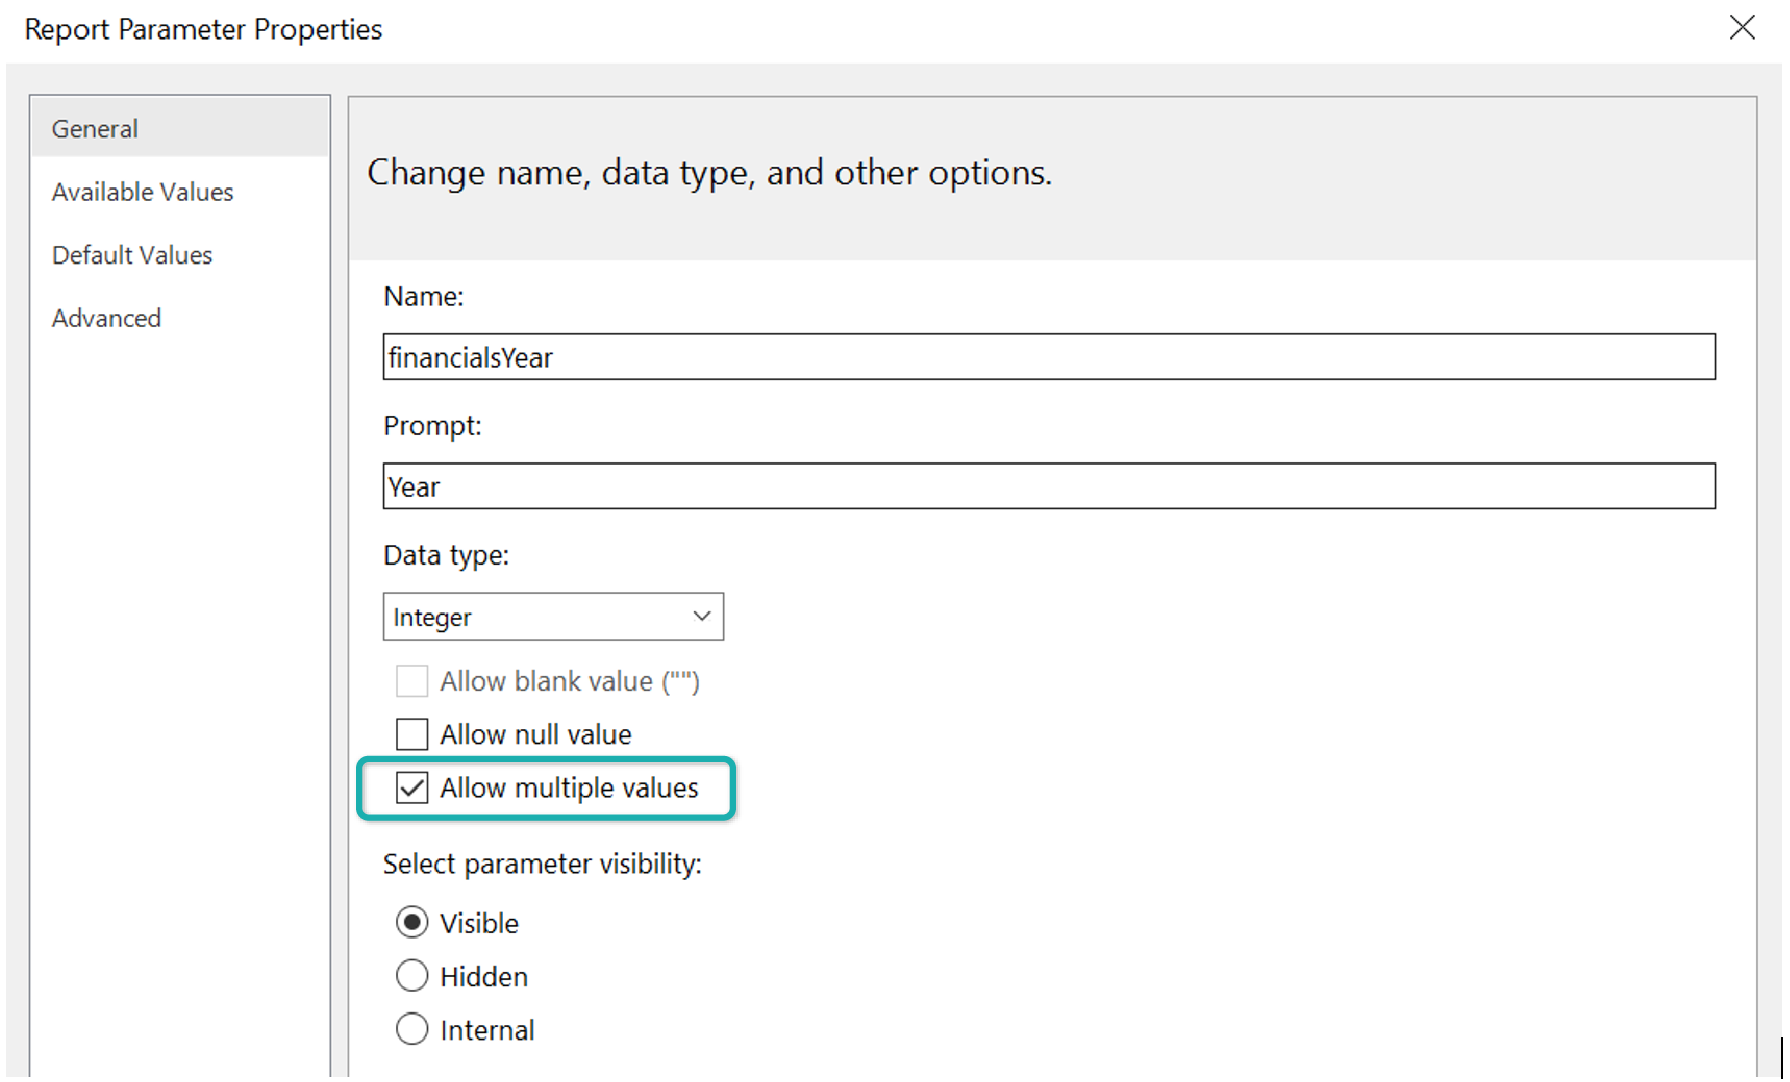
- If you want to create a paginated report using different values, tick the multi-select option in the properties parameter section in Power BI Report Builder.
How it Works
Creation of a Paginated Report
To be able to create a paginated report visual, you first have to create a paginated report and publish it in a Premium workspace. Follow these steps to build one:
- Sign in into Power BI Report Builder and create a new report.
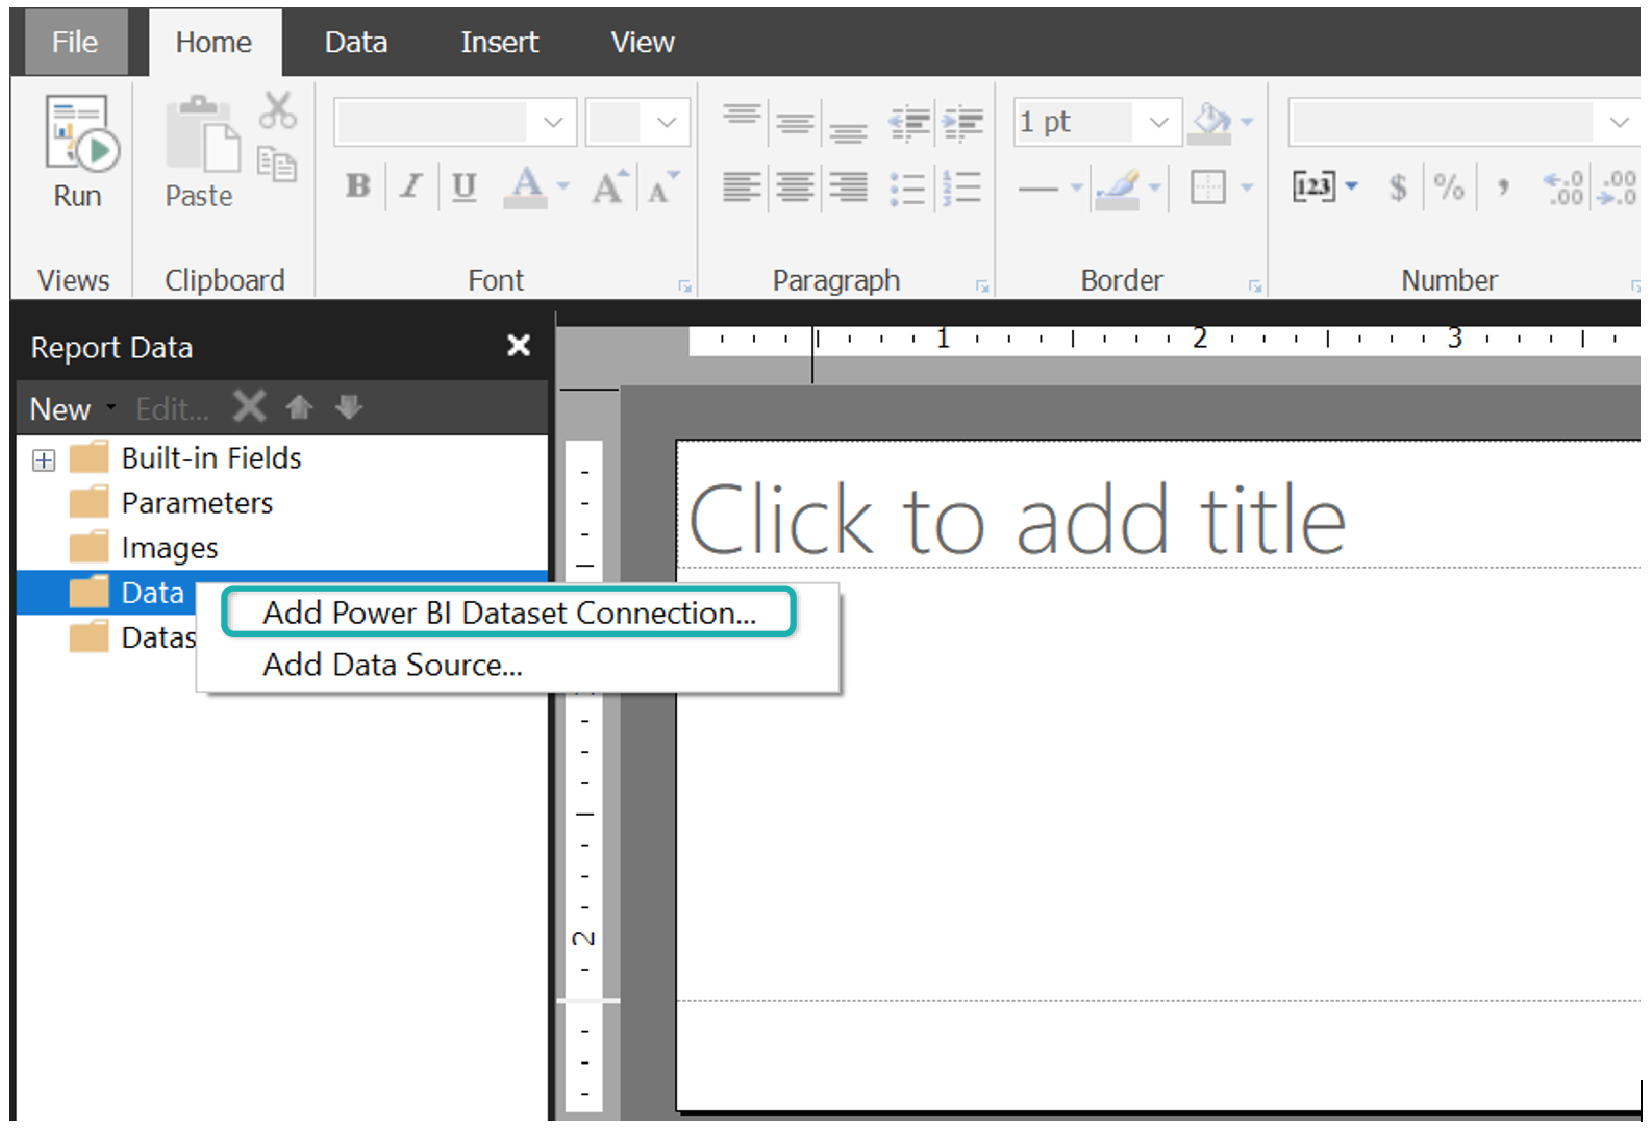
- Connect this report to the Power BI dataset from the Power BI service that is going to be used in the Power BI report. To connect, right-click on the Data Sources folder and select Add Power BI Dataset Connection; then find the desired dataset.

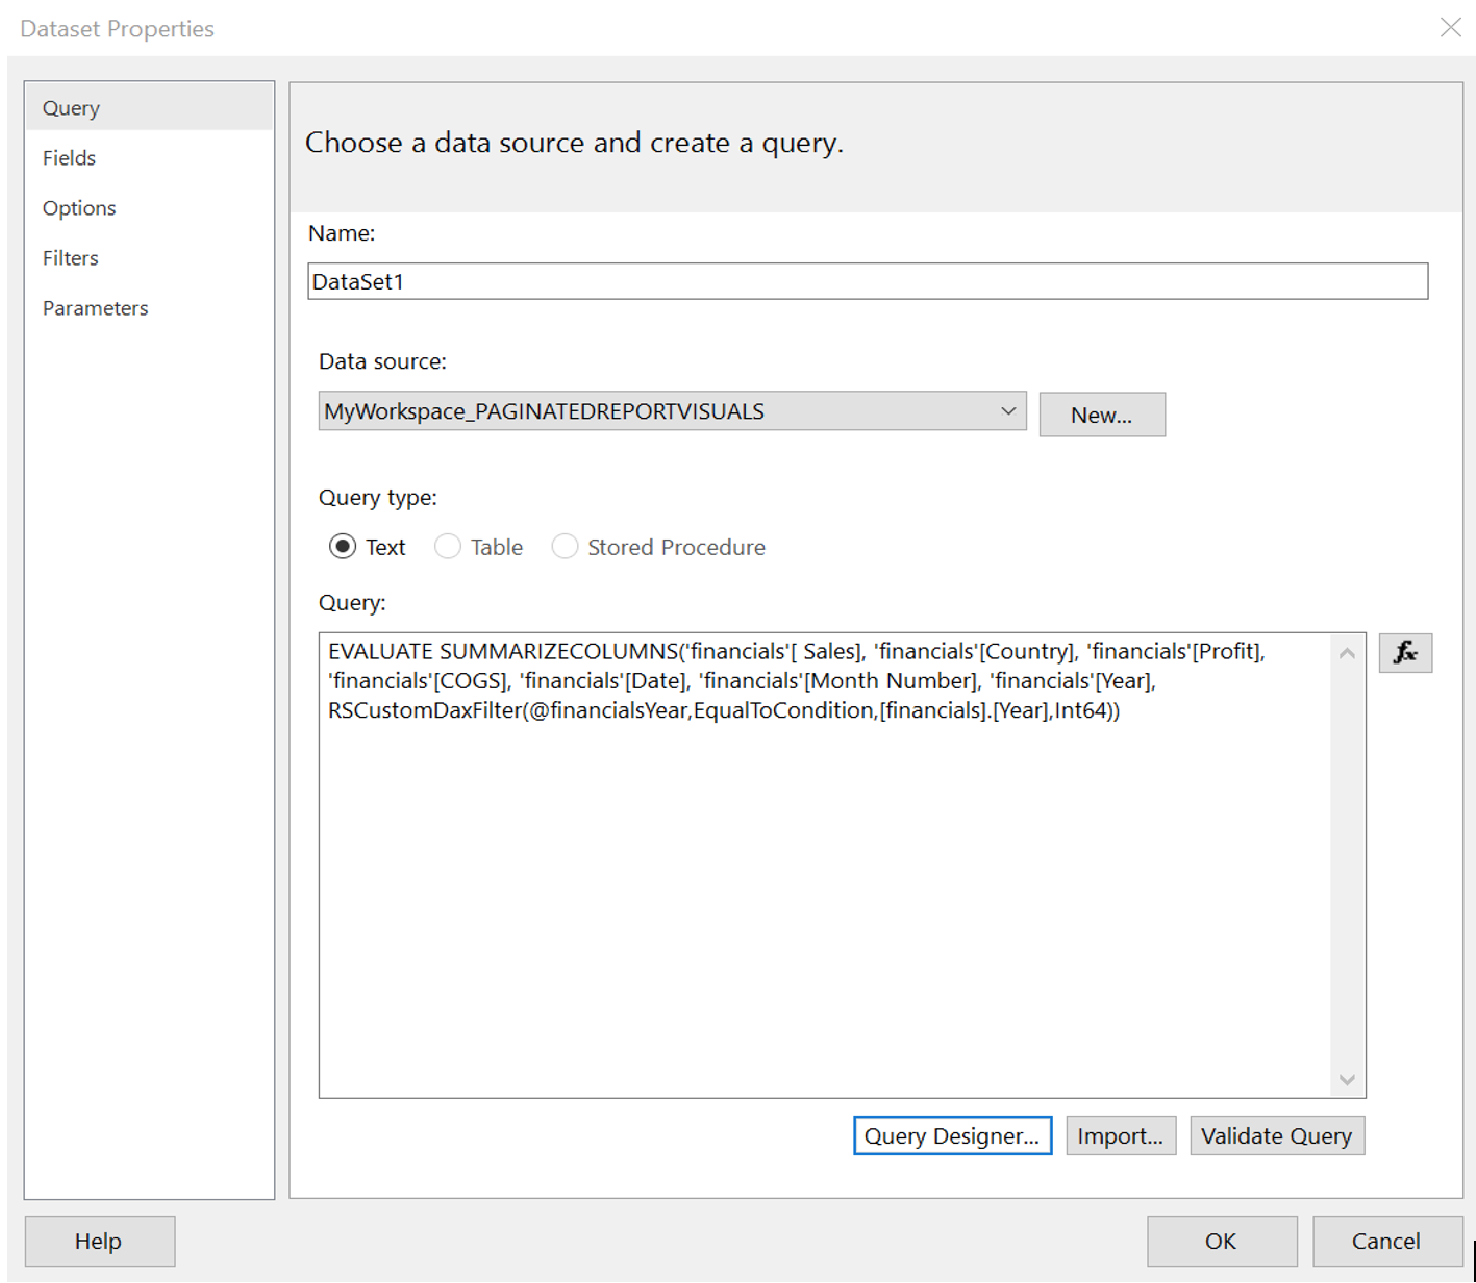
- Once the data source has been created, the next step is the creation of a dataset: right-click on the Datasets folder and select Add dataset; choose the data source you just created and insert a query to collect the required data for the paginated report:

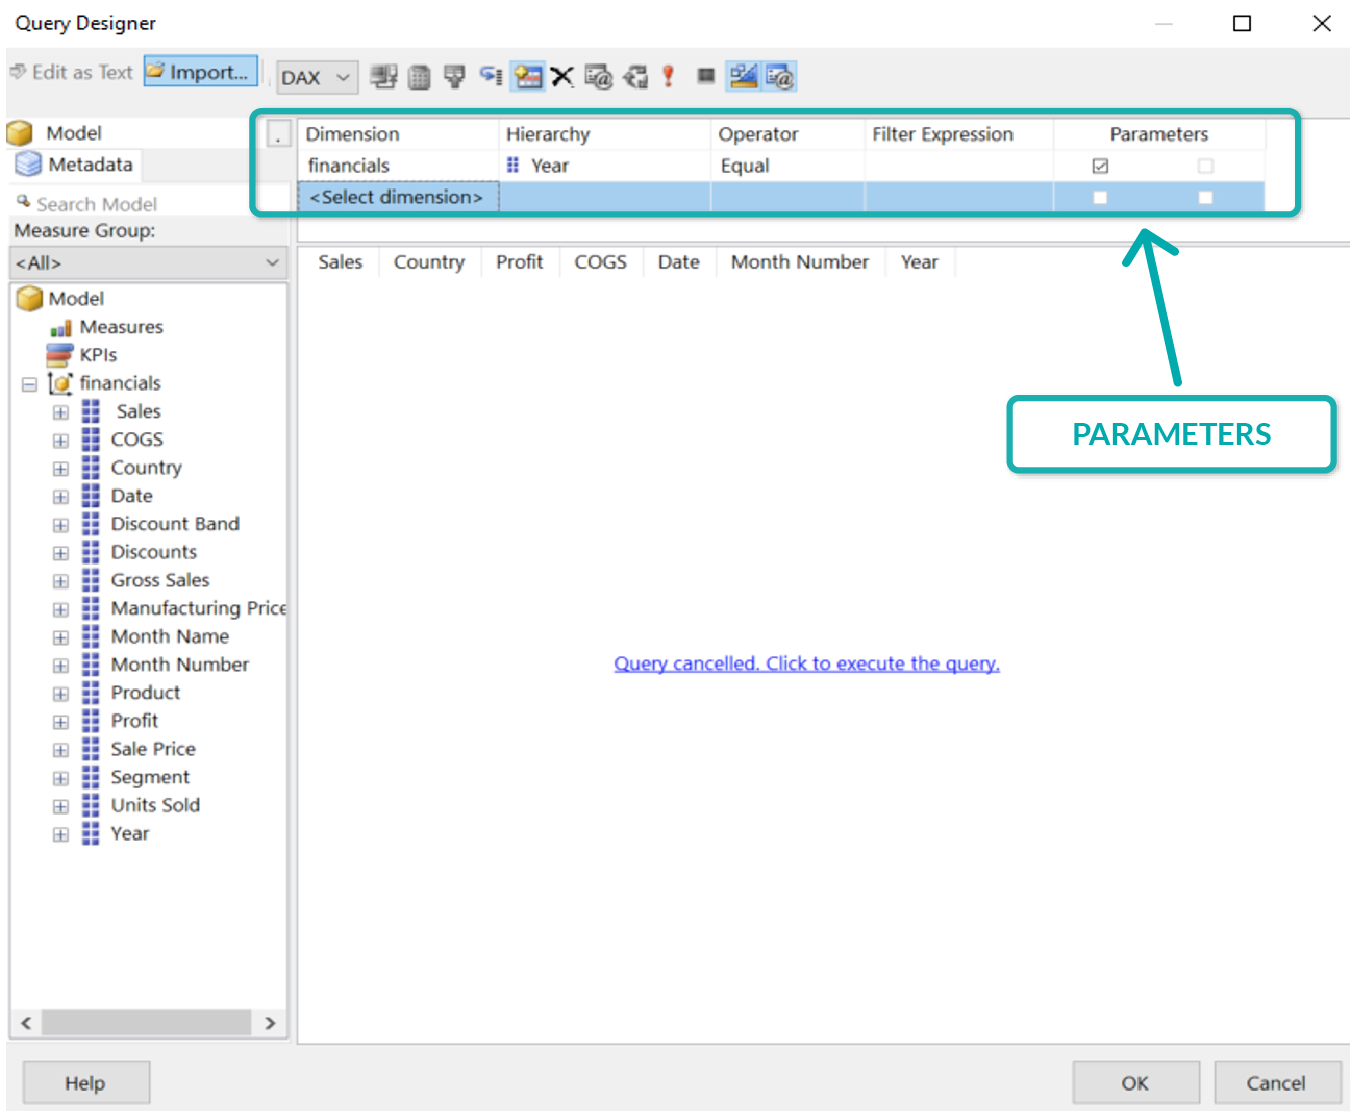
- Now we have to add a parameter that will be used as a slicer or filter in our reports. For example, in this dataset, the field Year has been selected as a parameter inside the query designer (IMPORTANT: it is necessary to tick the Parameters box in order to parametrise the field).

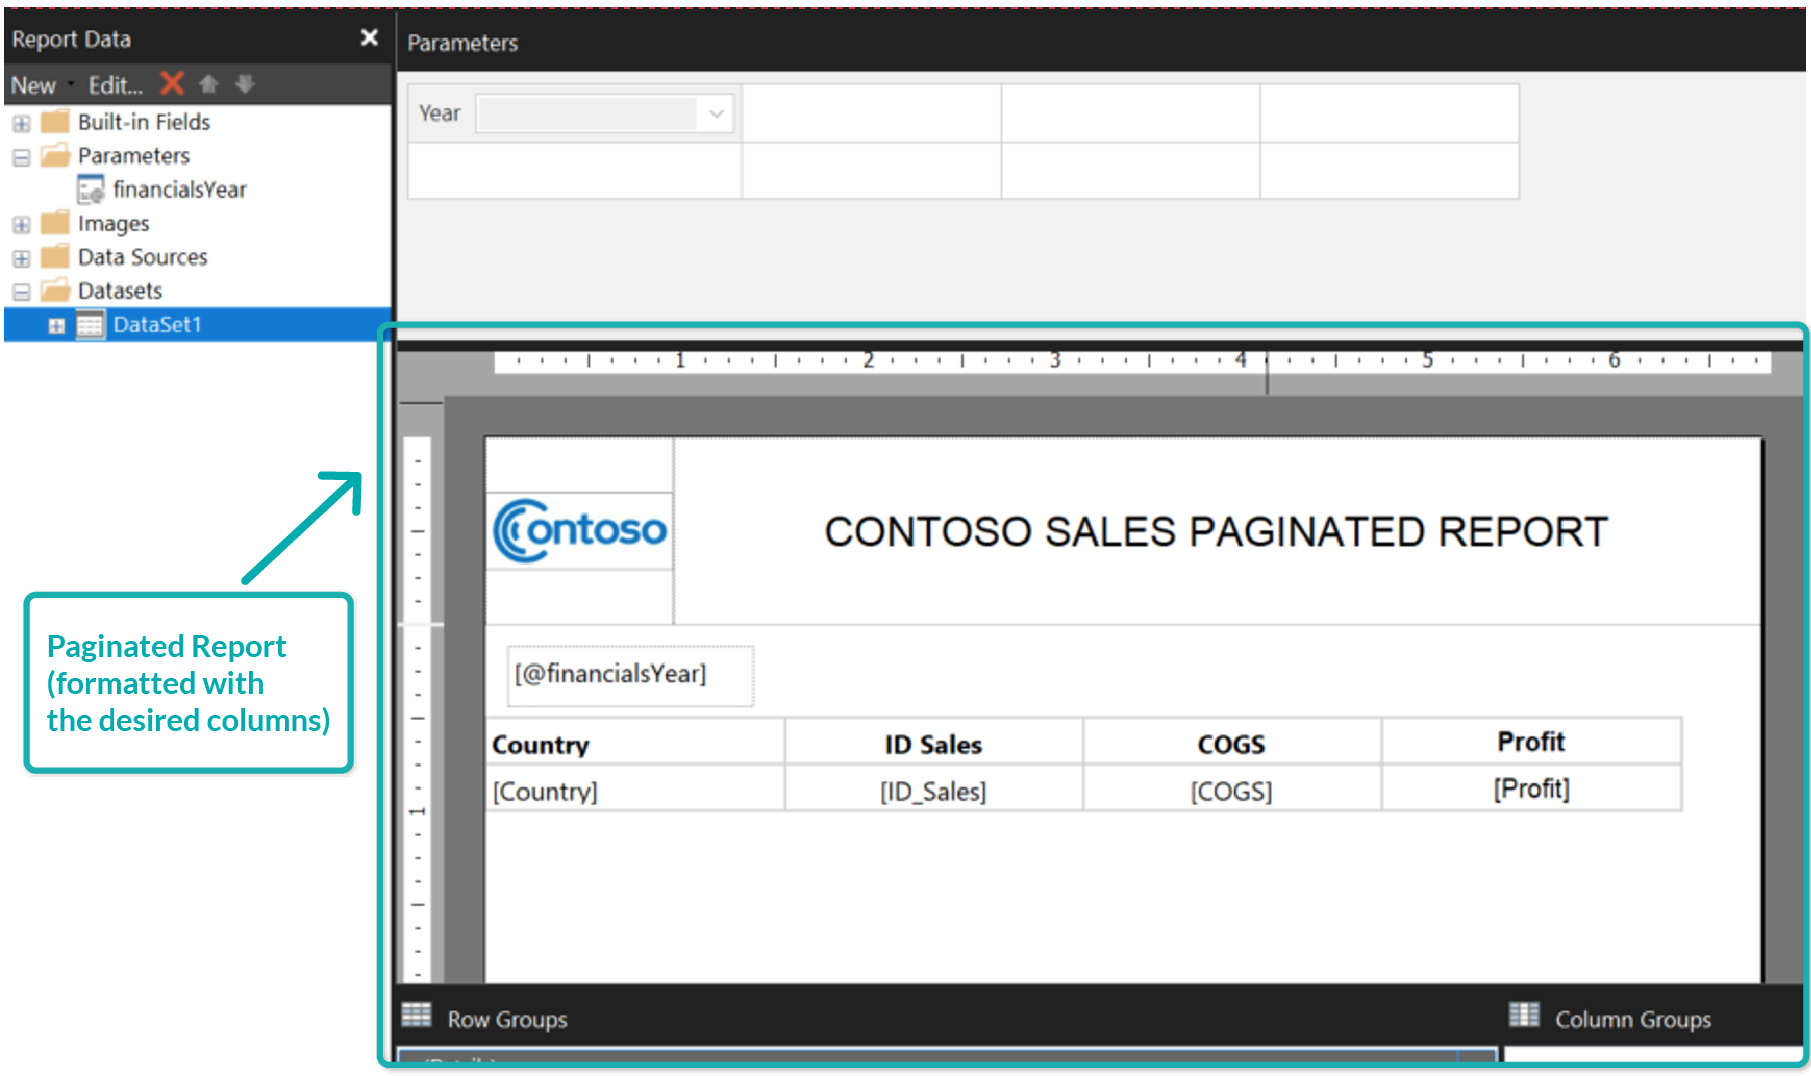
- Once the dataset has been created and the fields parametrised, we can create the report itself by formatting and adding the columns to the report. For more training and information about adding and creating datasets and formatting reports, check out the free Microsoft Course on YouTube about paginated reports, where these steps are explained in greater detail.

- Once the report has been created in the right format, publish it in the same workspace as the Power BI report to which the visual is going to be added.
Note that it is not strictly necessary to publish the paginated report in the same workspace as the Power BI report, but doing so does ensure that the user with credentials to enter the Power BI report will also be able to see the paginated report visual.
Adding a Paginated Report Visual to a Power BI Report
Following the creation of the paginated report, the last stage is to add the visual to the Power BI Desktop report. The steps are explained below:
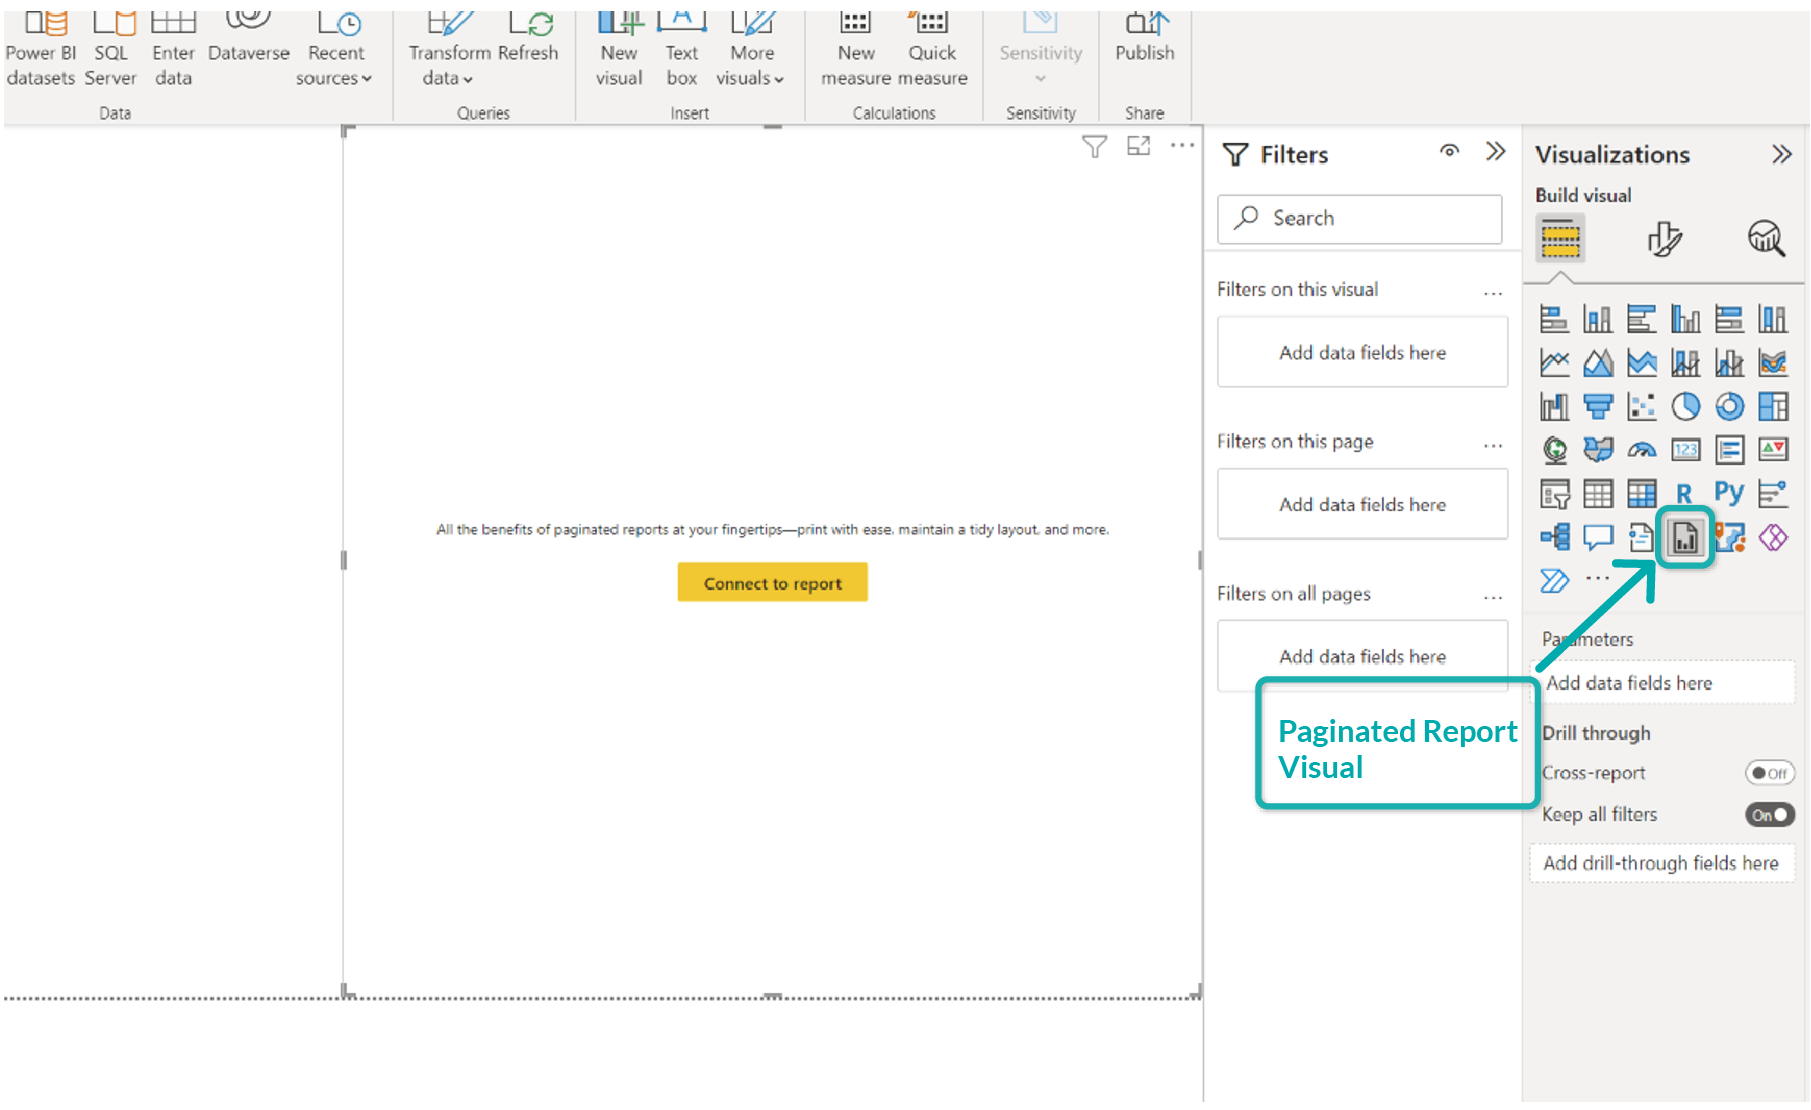
- Select the paginated report visual icon in Power BI and add it to the canvas. Press the Connect to report button inside the visual and pick the report that has already been created.

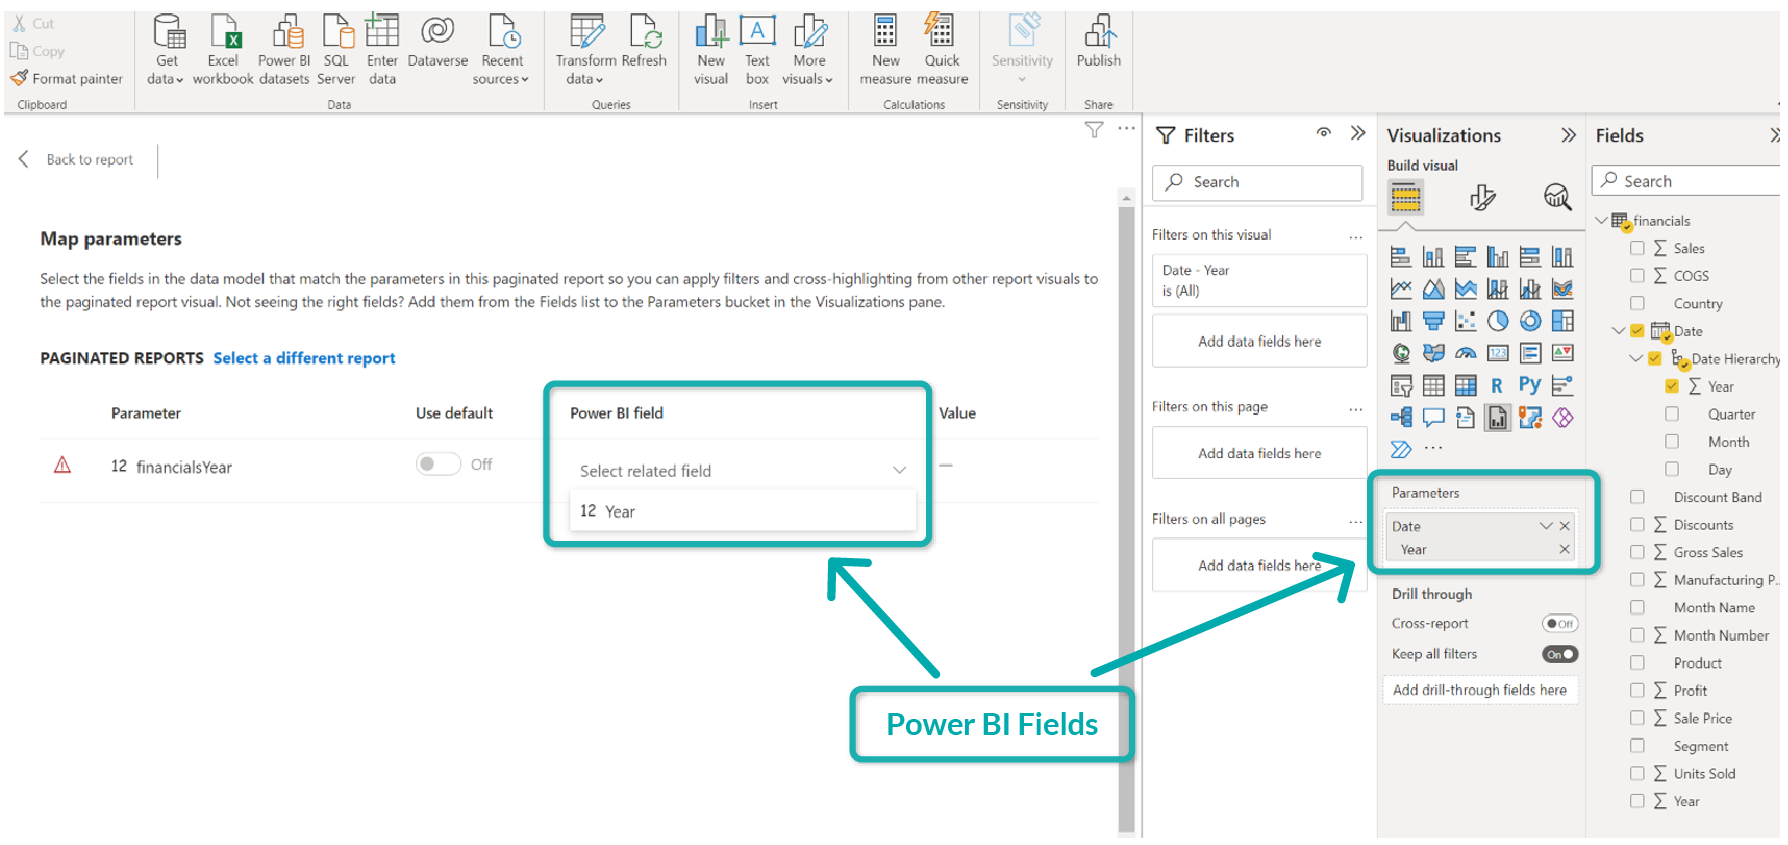
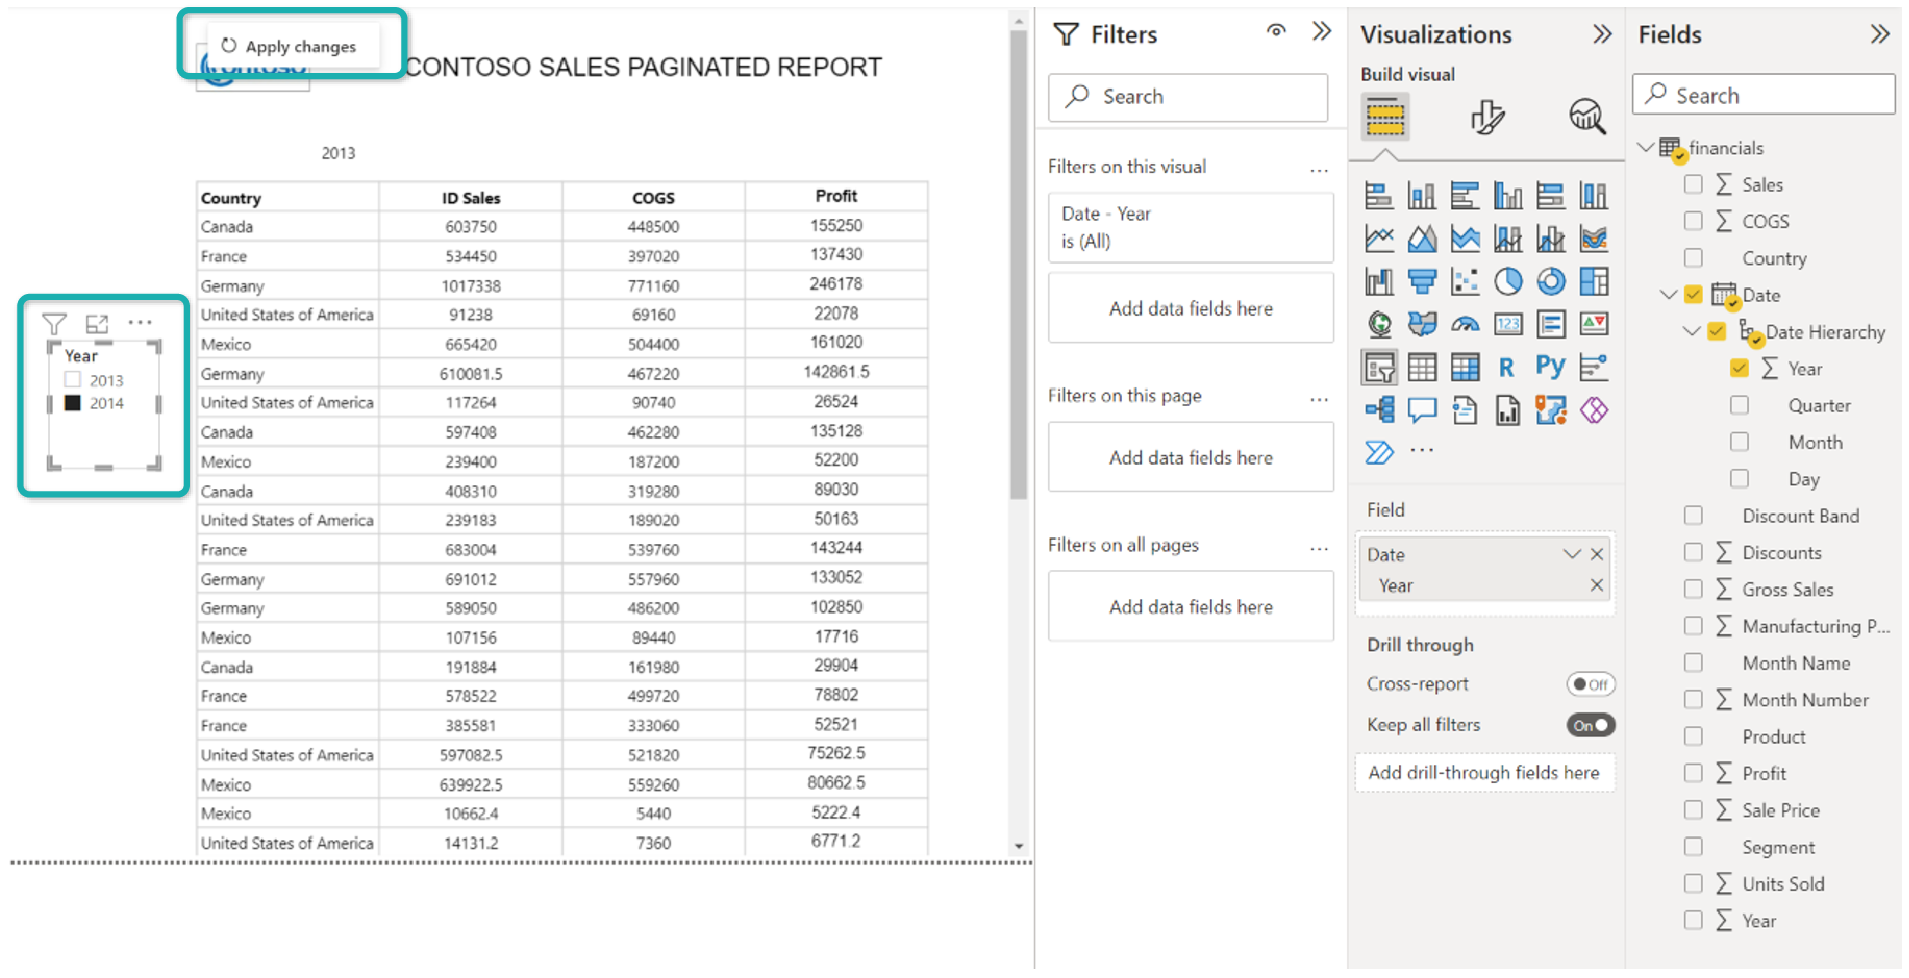
- The visual will ask you to link the parameters of the selected report to the fields from Power BI. In order to do so, drag the field to the Parameters section of the visual, thus allowing us to select the parameter from the drop-down Power BI field. In this example, the @financialsYear parameter from the paginated report relates to the Year field from Power BI. Once this step is complete, the report will appear in the visual.

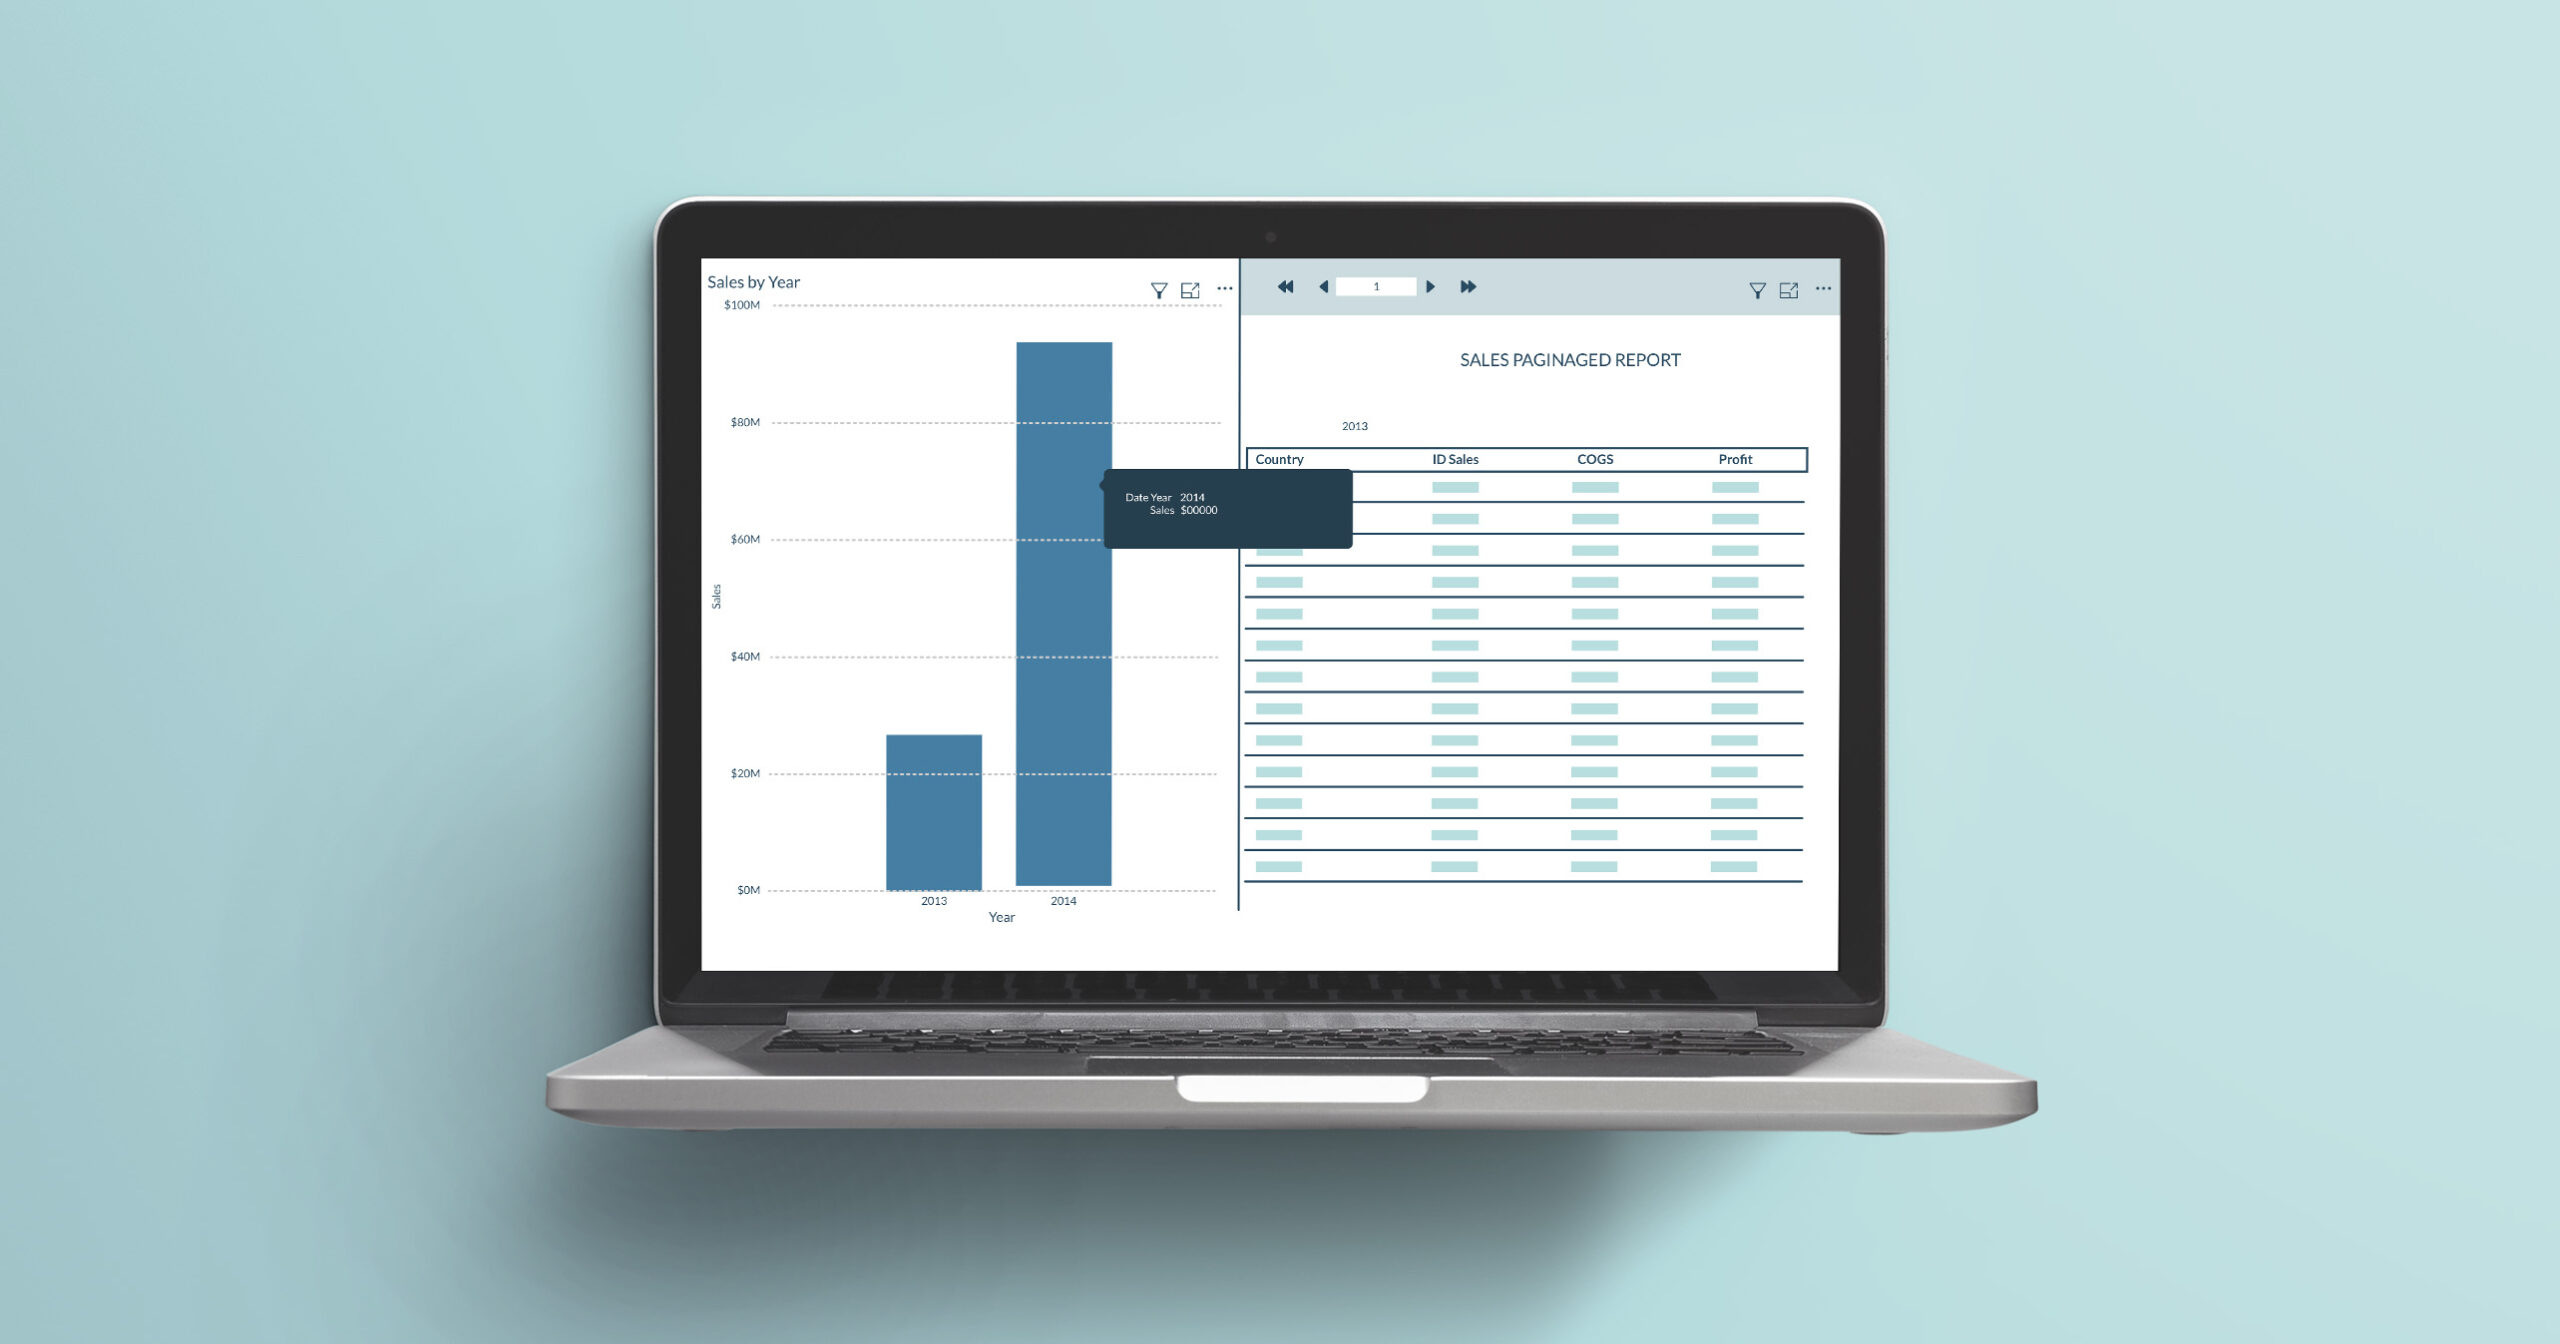
- This connection between parameters and fields now allows us to filter the report using slicers or other visuals in the Power BI report. In this example, a slicer has been added for the Year field. If we select 2014 in the slicer, an Apply changes card appears in the visual:
 If we click on this card, the report will show the data for 2014 as shown below:
 It is important to point out that paginated report visuals can be filtered using other visuals (not only slicers). For example, imagine that the report has a column chart where each column represents total sales by year. If the user selects the 2014 column, this filter will also affect the paginated report visual, filtering it by the year 2014 too.
 If we click on this card, the report will show the data for 2014 as shown below:
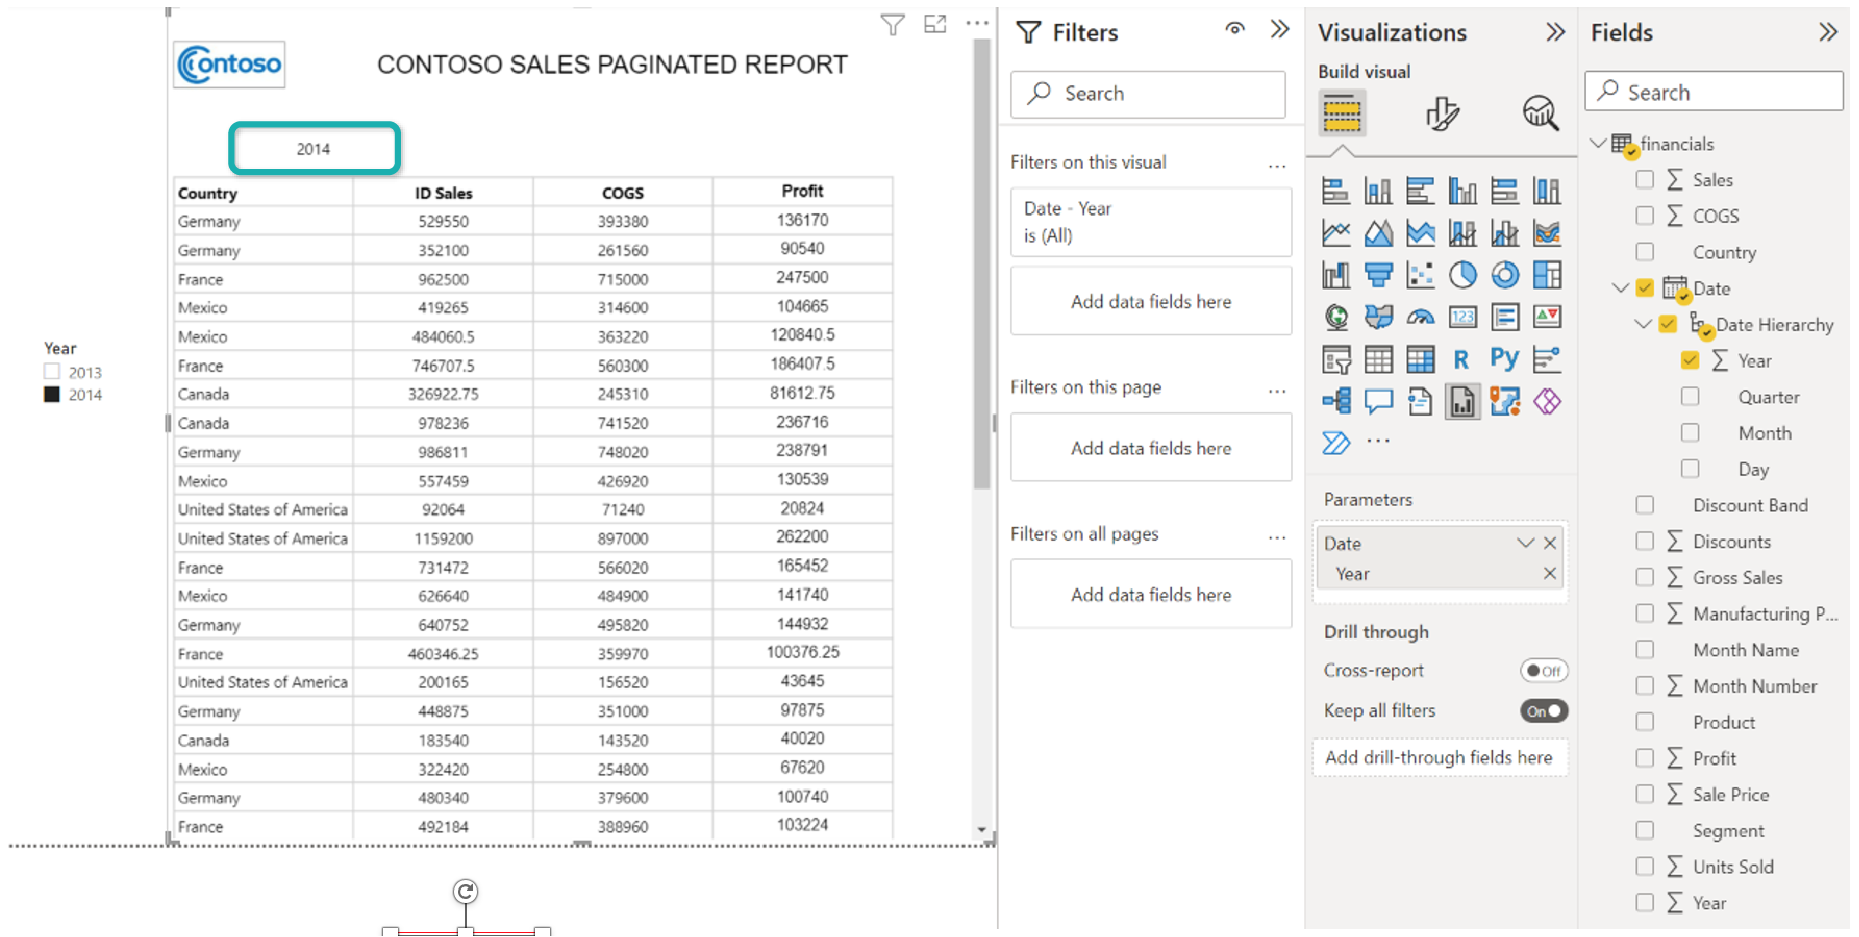 It is important to point out that paginated report visuals can be filtered using other visuals (not only slicers). For example, imagine that the report has a column chart where each column represents total sales by year. If the user selects the 2014 column, this filter will also affect the paginated report visual, filtering it by the year 2014 too.
Visual Format Properties
Aside from the typical chart properties (like position, adding a title, visual effects, etc.), the paginated report visual has two additional format properties:
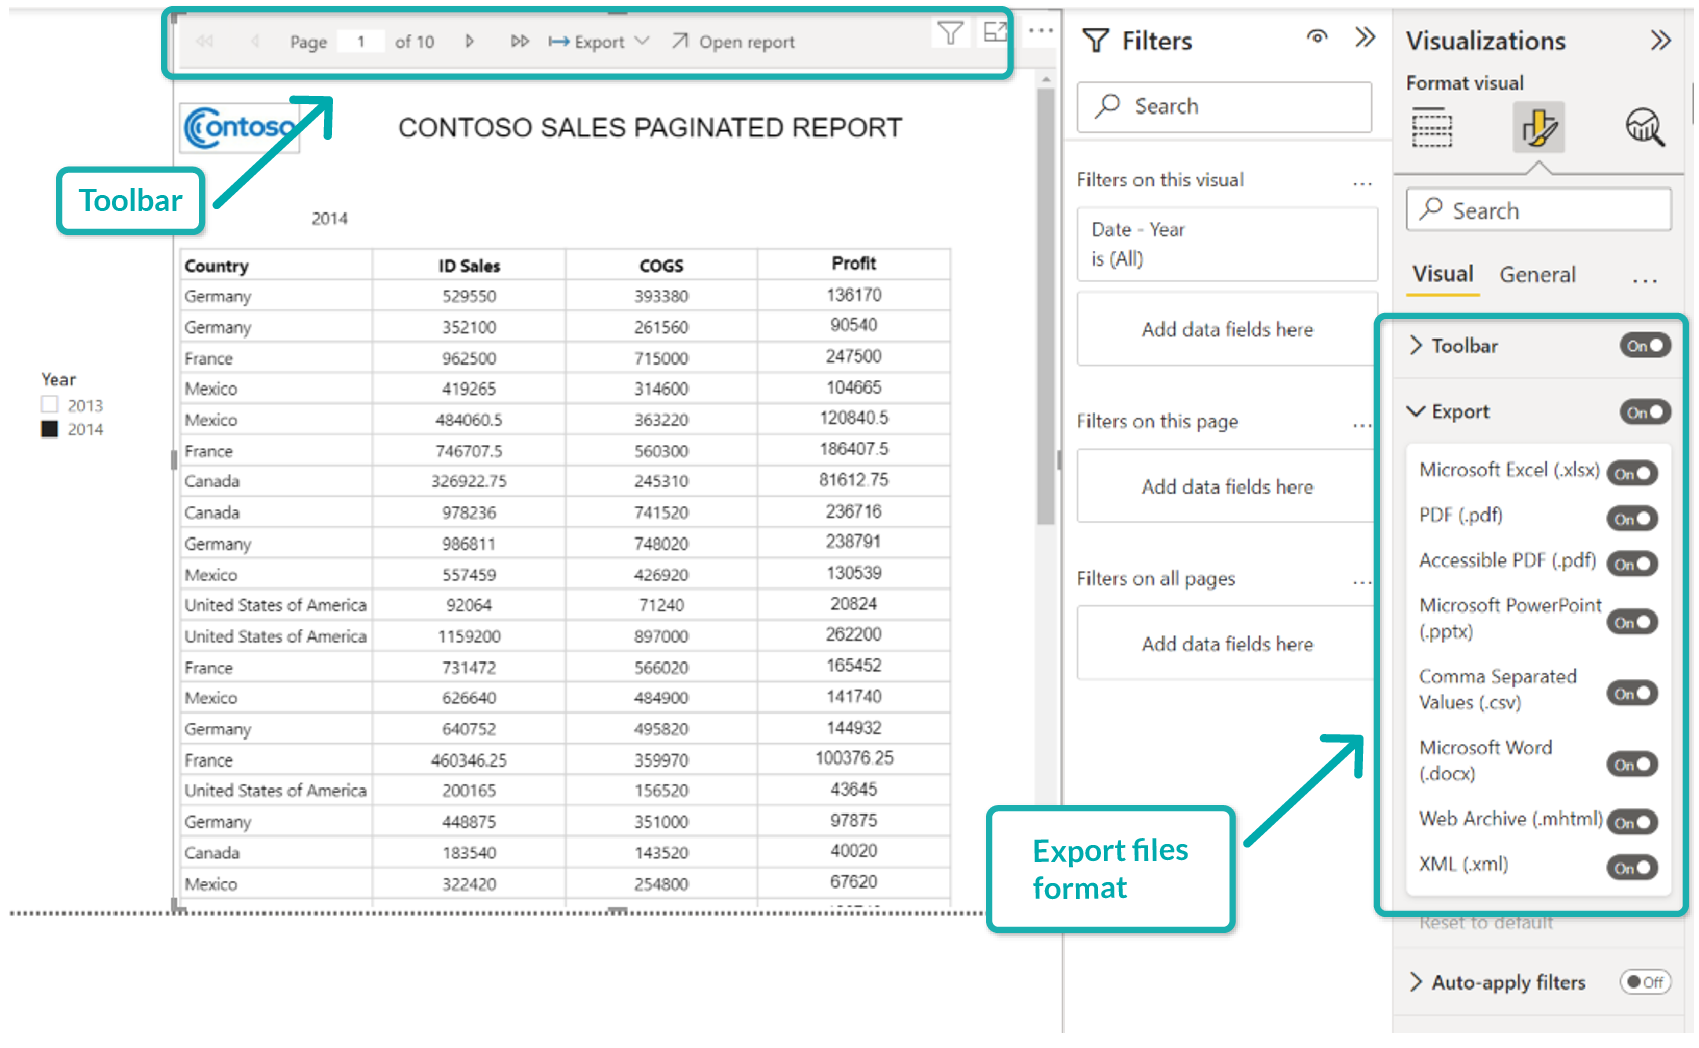
Toolbar
If Toolbar is on, a toolbar will appear in the visual, showing the number of pages in the report, a button to open the report directly in Power BI and an Export option that will allow us to export the report in eight different file formats.
An extra Export option will show up under the Toolbar option, where the user can define in which file formats the report will be exported.
Auto-Apply Filters
If this option is on, every time that a slicer or filter is changed in the Power BI report, the visual will automatically refresh the data. We recommend setting this option to off, because if a lot of slicers are being used the visual could perform very slowly, as the refreshing of data will be constant.
Conclusions
The paginated report visual is a very useful tool to facilitate the addition of paginated reports to Power BI reports and dashboards. There is no need to go to the specific paginated report to filter the desired data for the report, thus offering the user an easier and more integrated experience.
You might be wondering why we need to create a paginated report visual if the same purpose can be achieved by exporting a data table. There are several advantages:
- The paginated report allows us to format the data and present it in a better-looking way than a normal table.
- Tables can only be exported as excel files (xlsx), while paginated reports allow for eight different export formats.
- Tables have a maximum row limit for export (150,000 rows), while there is no limit on paginated reports.
The only disadvantage of this is the processing speed: as the report has to work through a lot of data and SQL queries, refreshing the visual could take a bit longer than we’d like.
If you have any questions about what you’ve read, or if you think ClearPeaks can help you on your BI journey, don’t hesitate to contact us and see what we can do for you.