
09 Aug 2023 Power BI Dynamic Filters Using Field Parameters
Do you have a Power BI report that needs to show a visual for different dimensions? The old solution was to use bookmarks to capture the state of a page and to enable a return to that same state with a single click.
Microsoft has introduced field parameters which allow end users to dynamically change the measures and dimensions being analysed within a report. This functionality is much easier to use than bookmarks, but the interesting new functionalities do not stop here, as they also added the option to create dynamic slicers based on a field parameter. This is useful because when the end user changes the selected field for the dimension picker, not only will the main visual update but the dynamic slicer will too, to show the values of the selected dimension, which can be used for filtering.
In this blog post we´ll see how to create dynamic slicers and field parameters from scratch and then how to use them, employing a sample dashboard for demo purposes.
General Requirements
- Power BI dashboard: You must know the table and field names from the dataset.
- Field parameters preview feature: This needs to be enabled in the report settings, we´ll look at how to do this later.
Sample Dashboard
We´re going to use the following company sales dashboard with fictitious data, for demo purposes only:
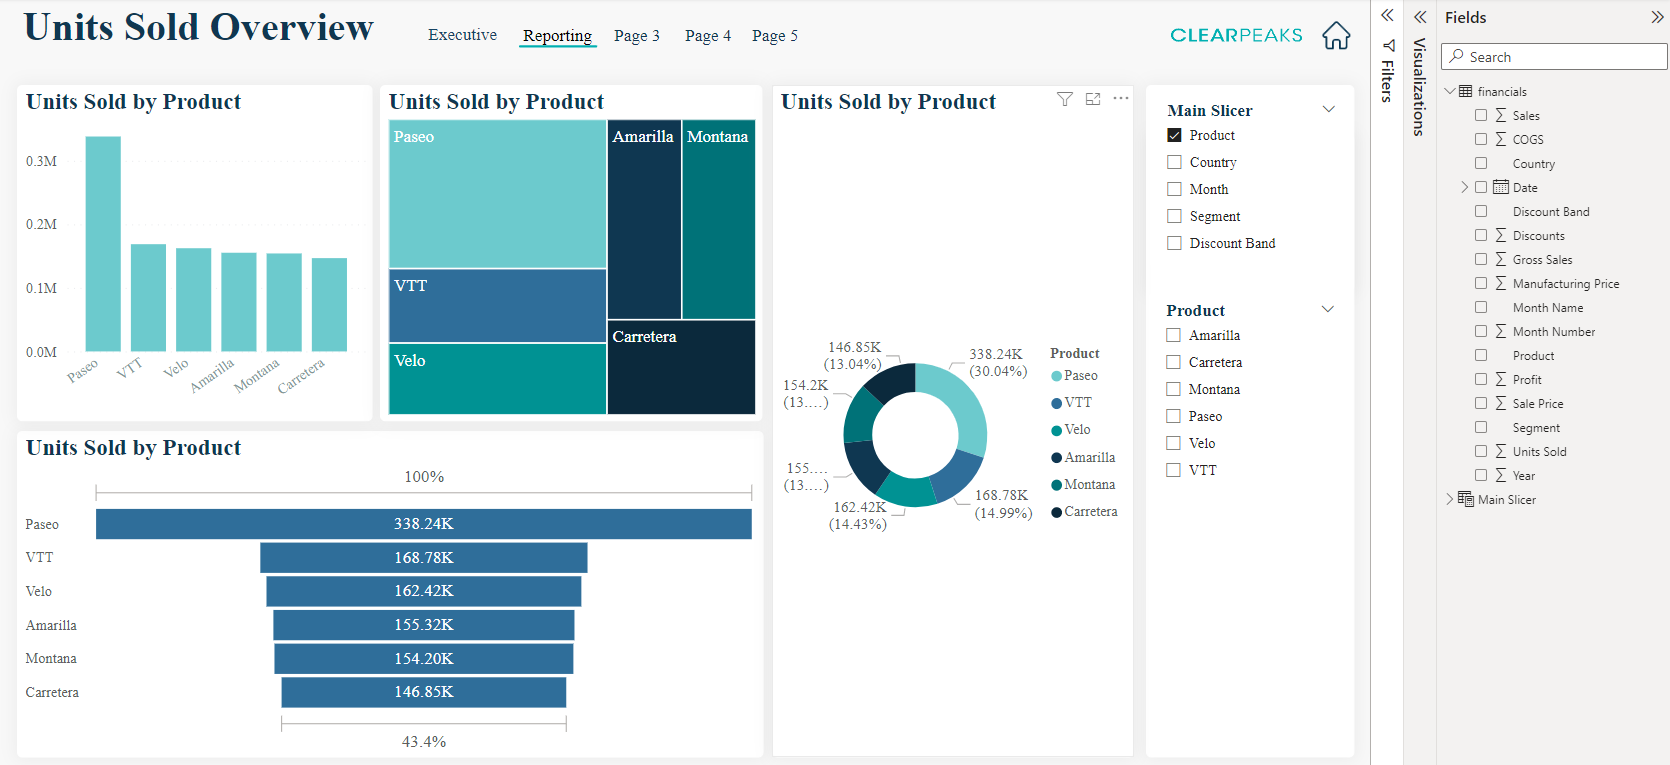
We´re going to use the following tables and fields:
Table Name | Field Name | |
|---|---|---|
Financials | Product | |
Financials | Country | |
Financials | Month | |
Financials | Segment | |
Financials | Discount Band | |
Financials | Units Sold |
Dynamic Filters and Field Parameters
In the use case section below we´ll see the benefits of creating field parameters and associating them to a dynamic filter; in this section we´ll explain how to create them.
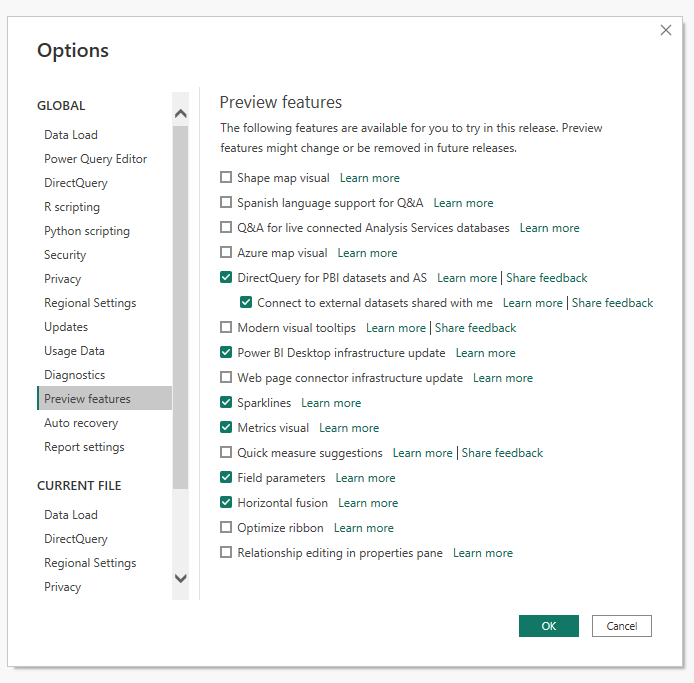
As we said before, first of all the feature needs to be enabled in settings (in the latest version it is enabled by default). To do so, go to File > Options and settings > Options > Preview features > Field parameters:
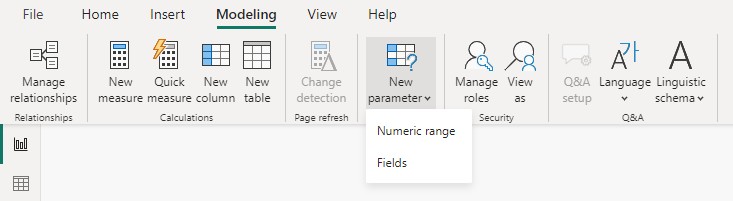
Once everthing we need has been enabled, the next step is to create the field parameter. Go to the Modelling tab and select New parameter > Fields:
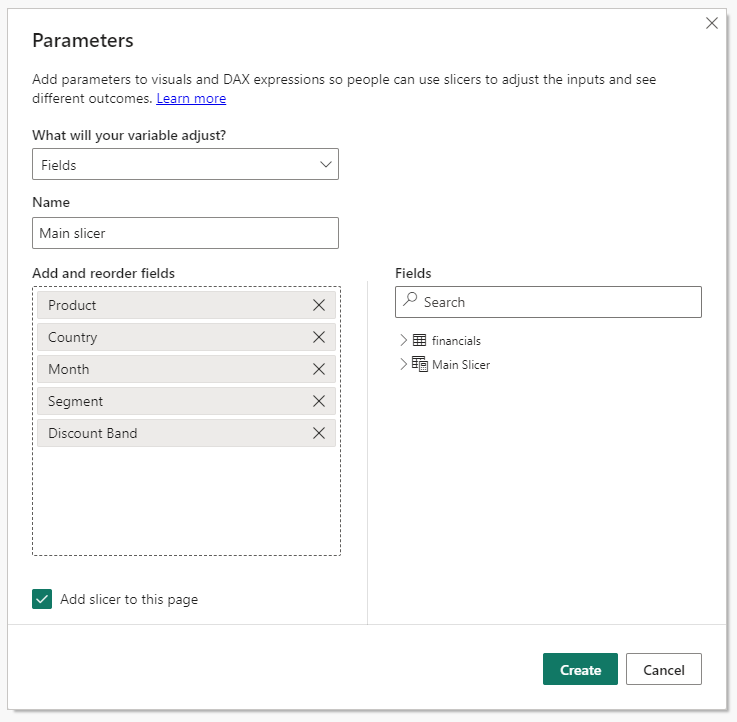
A new window will open asking for a few things such as the name of the paramater and the fields you want to use. In our case, we will name it “Main Slicer” for learning purposes, and we will add the following dimensions:
Table Name | Field Name | |
|---|---|---|
Financials | Product | |
Financials | Country | |
Financials | Month | |
Financials | Segment | |
Financials | Discount Band |
Once the parameter has been created, it will appear in the fields section of Power BI along with all the tables. In order to use it to control the measures or dimensions of a visual, we need to add it to the visual:
Dynamic Filter
Once the field paramater has been created the dynamic filter can be built. The process is not particularly intuitive but it is fairly simple. All we need to do is to duplicate the field paramater using copy and paste, and the duplicated parameter will become the dynamic one after one last step: select the duplicated slicer, right click on the parameter and select Show values of the selected field. This will convert the duplicated slicer into a dynamic one:
Editing a Field Parameter
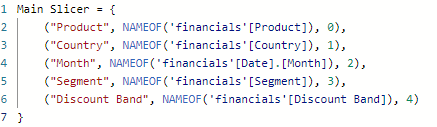
If you need to edit the already created field parameter, you can do so directly with Data Analysis Expressions (DAX), as adding, deleting or editing an entry is easy.
Each DAX expression entry contains the name of the dimension; the measure and the number after the comma indicate the order of the fields.
Use Case
We have a table containing the Units Sold alongside other useful information such as Dates, Products, Country, etc., and we have to show different visuals containing the same measure and dimension on the same page.
Taking into account that we only have to show the Units Sold measure and that the user will choose the dimension, you may well think of using bookmarks to save the state of the visuals for each of the dimensions and adding buttons to toggle between bookmarks. But now there is an easier and cleaner way of solving this task, using filters and field parameters!
Solution Using the New Dynamic Filter and Field Parameter
Instead of having a bookmark for each dimension, we have created a field paramater containing all the dimensions, enabling the end user to switch between them with a single click on the filter. This also avoids the need to create all the different bookmarks from the developer´s point of view.
The field paramater has been created following the instruccions already shown. In order to give the end user some filtering options, a dynamic filter has been created to go with it, as explained before.
With all these changes, the end user can change the dimension of all the visuals and dynamically apply the desired filters.
In this use case, we´ve seen the functionality with a whole page, but this is not always the case. If only a limited number of visuals need to be modified, you should add the field parameter to the drop zones of the visuals that require resizing.
Conclusion
Field parameters allow us to do the same as bookmarks but in a much easier and more intuitive way, also enabling the creation of dynamic filters to filter the dashboard in a modern, attractive style.
These additions are not only useful for the end user, but they are also very helpful to the dashboard creators, as now, in most cases, we do not need to use those tricky bookmarks.
If you need some advice or feedback about Power BI and how it can drive your business forward, don´t hesitate to contact our team of experts who will be happy to help!