13 Aug 2020 Power BI write-back functionality with Power Platform services
There have been lots of new additions to popular data visualization tools in recent years; it is a competitive data analytics subsector where big corporations are competing to develop attractive new features for their services. In ClearPeaks, we are constantly seeking to achieve expertise in the latest technologies and to come up with the best solutions for our clients.
This time, one of our clients required a reporting solution which included an alerting system and an interactive app using Microsoft services. In order to answer the client’s needs we developed an end-to-end solution by integrating several services of Microsoft’s latest addition: Power Platform.
In this blog article, we will show you how we can use all the potential of Power Platform to boost data visualization and reporting to a whole new level. For confidentiality reasons, we are not going to share the original use case, but instead we are going to walk you through an example using publicly available COVID-19 data.
We have created a set of reports in Power BI to view the new cases and total cases of COVID per country and per day – there is a global report, and then specific reports for a few European countries. We have enhanced these reports by building a data-quality pipeline to detect and fix any missing values in the source system, in this case an Excel in SharePoint. This data-quality pipeline provides write-back functionality in Power BI to fill in the missing values directly in the Power BI interface. The fixed values are automatically written back to the source Excel in SharePoint; this is all facilitated by the combination of the three main Power Platform services.
1. Introducing Power Platform
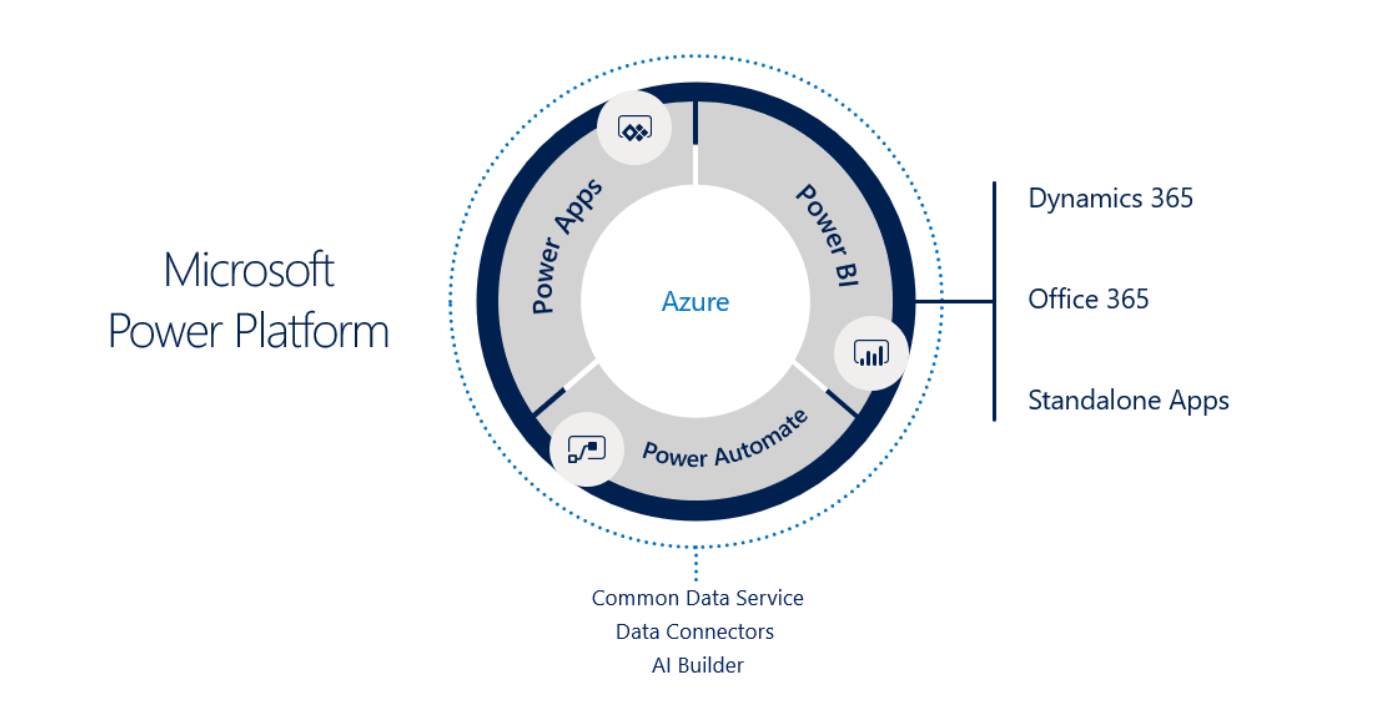
Figure 1: Overview of Microsoft Power Platform
Power Platform is a set of Microsoft business services integrated in Office 365 that are ready to analyse, create solutions and automate business processes. It is comprised of three main services:
- Power BI is a business analytics service that analyses and transforms data to deliver reports in a visually interactive way. It can help users take informed decisions, detect trends or share information with other users. It can easily connect to different data sources thanks to its multiple connectors. It offers four development tools for different needs: Power BI Desktop (free desktop app), Power BI Service (cloud service), Report Server (on-premises server) and Mobile (mobile app).To learn more about Power BI, have a look at the articles we wrote about map functionalities (ArcGIS map and Mapbox integration) and Dataflows. Check out our latest blog too, in which we present Power BI ChatBot.

Figure 2: Power BI logo
- Power Automate, formerly Microsoft Flow, is a tool to automate repetitive processes and tasks by creating business flows, saving us time and resources. It has a direct integration to Power Apps, Power BI, Microsoft Teams, Office 365 and Dynamics 365. There are hundreds of triggers that start these processes automatically and we can classify the different types of flow based on the trigger: automated, button (manual), scheduled, business (based on rules) or UI flows.
![]()
Figure 3: Power Automate logo
- Power Apps is a service to build custom apps for business needs in a code-free development environment. It consists of a graphic interface where we can drag and drop components and configure the data source thanks to the multiple connectors that it offers, either Microsoft services or third party. These apps can easily be shared with people in our organization and run on laptops, tablets, or phones.There are three different types of application that we can create: model-driven (built from data), canvas (totally customizable) or portal apps (responsive websites).
![]()
Figure 4: Power Apps logo
Power Platform offers other interesting features that are worth mentioning:
- Common Data Service is a cloud-scale database to store and manage data that is used by business applications. It boasts total integration with Power BI and Power Automate, so it’s easy to structure a variety of data and business logic.
- Power Virtual Agents is a tool to create bots that offer personalized conversations to our clients or suppliers in order to solve problems quickly.
- Connectors enable us to connect to a variety of apps, data and devices in the cloud. There are more than 275 connectors available and there is the option to create our own custom connectors. Some of the most popular connectors are SQL Server, Azure SQL Database, OneDrive for Business, SharePoint, etc.
- AI Builder is a solution to add AI capabilities to our workflows and apps to improve business performance without writing code.
2. Write-back functionality integrating Power Platform services
The strength of Power Platform lies in its capability to integrate its services to solve interesting business use cases.
In our case we want to check the existence of missing data in our data source and modify these values directly in Power BI. Note that the reporting tools do not usually allow modifying data in the source system as they are read-only. The objective of this solution is to build a data-quality pipeline that provides the write-back functionality in Power BI via the integration of the Power Platform services. In this section, we are going to walk you through the whole process.
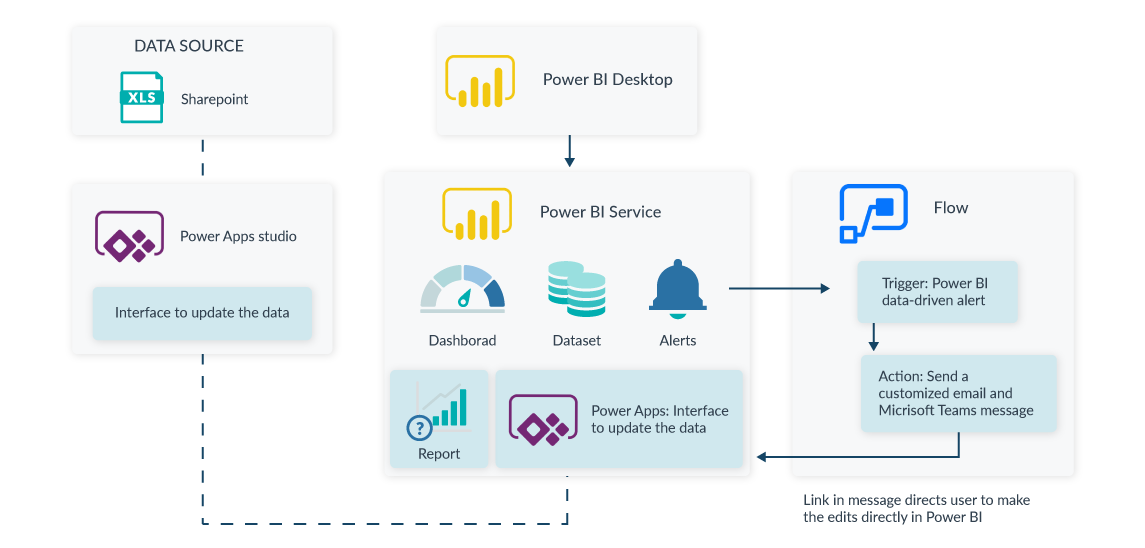
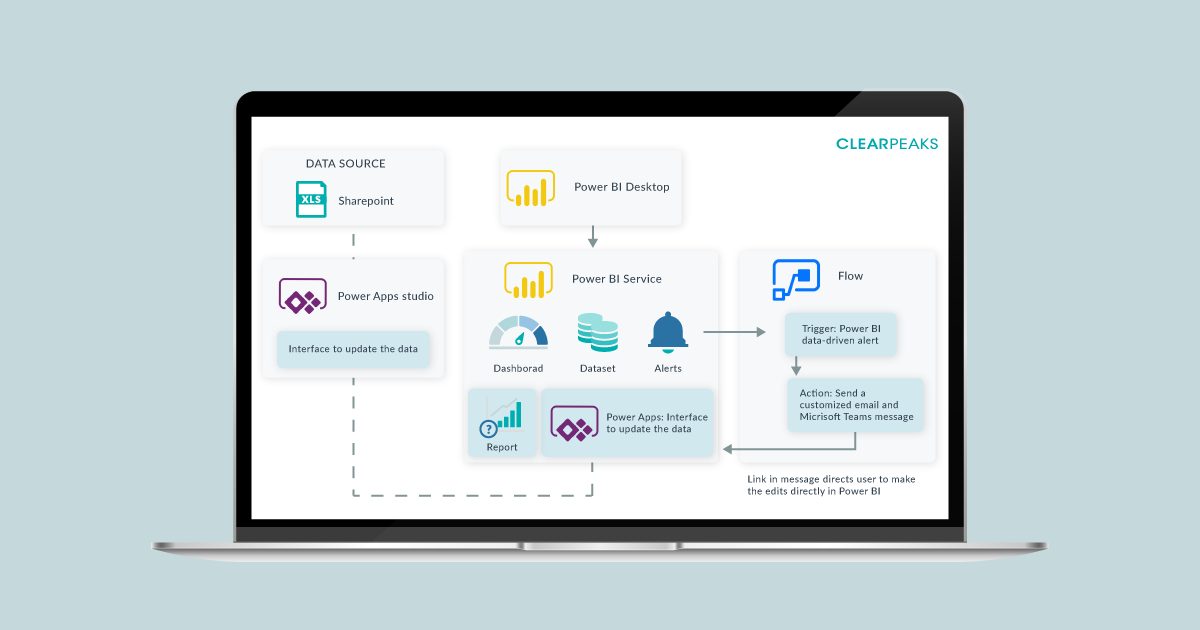
Figure 5: Workflow overview
The workflow, which is depicted in Figure 5, consists of the following steps:
- We create reports in Power BI with simple data visualizations.
- We publish the reports in Power BI Service. There we create a dashboard and configure alerts; an alert pops up every time there is a missing or rare value.
- When an alert is triggered, thanks to Power Automate, we notify the responsible person by sending a customized email. A Microsoft Teams message is also sent.
- The user is redirected to a Power BI report that contains an app from Power Apps where they can fix the wrong data value.
Diving into a bit more detail on each section, we need to perform the following steps in each of the services.
In Power BI Desktop, we need to connect to our data source, which is an Excel file in SharePoint, with the Get Data functionality and create the reports related to the COVID-19 data. In Figure 6, we can see the report created for Italy, where we show the total confirmed cases and the new cases per day. We can observe that in the bottom right graph, there is missing data for 25th May.
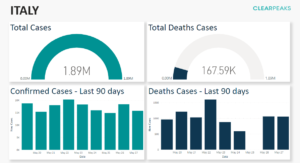
Figure 6: Example of Power BI report with COVID-19 related visuals for Italy
In Power BI Service, we create the alerts to identify when an issue exists. To do so, we build a dashboard with tiles (card visualizations) displaying the number of errors (missing data) for each country. Then alerts are set up on these tiles: when the value of the tile is above 0, an alert is fired (an email and a Microsoft Teams message are sent to the user as described below). The reason for creating multiple tiles/alerts (instead of a single tile/alert) is that the creation of alerts in Power BI does not support parametrization – in our case we needed to send alerts to a different user for each country, so we had to create a different tile for each country/user.
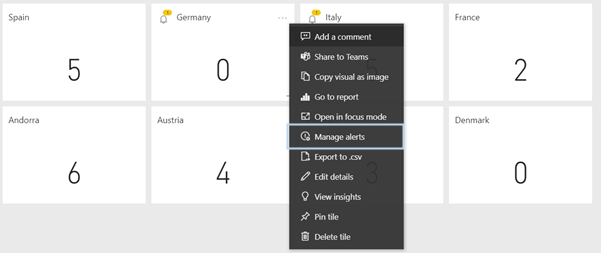
Figure 7: Managing alerts in card visualizations (showing the number of errors) in Power BI Service
In Power Automate, as it can be used with alerts in Power BI to trigger an action, we use a trigger to send a detailed message to the subject matter expert when the alert is fired. Every alert has an associated flow that performs two actions: send an email and also a message in Microsoft Teams.

Figure 8: Power Automate flow overview
Both the email and the Microsoft Teams message contain a link that redirects to a report like the one shown in Figure 9. This report contains a table showing the missing value rows of our data source (left) and a Power Apps visual (right).
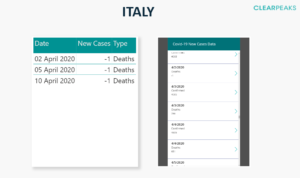
Figure 9: Example of Power BI report to modify the missing data for Italy. New Cases blank values are converted to -1 to avoid Power Apps visual to filter them
To implement the write-back functionality, we create a canvas app in Power Apps from a Power BI report. The app captures data from the Power BI report and creates a gallery out of it; at the same time, the app is connected to the same data source as the one feeding Power BI – we are going to use this to write the data.
The first screen shows the data captured from the report: the date, the case type and the number of new cases. When clicking on one of the arrows, we are redirected to an edit screen that is a window to the corresponding entry of the data source, filtered by the fields of the gallery screen. In each entry, we can change the data values for any day and save it. Changes will appear immediately in the data source.
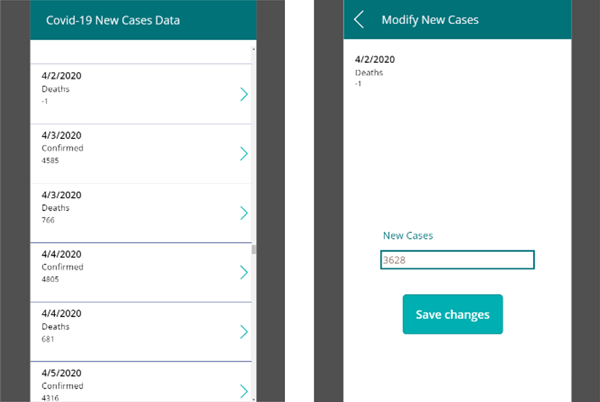
Figure 10: Power Apps app overview
If we go back to the report, we can check that the integration of apps in Power BI is interactive, so every time we select a row in the table of the report, this will filter the app gallery and just show the selected entry.
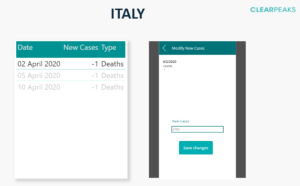
Figure 11: Power BI interaction with Power Apps
3. Challenges
As in any development, we faced a few challenges and limitations. One limitation that we met with is that the Power Apps visual cannot trigger refreshes on Power BI reports or datasets. The reason behind this is that the visual is read-only, meaning that we can read data from the report, but we cannot send it back.
Therefore, by default, when we fix an error using the write-back functionality, the new changes will be reflected in the Power BI reports only on the next scheduled refresh. In recent months, Microsoft has developed a new capability to solve this problem, but it only works with sources that are connected by DirectQuery; in our case we are not using DirectQuery since our source is an Excel in SharePoint. To address this limitation, we could refresh the Power BI dataset manually or alternatively, taking advantage of all the Power Platform services, create a flow in Power Automate; we did the latter. This flow can refresh the dataset in Power BI every time there is a modification in the database. In this way, though it will not be immediate, the changes will be reflected in the reports within a short time.
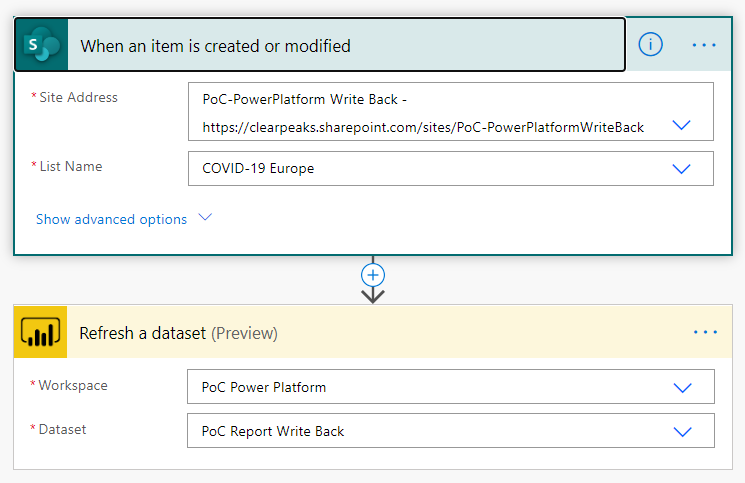
Figure 12: Refreshing Power BI dataset with Power Automate flow
Conclusions and future improvements
In this blog article we have integrated Power Apps and Power Automate in a Power BI report in order to provide write-back functionality into the source system directly from the Power BI interface. We have achieved this by setting up alerts in Power BI and using them to trigger a flow in Power Automate to notify the user whenever there is a missing value. Our solution includes an app from Power Apps inside the Power BI report, so that the user can modify the missing values with valid ones.
If you wish to obtain deeper insights into your business using Power Platform, don’t hesitate to contact us and we will be happy to advise you!