
21 Jan 2020 Power BI: Mapbox integration
Maps are becoming one of the most important and powerful data visualizations available to BI developers due to the ever-increasing amount of geospatial data being generated; tools like Mapbox, that let you create fully-customizable maps, are very useful.
In this article we will see what Mapbox for Power BI is capable of.
1. Mapbox
Mapbox is a mapping platform for business that provides tools to facilitate the development of location apps and visualizations. Mapbox for Power BI has a lot of interesting features, but in this article we are only going to focus on a few of them.
1.1. Data Clustering
Mapbox allows you to enhance your map visualizations with multiple data representations on the same map that change depending on the level of zoom. For instance, you can represent your data in clusters that transition to single points in your map as you zoom in. In the following videos you will see what this feature looks like using the data from the number of traffic accidents in Barcelona in a year; the size of the points depends on the number of accidents there.
Figure 1: Number of accidents in Barcelona
All the information represented on your map viz can be filtered as in native Power BI maps.
Figure 2: Filtering map data
1.2. Drill through map data
Another interesting feature of Mapbox for Power BI is the capability to drill through multiple levels on choropleth maps. We will be using the same data as in the last example to show you what this looks like: the height of the bar indicates the number of accidents.
Figure 3: Drilling through different levels of detail
1.3. Customizing maps in Mapbox
In order to develop even better visualizations, Mapbox offers a tool called Mapbox Studio that allows you to manage your geospatial data and design custom map styles and regions.
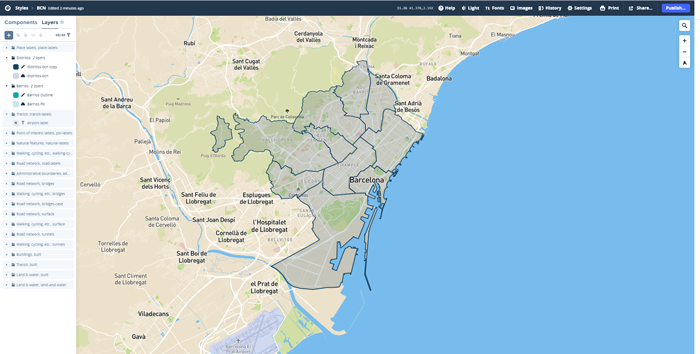
Figure 4: Customizing a map in Mapbox Studio
1.4. Configuring Mapbox in Power BI
To start using Mapbox in your Power BI reports, you only need to create a free account in www.mapbox.com then import the visualization from the marketplace.
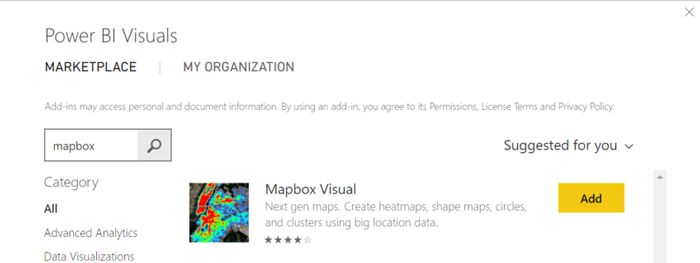
Figure 5: Importing Mapbox to Power BI
Once the visualization has been imported, you will have to add your API key to the viz settings and you will be ready to start designing your map visualizations.
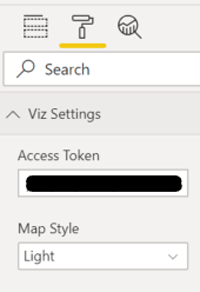
Figure 6: Configuring Mapbox
2. Mapbox visualization or Native map visualization?
Mapbox really shines when representing a lot of different information on a map, thanks to its drill through feature and cluster maps. If the data you are trying to represent does not have multiple levels of detail, you won’t be taking advantage of this powerful feature, so perhaps you should work with the default map visualization in these cases.
Moreover, if you are interested in representing a great volume of data points, maybe you could consider using Mapbox over the Power BI default map visualization.
Conclusion
Mapbox offers powerful visualization tools for Power BI that can help you improve your map visualizations.
If you are interested in creating map visualizations that satisfy your needs contact us, and we will give you a helping hand!