
08 Jul 2020 Power BI ChatBot
Across almost all sectors, voice is becoming the preferred way of interacting with technology; here at ClearPeaks we’re well aware of the need to stay on the ball, so when one of our clients wanted a new way to interact with their data – instead of clicking through the dashboard, they were looking for a more intuitive and natural solution – we were only too happy to jump on board.
In order to answer the client’s needs we were able to develop an application merging Power BI reports with a ChatBot, allowing for a new, conversational way of working with the dashboard, using either voice or written input.
1. The solution
The application was developed using the following technologies:
- Angular 9 and NodeJS: for front-end and back-end services
- Microsoft Power BI Embedded: to embed the reports
- Azure Cognitive Service LUIS: for natural language processing
- Azure Cognitive speech-to-text
- Microsoft Chatbot SDK
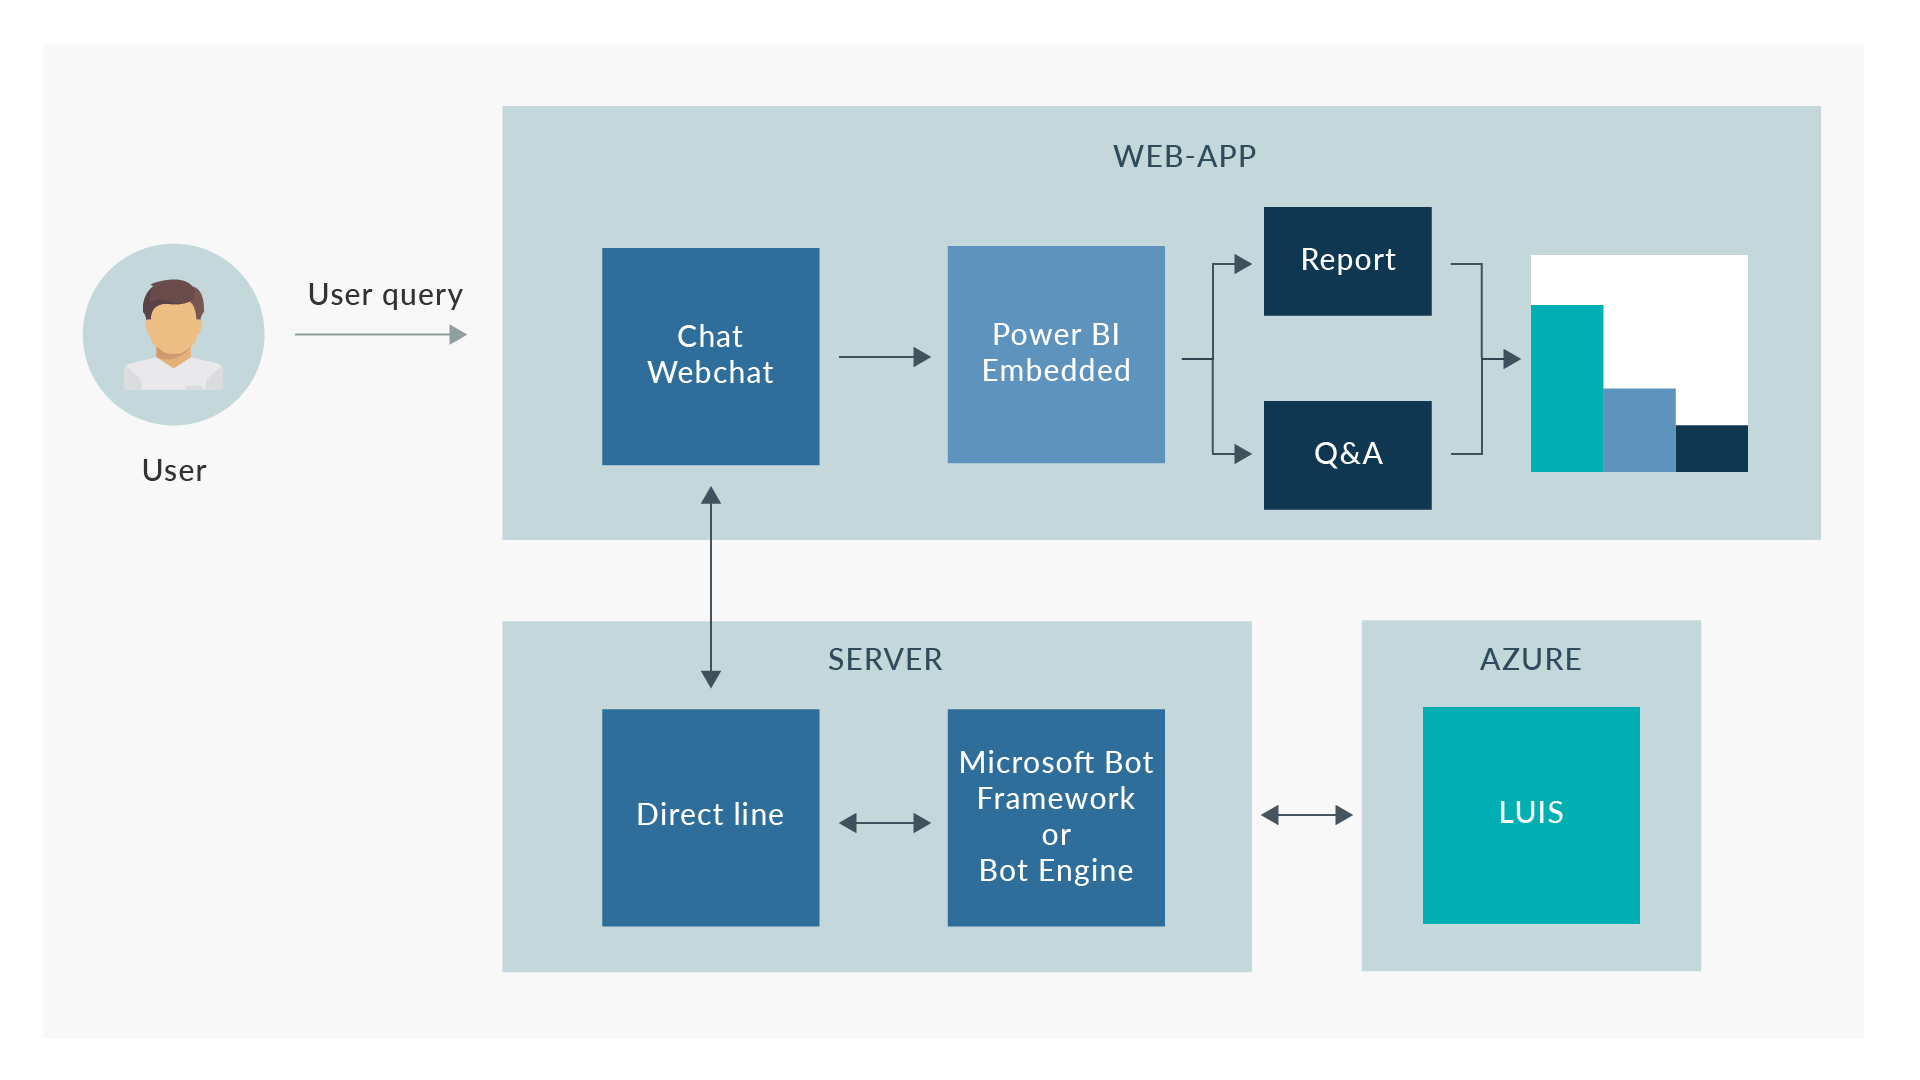
Figure 1: Architecture
A detailed explanation of the technical part is outside the scope of this article. But feel free to ping us for more information.
2. Report selection Panel

Figure 2: : The report selection screen
After opening the application, we can see all the reports available in the configured workspace (Fig. 2). Please note that this view is highly customizable and could be adapted to the customer’s needs, for example as an interactive report browser, or it could even offer an intelligent chat assistant at this early stage.
The report we are using for this article reflects the sales analysis of the products of airplanes and helicopters. In this case, we have two filters to analyze the data: year and product category of helicopters/airplanes.
3. The main panel
Figure 3: The main panel. Note that the communication with the ChatBot in this animation is by voice.
After selecting a report from the list, we can see the main panel with the chat panel on the left and the report on the right.
We can communicate with the ChatBot both by writing and by voice. Let’s imagine a simple scenario – we want to see the sales results for Trainer and Glider in 2017.
- First, we select the category: select Trainer
- Select Glider
- Select 2017
- Now we want to see only Glider: discard Trainer
And here we are (Fig. 4). Instead of an arduous process of clicking everything out, we can now achieve the same result in an intuitive, conversational way. To get back to the original report state, we simply need to say: remove all filters.
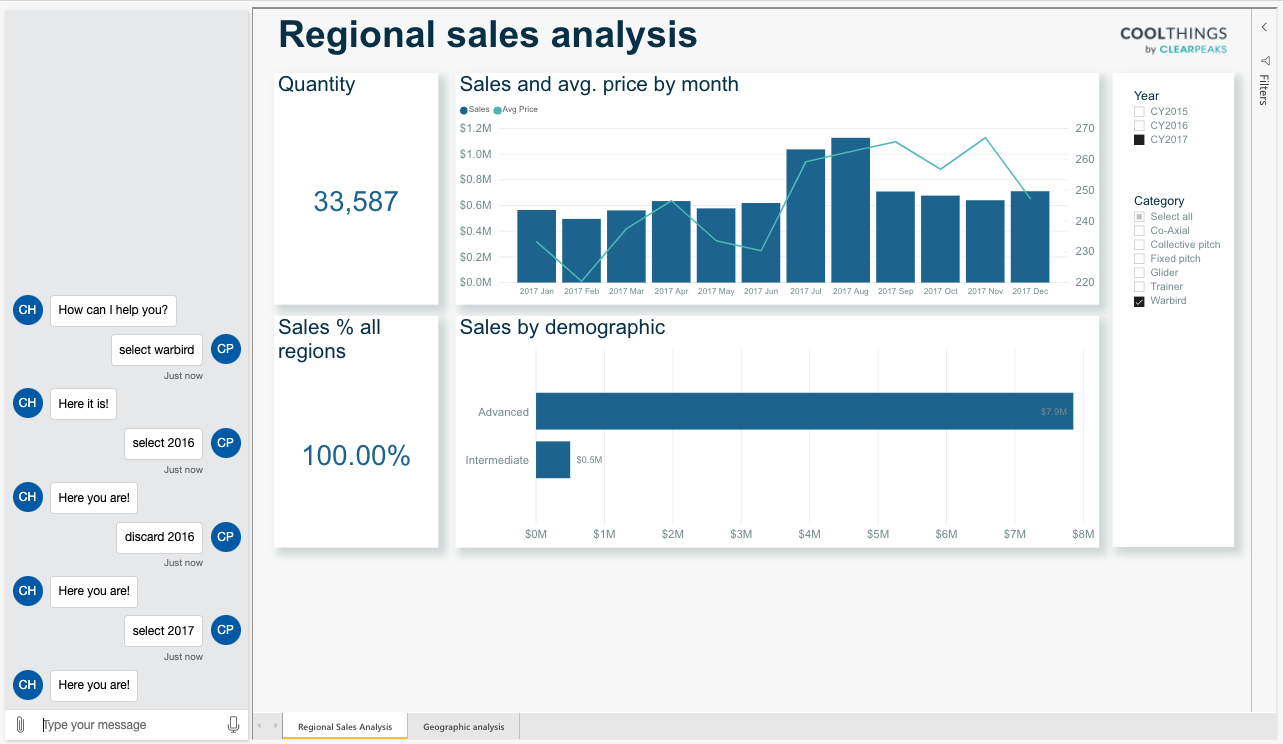
Figure 4: The main panel after filtering
4. Questions and Answers
Another powerful functionality that has been embedded into the application is the Power BI Q&A mechanism, allowing us to generate new visualisations on-the-fly.
For example, we could be interested in the median of sales by month in 2017.
We simply say: what are the average sales by quarter? and we are provided with a proper visualisation (Fig. 5). To see the report again we say: go back to the report and we see the main panel again.
Figure 5: Q&A visualisations.
Conclusion
We’ve created an innovative and intuitive solution using cutting-edge technologies to provide users with a powerful tool to work with their dashboard and data.
The functionalities shown make up only the most generic use case of the application, which by its design can be easily extended and customized to any user scenario.
If you have any questions contact us and we will be ready to help you. Stay tuned for future posts!