17 Aug 2023 Reporting Consolidation of Multiple Cloud Provider Costs
As regular users of cloud services, we are well aware of the need to keep track of our costs, especially for those services which we are still exploring, when we are not really sure of the cost until we get the bill! We´ve also got to keep an eye out for those plans where we pay a regular fee although we´re not actually using the service.
As all cloud providers offer cost management UIs with predefined visualisations, it is not difficult to get an overview of our cloud service costs. Nevertheless, we face some restrictions, such as time period limitations or the need to calculate our own KPIs based on our finance team´s requirements, as well as wanting to have access to all our different cloud providers´ cost data in a single pane.
In this article we are going to review the creation of a report where we can consolidate all our cloud provider cost data, in our case Azure and Amazon Web Services (AWS). After considering various approaches and the nature of our cloud subscriptions, we opted for the method detailed below.
Business Requirements
As ClearPeaks is both an AWS and an Azure partner, our subscriptions have some granted credits, so we are also interested in tracking the usage of these credits as well as standard costs billed in euros or dollars. As we will see, we can´t retrieve Azure credits since the Azure billing API does not allow this for our type of subscription.
We want to calculate cost and credit KPIs that can be aggregated on several dimensions: date, service, team, and project. In Azure we assign each project to a specific resource group, whereas in AWS we rely on tags, which assign metadata to the resource, indicating the project and the team using a specific cloud service. In Azure we also rely on tags to indicate the team that is using the service.
Solution Overview

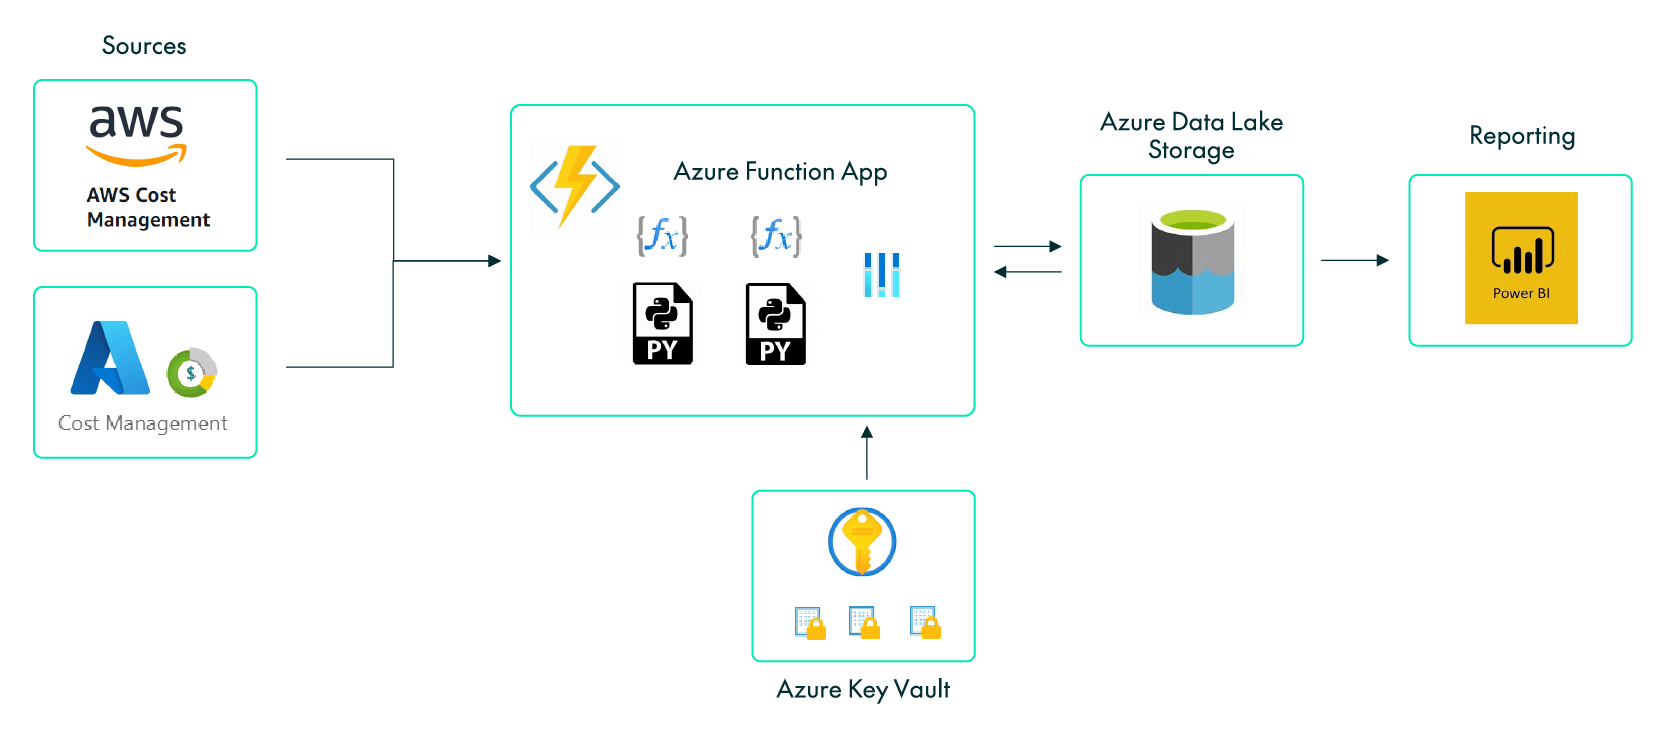
Figure 1: Solution Diagram
There are two data sources, AWS and Azure. Each of them has a dedicated Python script, executed serverlessly by an Azure Function App in charge of extracting the data. To secure the credentials of both clouds we store them in Azure Key Vault Secrets and read them from the Function App.
In order to retrieve the data, we use our cloud providers´ SDKs for Python, which provide object-oriented APIs, the Boto3 library from AWS and the azure-mgmt libraries from Azure.
The Function App is executed daily to retrieve the previous day´s data. We follow an incremental load approach that uses the date as an incremental pattern, and raw data is then stored in flat files in an Azure Data Lake Storage container.
Finally, we connect to these flat files from Power BI, where the data model is created, and the KPIs are calculated using DAX formulas and presented alongside some visuals in a report.
ETL Layer
To access Amazon Web Services data, you first need to get authenticated, which you can do by instancing a boto3.Session class, passing the access key ID and the secret access key as parameters.
Following security standards, no confidential information is embedded in the code. We use Azure Key Vault to store our credentials as secrets and access them from our Python code through environment variables in the Function App.
Once authenticated, we can access AWS Cost Explorer and retrieve the data we need. To reach our usage costs and credits, we will employ the get_cost_and_usage method, which accepts the following parameters: time period, data granularity, metric, which fields to group by (maximum of two) and a filter. The following code snippet is an example:
client = session.client(service_name=“ce”)

response = client.get_cost_and_usage(

TimePeriod = {‘Start’: ‘string’,
       	        ‘End’: ‘string’},
Granularity = ’DAILY’,
Metrics = ‘BlendedCost’,
Filter = {},
GroupBy = [{‘Type’: ‘DIMENSION’, ‘Key’: ‘SERVICE’},
	     {‘Type’: ‘TAG’, ‘Key’: ‘Project’}]
)
We can see that it is possible to group by dimensions or by tags; in our example we use the service dimension and the project tag. The previous query retrieves the cost data, and in order to get the credits data we need to indicate this in the filter parameter, as the following snippet shows:
Filter = {"Dimensions": {"Key": "RECORD_TYPE", "Values": ["Usage"]}}
The outcome of these API calls is our raw data, saved in CSV files in Azure Data Lake Storage.
In Azure, we use the azure-mgmt-costmanagement library to retrieve the cost; with the required permissions we can retrieve cost data instancing the CostManagementClient class and the query.usage method. The following snippet is an example:
response = CostManagementClient().query.usage(
scope = "subscription_id",
parameters = {
             "dataset": {
	         "aggregation": {"totalCost": {"function": "Sum",
                                             "name": "PreTaxCost"}},
	         "granularity": "Daily",
	         "grouping" [{"name": "ResourceGroup", "type": "Dimension"},
                           {"name": "ServiceName", "type": "Dimension"}]
                        },
             "timeframe": "Custom",
             "time_period": {"from_property": "", "to": ""},
             "type": "Usage"
			}
)
Since the grouping allows only two dimensions, and we have chosen service and resource group, we need to use the azure-mgmt-resource library to extract the team. This library can access the tags assigned to each resource group, one of them being the team tag.
Notice that on the call the subscription_id is specified. If you have multiple subscription_ids, you have to generate one call for each of them.
In Azure, the azure-mgmt-consumption library can be used to retrieve the credits consumed. Nevertheless, due to the type of our partner subscription, we cannot retrieve the credit usage.
We developed and tested our code in Visual Studio, since it has an Azure extension which allows you to test the code locally and deploy it to the Function App service. In this service we created one function for each cloud provider. Function execution is defined based on schedule, and at each execution, the function calls the cost APIs, retrieves the raw data and stores the response in CSV format in the Data Lake Storage service.
Visualisation Layer
Once the data has been stored in our Azure Data Lake Storage container, we configure the Power BI connector to access it. The Power BI dataset has a refresh schedule that runs once per day after the data in the data lake has been updated.
Next, we use Power BI to acquire and then combine all essential CSV files, thereby creating our data model. If other departments would also like to access the data, we suggest cataloguing the data with the Azure Data Catalog service.
Finally, we create our report, consisting of some KPIs and visualisations to keep track of our costs and credits consumption, providing an executive page with an overview of both clouds, as well as a single page for each.
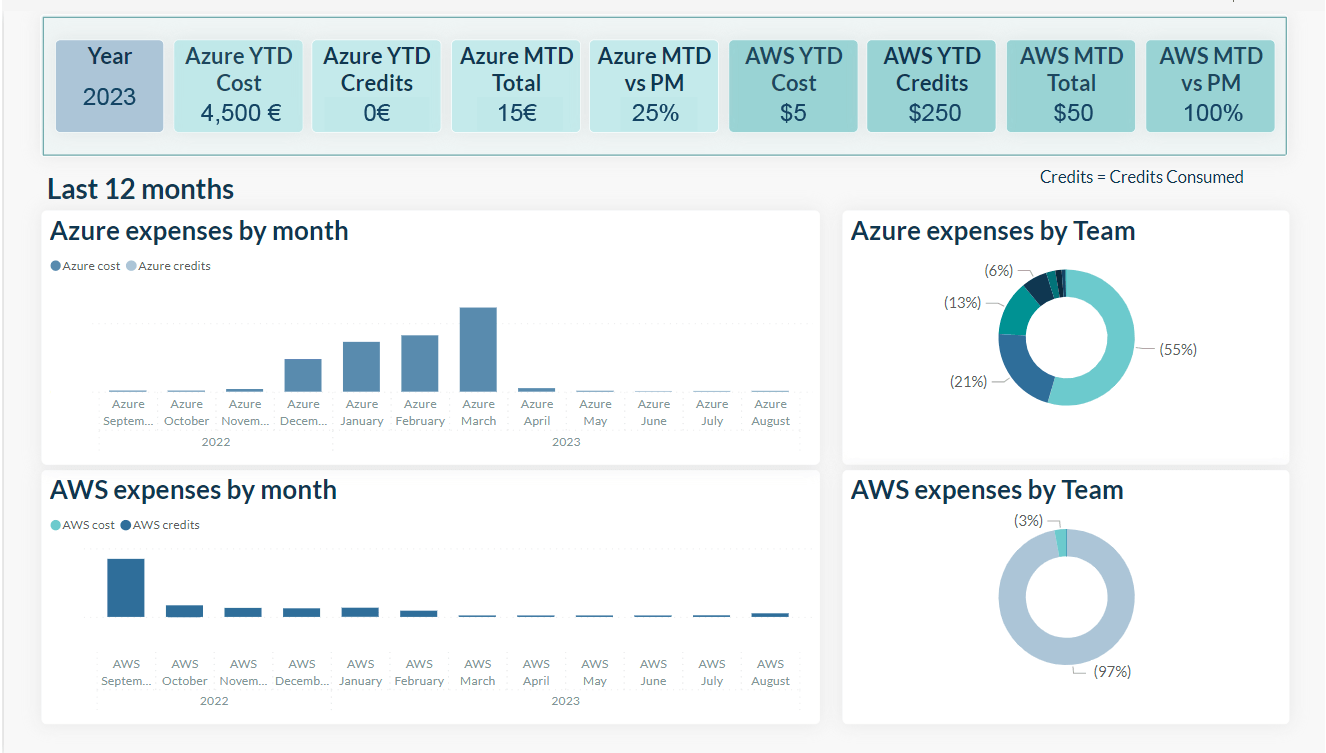
In the executive page (Figure 2) we can see the Year to Date (YTD) and Month to Date (MTD) cost and credit consumption KPIs, broken down by cloud provider. We have also incorporated a clustered stacked column chart presenting the cost breakdown over the last twelve months, as well as a donut chart of costs by team.
In the cloud providers’ individual pages we show the YTD and MTD cost KPIs, as well as a cost and credit consumption stacked column chart. Moreover, it is possible to filter this chart by date, service, team, project or subscription (for Azure), and to choose the data granularity (day, month, quarter, year) to be shown in the chart too.

Figure 2: Power BI report page
Conclusion
In this article we have presented a simple, low-cost solution to consolidate several cloud providers´ costs into a single report. An overview of our cloud costs can be obtained by browsing the cloud providers cost management pages, but if we want a more customised and in-depth tracking of those costs and credits, the optimal approach is to consolidate all our different clouds providers´ cost data in a single pane.
If you have any questions about what you’ve read, or about Azure services, Power BI or Power Automate in general, don’t hesitate to get in touch with our team of certified, experienced professionals! They´ll be happy to help!


