13 Sep 2023 Revolutionising Data Management: Create Your All-in-one Analytics & BI Portal with Observation Deck
The Challenge Of Scattered Data
In today´s complex digital landscape, businesses often face the challenge of managing reports and analytics from many different places. This fragmentation leads to inefficiency, delayed decision-making, and missed opportunities.
Observation Deck: Your Unified Analytics & BI Portal
In response to customer feedback revealing this to be a widespread problem, our team at ClearPeaks has created Observation Deck, a centralised solution that will revolutionise the way you manage your data and reports. It unifies all your information in one place, transforming disperse insights into a comprehensive view of your business’s performance.
Unique Features of Observation Deck
Observation Deck is more than just another BI portal – it’s a comprehensive platform tailored to the modern business’s data needs. Here’s what sets it apart from the rest:
- User-friendly Interface: From effortlessly creating your personalised BI portal to smoothly navigating through your dashboards, everything about Observation Deck has been developed with simplicity and efficiency in mind.
- Advanced Role-based Access Security: Observation Deck not only offers robust access controls, but it also leverages the trusted security features of Power BI, ensuring your data remains protected at all times.
- KPI Hub Functionality: With Observation Deck, you can bring your vital metrics into focus and get a clear and concise snapshot of your business’s performance.
- Collaborative Sharing Options: Through the smart integration of Outlook and Teams, you can easily share key insights with your team via the application.
- OpenAI Integration: Observation Deck puts the power of AI at your fingertips in a secure way with the Azure Open AI Service. With this, you can empower your insights with an advanced AI-driven chatbot.
Power BI Integration: A Single Hub for all Your Power BI Reports
What sets Observation Deck apart is its seamless, focused integration with Power BI, the data visualisation software from Microsoft. Observation Deck centralises all your Power BI reports, creating a single hub that not only enhances data visualisation but also simplifies Power BI report management.
Observation Deck leverages the capabilities of embedded analytics in Power BI, allowing their dashboards to be directly incorporated into its interface. This seamless integration provides users with immediate access to essential data without having to switch between platforms or workspaces.
What’s more, it works as a Power BI portal without sacrificing the tool´s impressive features, like row-level security, interactive visualisations, data integration, real-time dashboards, and so on.
Customise Your Analytics Portal for an Intuitive Experience
Observation Deck is not just about consolidation, it’s about personalisation too. You can tailor your analytics / Power BI portal to suit your specific needs, in perfect alignment with your organisation’s objectives.
From changing the entire theme to match your brand identity to personalising your own dashboard layout, Observation Deck offers extensive customisation options to guarantee a unique experience. You can create appealing landing pages with the elements you want, ensuring that stakeholders can easily access the information they need, making data exploration a productive and enjoyable experience.
Quick and Easy Setup: Building Your Analytics Portal with Observation Deck
Setting up your all-in-one analytics portal is so easy with Observation Deck! You can get it all up and running in just a few minutes thanks to its user-friendly configuration panel. The step-by-step process is intuitive and efficient, transforming the often-complex configuration of an analytics portal into a straightforward task.
The cool thing about the configuration panel is its versatility, allowing you to add text, KPIs, charts, and even images! Users can craft their own unique experiences depending on their requirements: for example, some users may want to see numbers on the landing page, others may prefer links to different dashboards, and some may even opt for a combination of both.
With Observation Deck, the sky´s the limit – just play with the different tiles and sections until you get the results you want!
Ready to see what you can personalise? Here are some examples of the customisation options in Observation Deck:
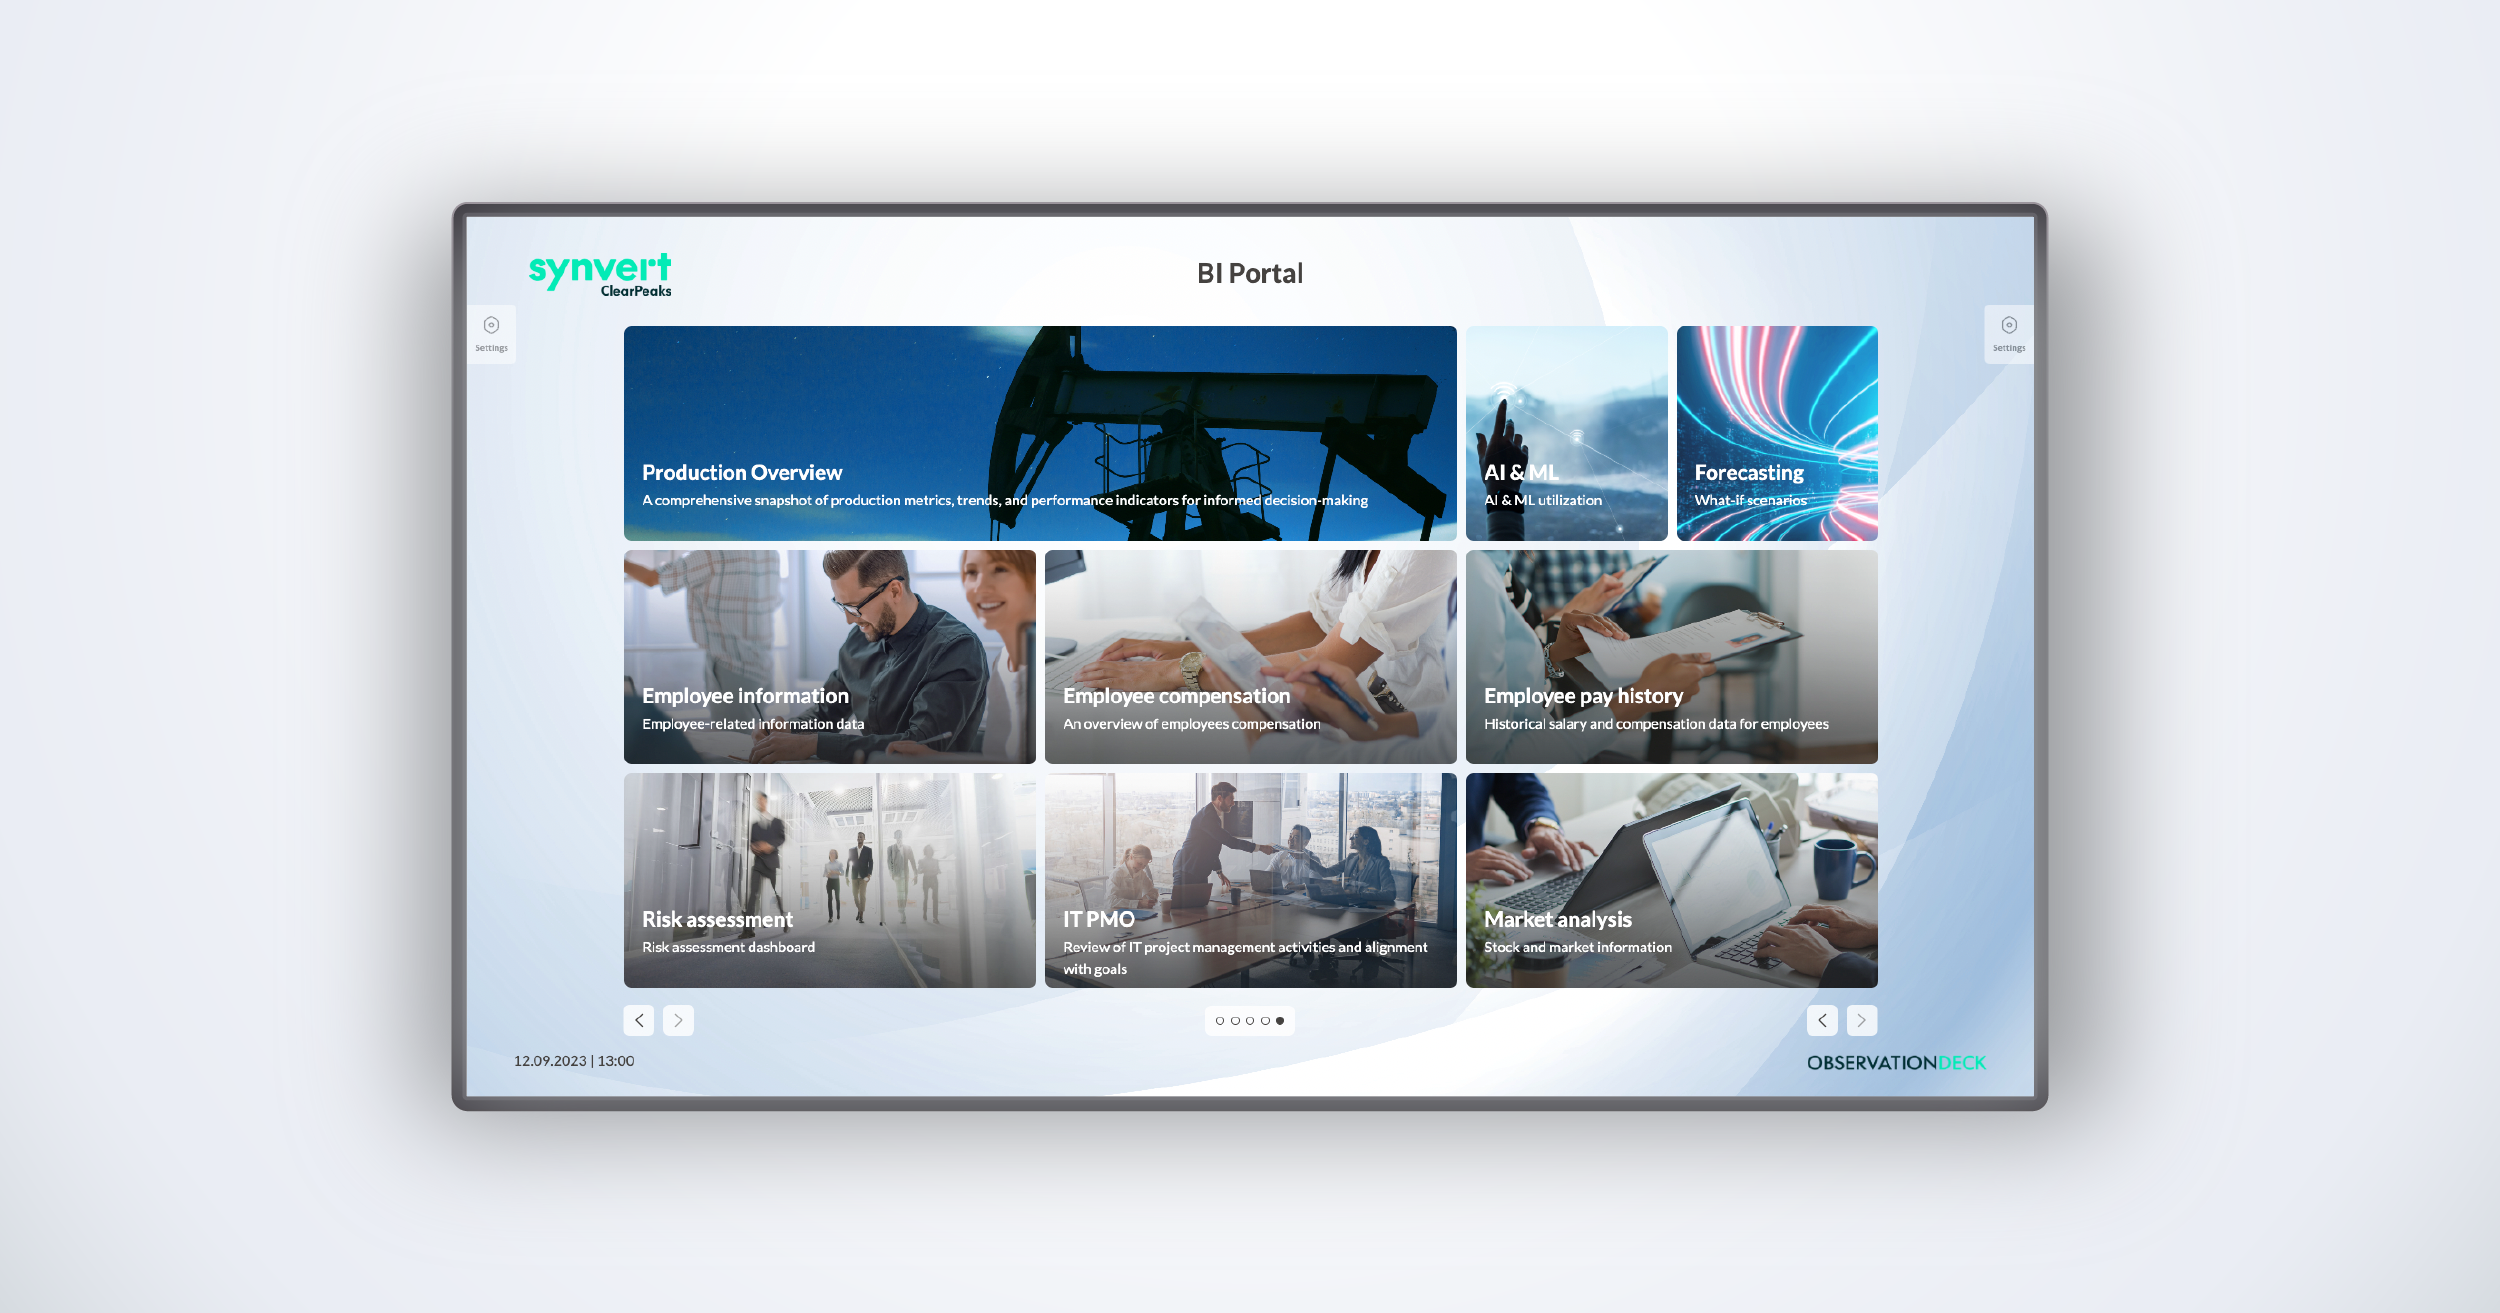
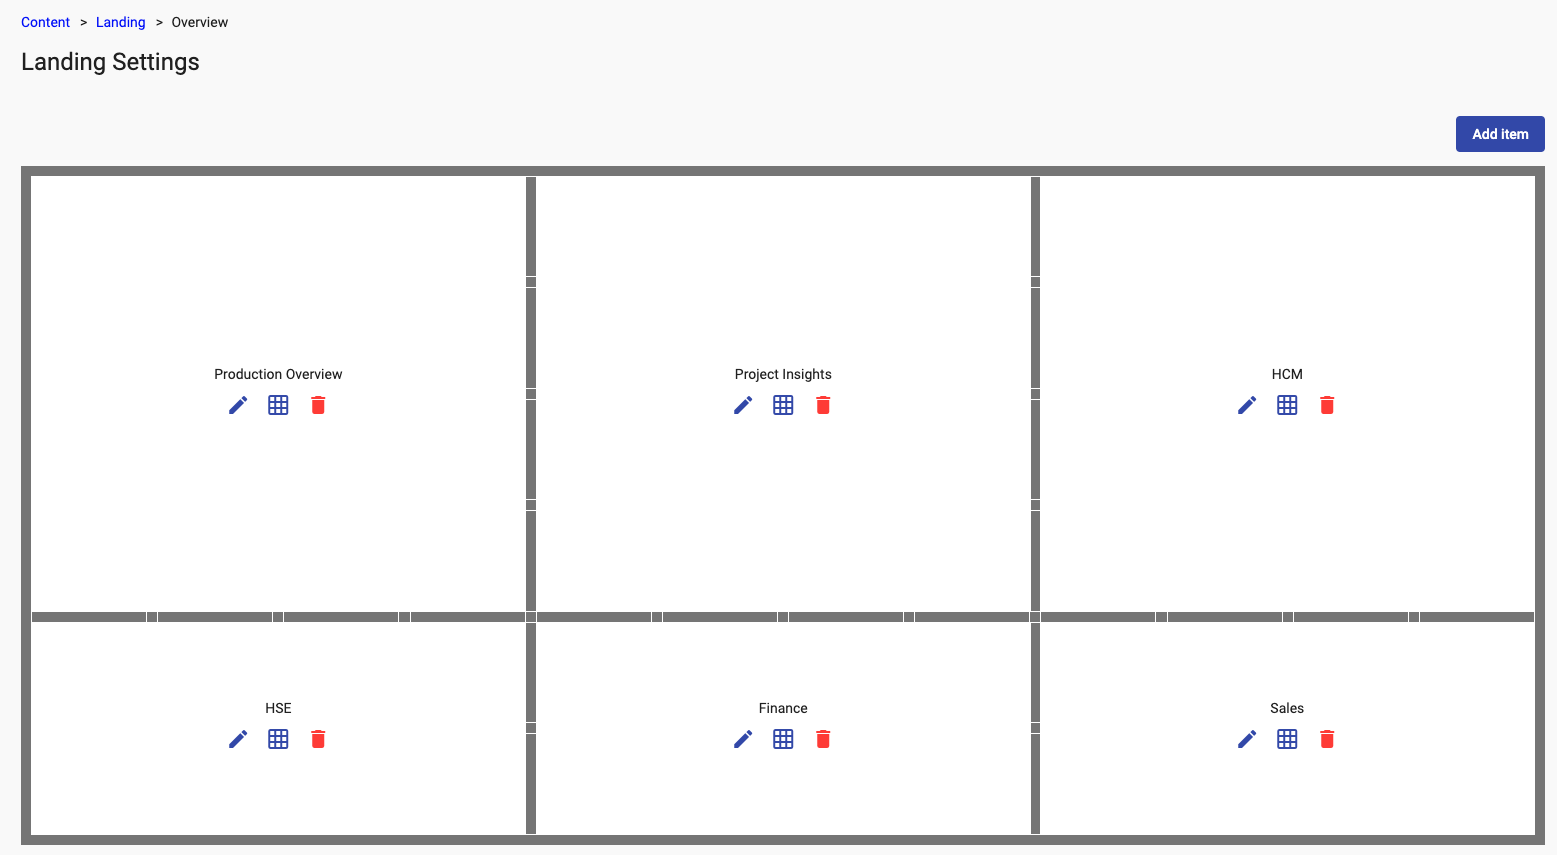
Example 1: Create a Landing Page (Portal-oriented or KPI-oriented)
Configuration Panel
Users need to create different tiles and adjust their sizes as desired to create a comprehensive landing page. Each tile can have its own background and contain unique content, such as text, KPIs, charts, or embedded Power BI, so users can create different experiences depending on their needs.
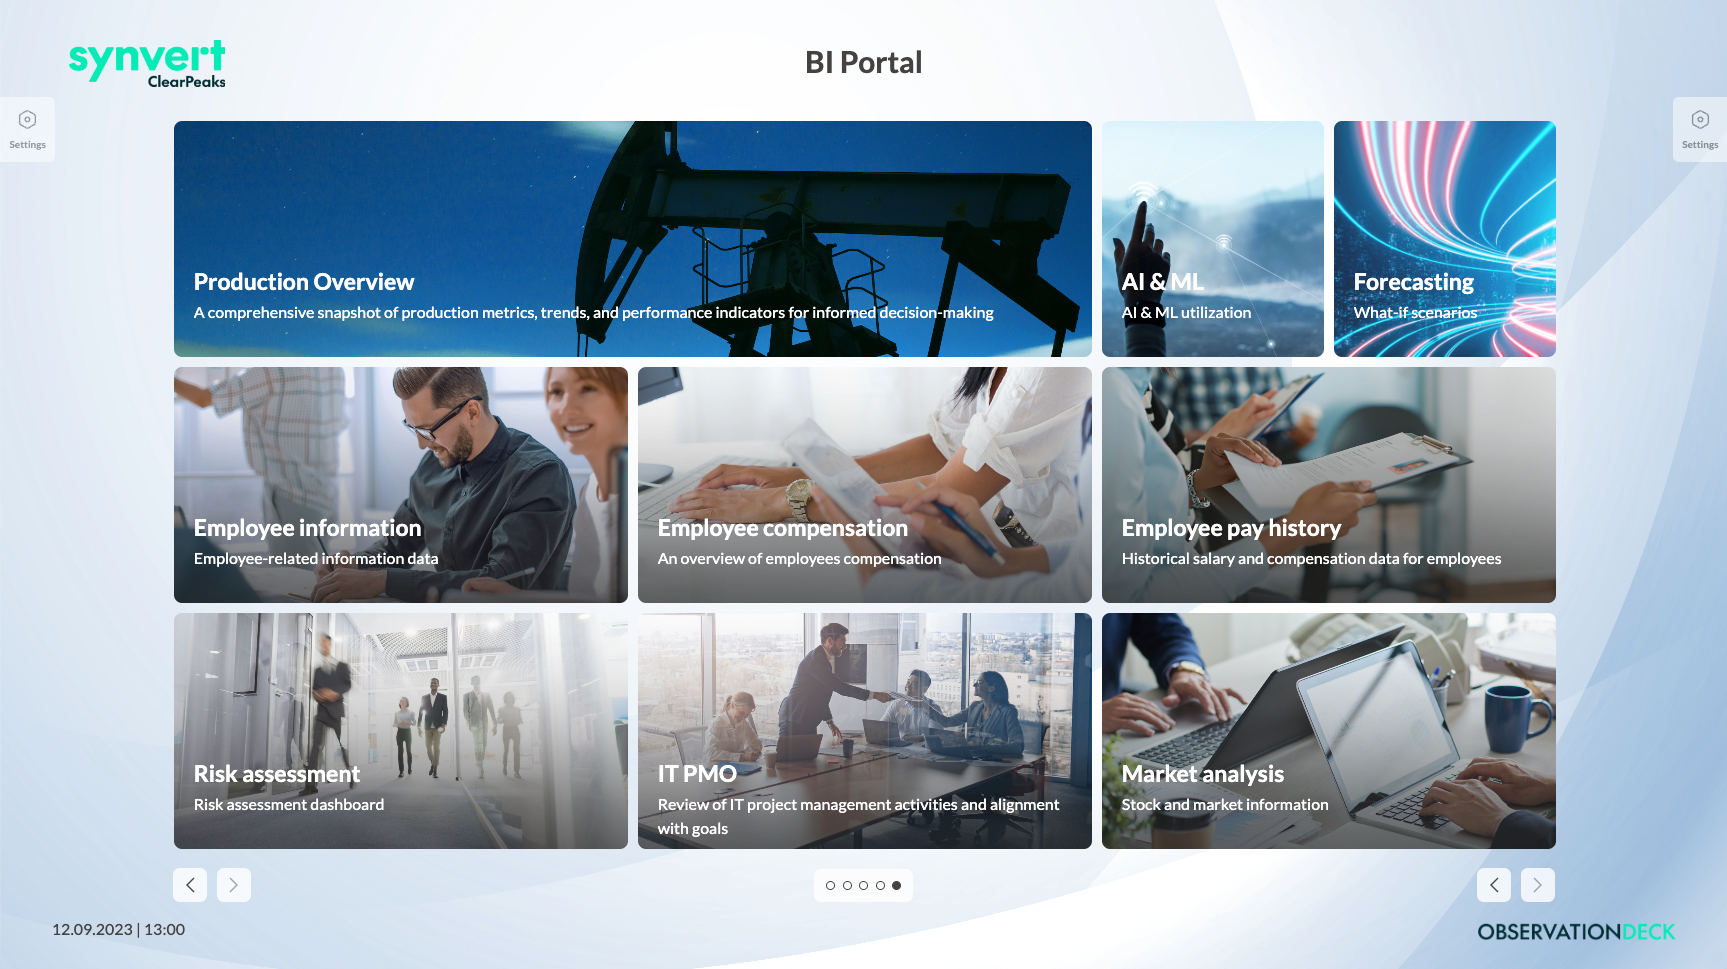
Results
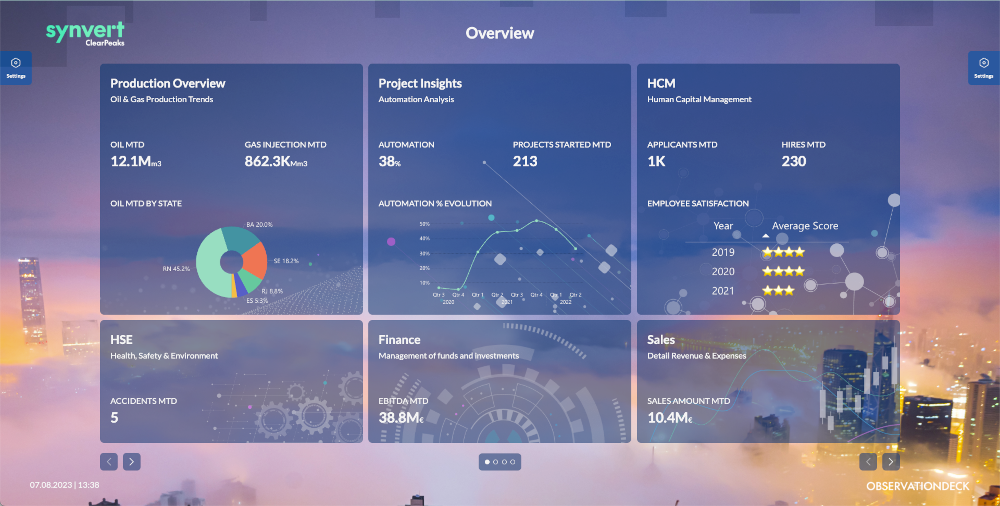
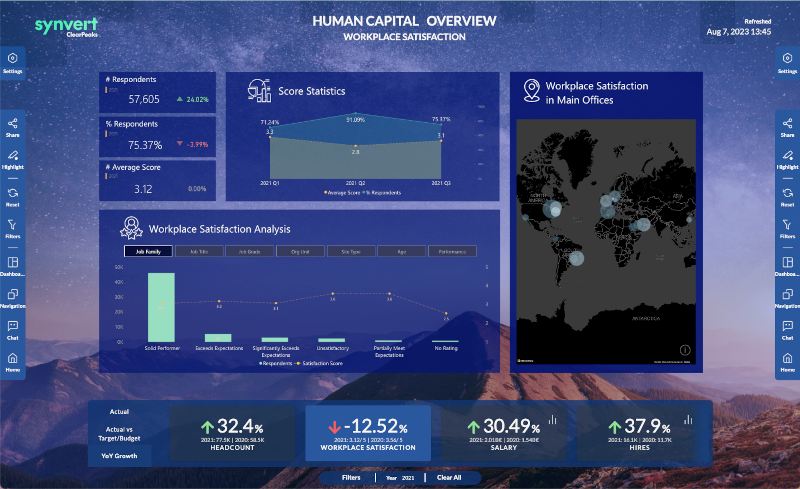
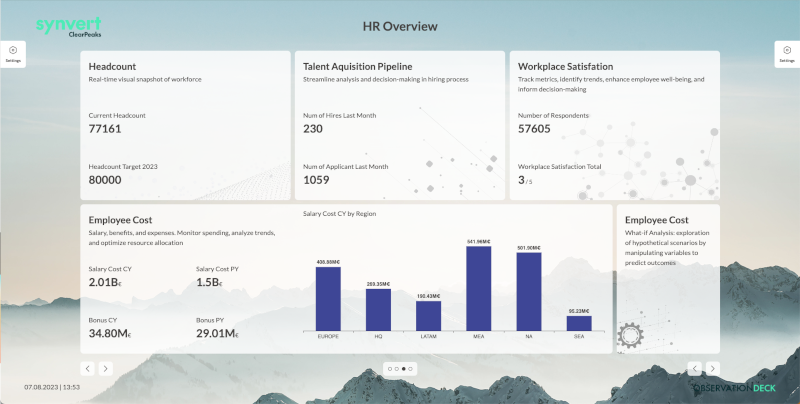
BI Portal Landing Page
BI Portal KPI-oriented Landing Page
Example 2: Embed a Power BI Report into a Landing Page
Configuration Panel
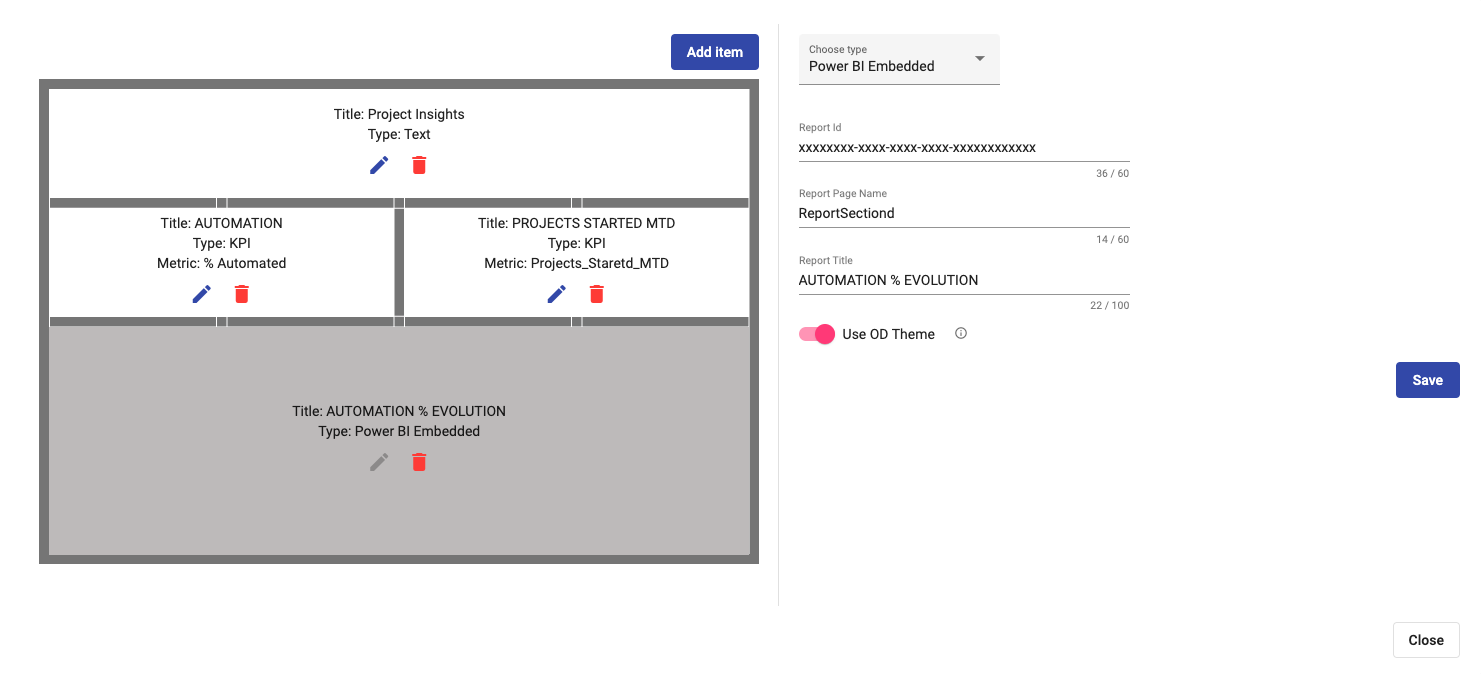
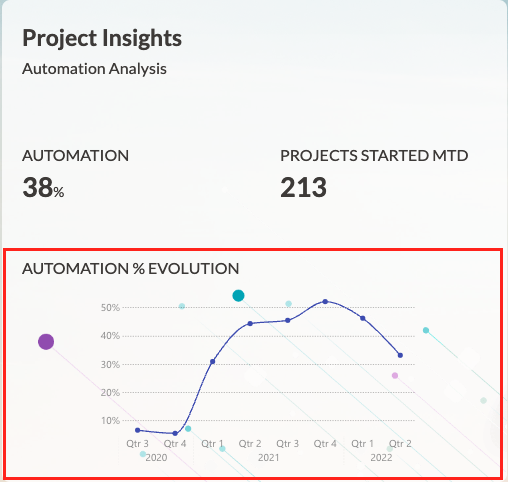
Result (marked in red)
Example 3: Embed a Complete Power BI Report (in less than 10 seconds!)
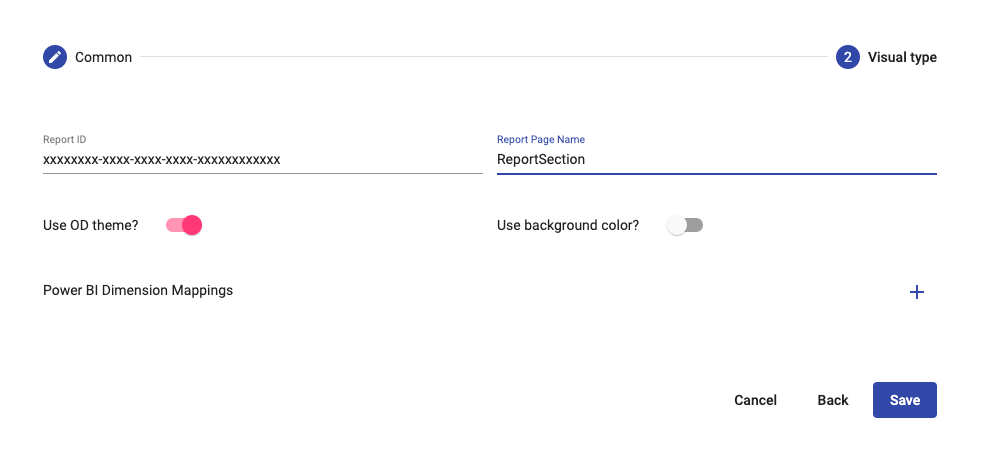
Configuration Panel
Result (Power BI in the middle of the screen)
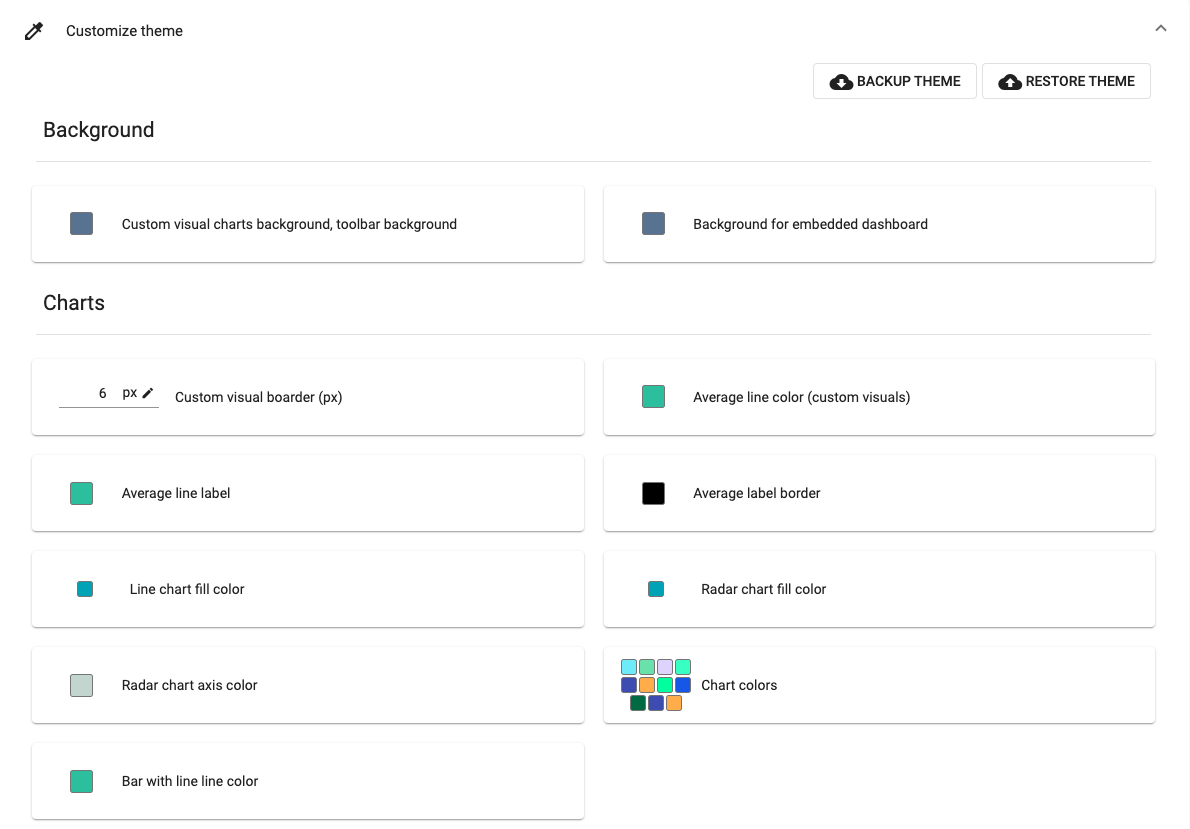
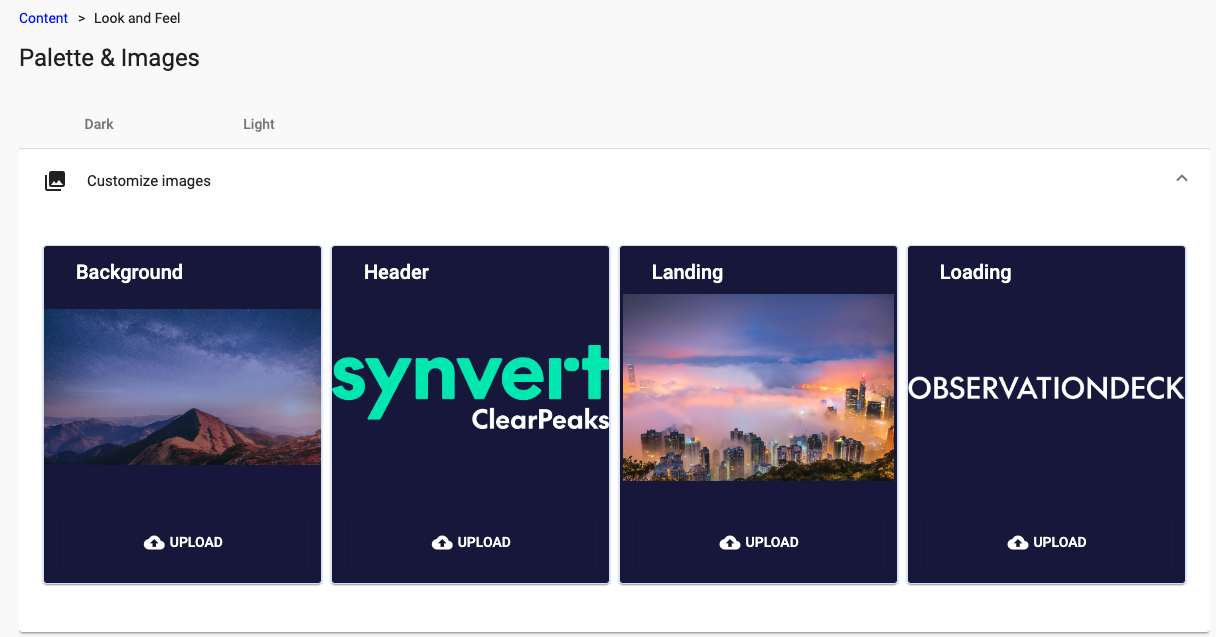
Example 4: Configure Application Theming
The theme can be fully customised, from the images to the colours seen in the app; the palette and pictures can be changed from the light and dark theme configuration options.
Configuration Panel
Result
Dark Theme:
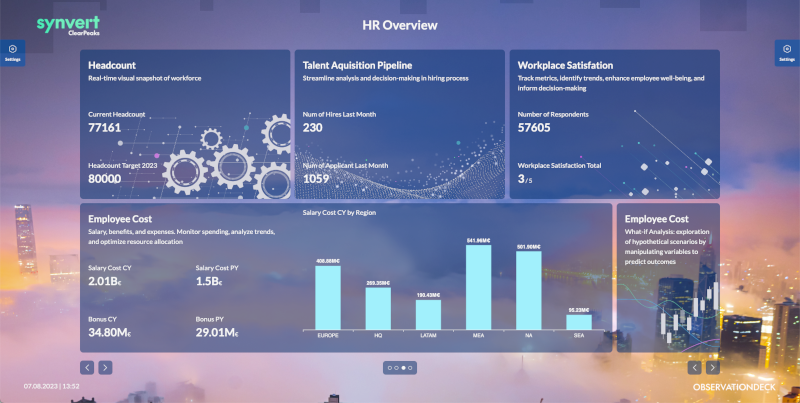
Light Theme:
As you can see in the above examples, creating an attractive, customised experience is just a matter of minutes in Observation Deck. Don´t miss the chance to try it!
Real-life Success with Observation Deck
We have been deploying Observation Deck across our prominent customers worldwide in multiple industries such as Oil & Gas, Manufacturing etc. and they are already seeing the benefits to be gained by adopting Observation Deck as their analytics and BI portal. The use of this powerful tool has led to smarter, more collaborative decision-making and enhanced business growth.
Experience the Power of Observation Deck
Does your team manage numerous reports across different platforms or workspaces? Observation Deck is here to transform your Power BI analytics workflow: with its centralised, fully customisable hub and Power BI integration, Observation Deck is the BI-centred solution you’ve been looking for.
We can help you unlock the potential of your data with Observation Deck! Read more on our website to see how this unified analytics & BI portal can transform the way you interact with your data; you can also find it in the Microsoft Marketplace.
Our team of experts would also be very happy to show you Observation Deck in a personalised demo and answer any questions you may have – simply drop us a line and we will be happy to help!