05 May 2021 Sentiment Analysis in Power BI
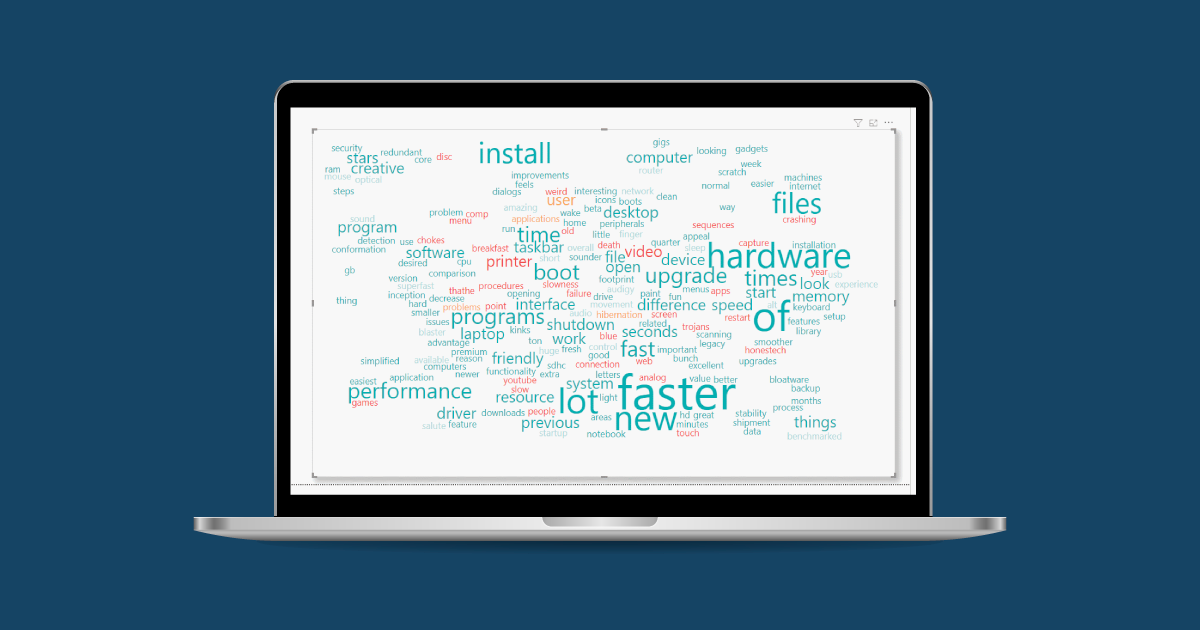
Word clouds are a good visual representation of text data, with which you can see the key themes or topics in a single view. They are used to visualise the frequency of relevant words within documents or a set of comments.
But they do not explain the intention of these words – an important aspect to consider when analysing data such as product reviews, customer emails, public responses, online opinions or reactions, etc.
One way of taking a word cloud to the next level is by previously applying sentiment analysis to the relevant text(s). But what does this analysis consist of? As the name suggests, it analyses a text and interprets the sentiments behind it, evaluating language and quantifying attitudes, opinions, and emotions related to a topic.
In this article, we show you how to integrate Text Analytics API into Power BI to create a sentiment-analysed word cloud. We will build this visual step by step in Power BI, connecting to the API.
1. Introducing Cognitive Services
We are going to use the Microsoft Text Analytics API, which classifies statements as positive, negative, and neutral. Microsoft Cognitive Services offers a free trial. We just need an Azure account, and can find the API in the portal.
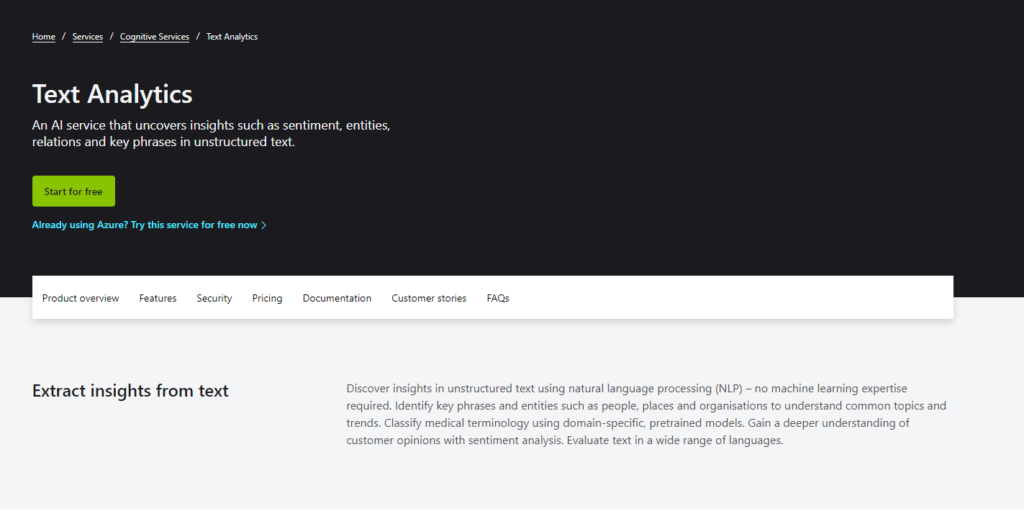
Figure 1: Text Analytics API
We can start for free and follow an easy signup process to get the access key we will need soon.
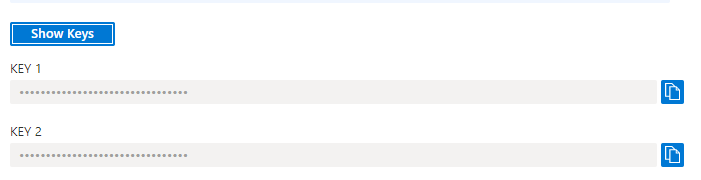
Figure 2: API key
2. Preparing the Data in Power BI
In this example, we perform sentiment analysis on a data set of one hundred reviews of a certain product. This data sample is from a data repository.
To get started, we first load the data into Power BI, verifying that it has correctly detected the character set, delimiters, header rows, and column types. We can clean the data too, lowercasing the text for a better design, deleting blank entries, and trimming blank spaces.
We must consider that this API only accepts 1,000 entries per request. We may also need to transform the data before it is ready to be processed. The API requires two fields for each document being processed.
- ID: A unique identifier for each entry within the request.
- Text: The text to be processed. It is required to be no longer than 5,120 characters.
3. Writing a Custom Function
Now, we must create the function that integrates Power BI and Text Analytics. We use two functions that receive text to be processed as a parameter. We have a response for each entry in the data set. The first function returns a list that contains the extracted key phrases. The other one returns three values, one for the positive sentiment, the second for the negative, and the last for the neutral sentiment. These three records add up to 1 and the bigger they are, the more they represent the sentence.
In order to create the function, we must open the Query Editor View and select:
New Source > Blank Query
Right click on the new query and open an Advanced Editor window. Delete the code that is already in that window and paste in the following code.
(text) => let
apikey = “YOUR_API_KEY “,
endpoint = “https://YOUR_CUSTOM_SUBDOMAIN.cognitiveservices.azure.com” & “/text/analytics/v3.0/keyPhrases”,
jsontext = Text.FromBinary(Json.FromValue(Text.Start(Text.Trim(text), 5000))),
jsonbody = “{ documents: [ { language: “”en””, id: “”0″”, text: ” & jsontext & ” } ] }”,
bytesbody = Text.ToBinary(jsonbody),
headers = [#”Ocp-Apim-Subscription-Key” = apikey],
bytesresp = Web.Contents(endpoint, [Headers=headers, Content=bytesbody]),
jsonresp = Json.Document(bytesresp),
keyphrases = jsonresp[documents]{0}[keyPhrases]
in keyphrases
Replace YOUR_API_KEY with the Text Analytics access key and YOUR_CUSTOM_SUBDOMAIN. Be sure to leave the quotation marks before and after the key. Then click Done. We can rename this query to KeyPhrases.
We then perform the same steps for the Sentiment function:
(text) => let
apikey = “YOUR_API_KEY “,
endpoint = “https://YOUR_CUSTOM_SUBDOMAIN.cognitiveservices.azure.com” & “/text/analytics/v3.0/sentiment”,
jsontext = Text.FromBinary(Json.FromValue(Text.Start(Text.Trim(text), 5000))),
jsonbody = “{ documents: [ { language: “”en””, id: “”0″”, text: ” & jsontext & ” } ] }”,
bytesbody = Text.ToBinary(jsonbody),
headers = [#”Ocp-Apim-Subscription-Key” = apikey],
bytesresp = Web.Contents(endpoint, [Headers=headers, Content=bytesbody]),
jsonresp = Json.Document(bytesresp),
sentiment = jsonresp[documents]{0}[detectedLanguage][confidenceScore] in sentiment
4. Using the Function
Once we have the data and the functions prepared, we continue to applying it. In the Power Query Editor, we select:
Add Column > Invoke Custom Function
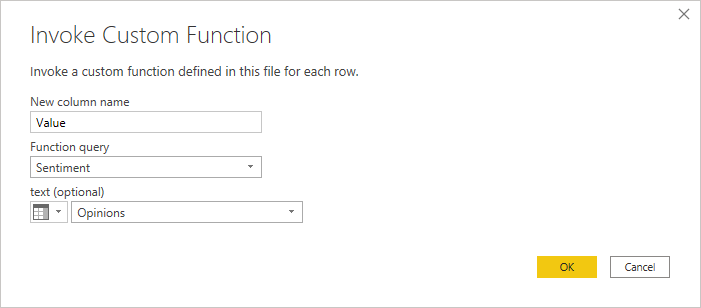
Figure 3: Invoking custom function
Now you may need to specify authentication and privacy settings. Make sure you use anonymous access. As you are using an access key, you do not need to provide any credentials.
You may also need to provide information about the privacy of your data.
This will create a column with the response from the Text Analytics API. Power BI calls the custom function once for each row in the table. We call both KeyPhrases and Sentiment functions.
4.1. Transforming Data
After calling the two functions, we can expand both columns.
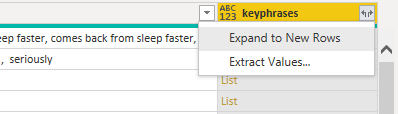
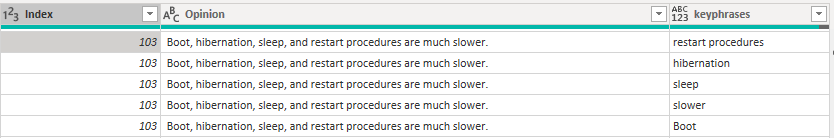
Figure 4: Expanding KeyPhrases results
We must expand the KeyPhrases column to new rows in order to obtain one entry per word. Then expand the three sentiment columns to get these values for each word.
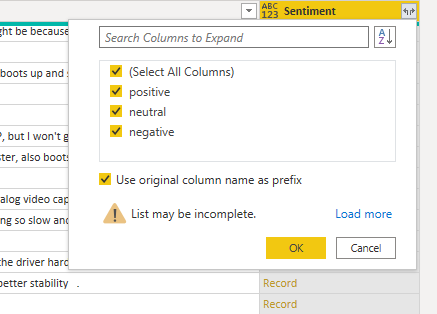
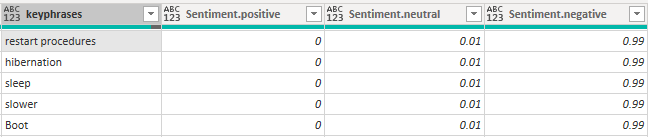
Figure 5: Expanding Sentiment results
So now, we know with which intention the user wrote these words. Maybe “slower” could be interpreted as positive in another context, but in this example, it is clearly negative. Note that all the key phrases coming from the same sentence have the same sentiment, as they are in the same context.
Now, we can proceed with the analysis. In our case, we want a single sentiment value for each word. So, we can combine the positive and negative proportion to get a rating from -1 to 1. The more positive the number, the better the comment, and the more negative, the worse.
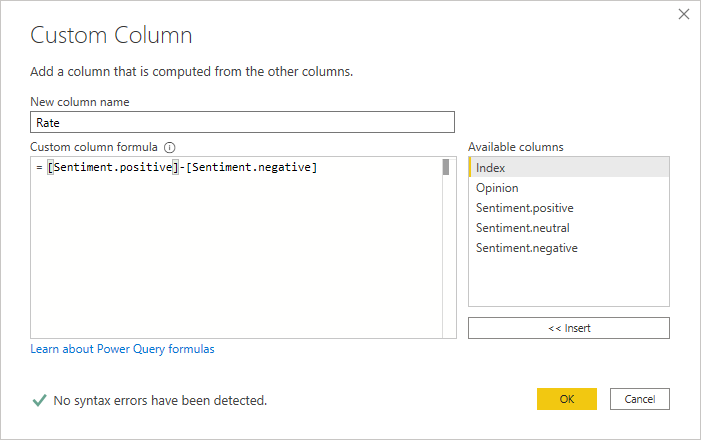
Figure 6: Creating custom column
4.2. Grouping Words
We can classify our words in as many categories as we want. For instance, we can consider the following:
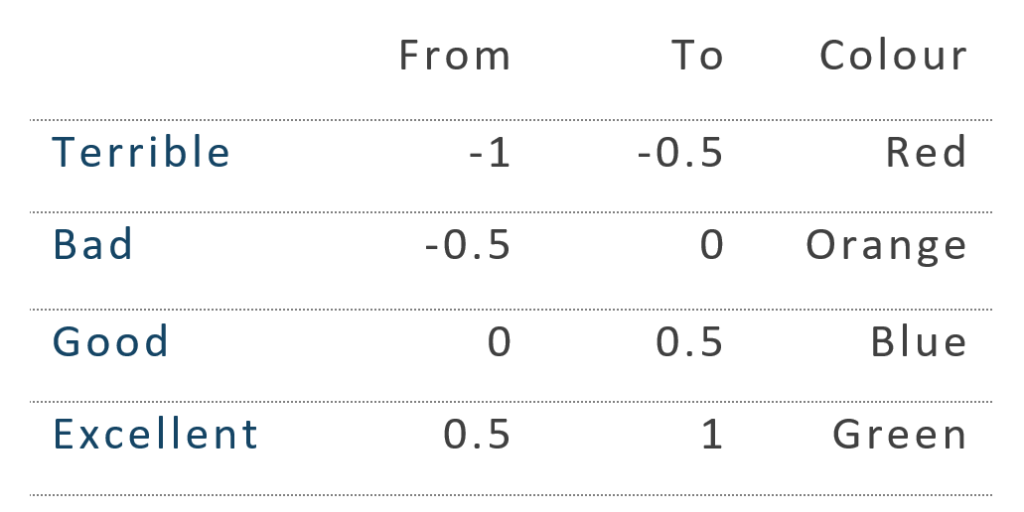
Figure 7: Data classification
To do so, we first must consider the words than could be repeated in various sentences, because we do not want the same word in different categories.
We add a step on Applied Steps that will group the rows by words, calculate the average of the rates, and create an additional column with the corresponding word repeated as many times as it appears. This last column will allow us to determine the frequency of each word for the word cloud.
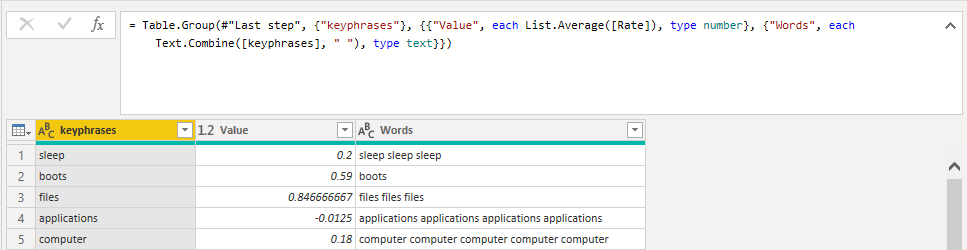
Figure 8: Group by words
We finally determine the category each word belongs to and create groupings based on it.
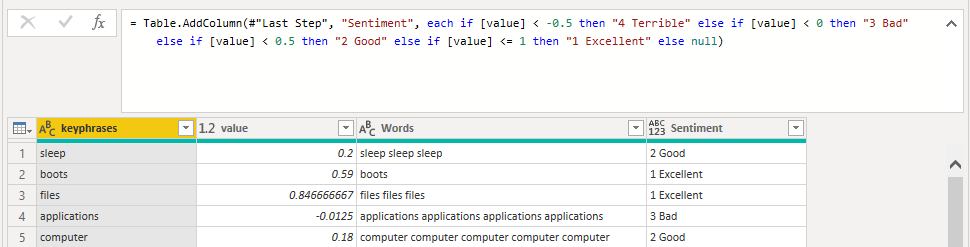
Figure 9: Group by categoriesp
So now we have the four categories we have determined, with all the associated words. The point is that in each category, we can have the same word repeated, to obtain its frequency for the word cloud.
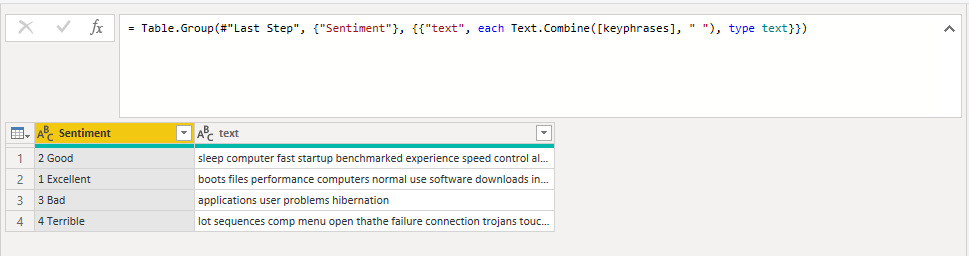
Figure 10: Categories
5. Creating the Word Cloud
Now we can let Power BI do the rest. We first search for the Word Cloud visualisation.
Visualizations > Get more visuals > Word Cloud
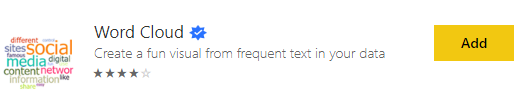
Figure 11: Word Cloud Visual
We can then just drag the column text to the visual and change the colours of each category.
Figure 12: Bulding the Word Cloud
5.1. Avoiding Stop Words
We also have the possibility to do a better cleaning of the data. We have previously selected the most important words, but maybe some empty words remain. They are called “Stop Words”.
These are a set of commonly used words in a language like “a”, “the”, “is”, “are”, etc., which do not add much meaning to a sentence. They can safely be ignored without sacrificing the meaning of the sentence.
We can remove them by just switching on the Stop Words button.
Additionally, there is the possibility to specify some terms to be ignored. Perhaps we do not want to show proper nouns, brand names, or specific expressions.
Figure 13: Eliminating stop and specific words
In the above example, we can see how “of” is removed, which is an instance of Stop Words, and also “install”.
Now we can see that the good comments are more relevant, as there are more words, and their frequency is higher. With this single view, we can know what the positive qualities of this product are, and also the qualities that users consider negative.
Conclusion
Word cloud visualisations and sentiment analysis work perfectly together in Power BI to provide an interpretation of a set of comments related to a topic, by studying the sentiment behind the more frequently used words. It is a good way to understand the overall public opinion on a company’s products or services. At the end, it provides valuable understanding of the costumers’ experiences and satisfaction levels.
At ClearPeaks, we help you get the most valuable insights from your data in innovate way. Send us an email and find out how our certified expert consultants can help you!