03 Aug 2022 A Gentle Introduction to Application Building Using Dash
What is Dash Plotly?
Dash is a Python framework that allows you to build interactive web application dashboards. Dash can create all kinds of analytical applications – financial, web-based, machine learning, medical and manufacturing dashboards, and you only need Python – there’s no need to know JavaScript, HTML or CSS, because Dash abstracts them all away!
The framework is built on top of Flask, Plotly.js, and React.js, and it’s open source; its apps run on the web browser.
A Dash application is composed of two principal blocks:
- Layout: describes what the application looks like.
- Callbacks: describes the interactivity of the application.
Dash provides Python classes for all the visual components of the application (a Python class is like an outline for creating a new object). Dash contains Dash Core Components that allow you to create dropdowns, sliders, checkboxes, graphs, etc., and it also contains Dash HTML Components to create HTML content like images, headers, and so on. These are the two basic components to create the layout, but Dash can use several open-source component libraries such as Dash Bootstrap Components or Dash Tables.
Hands On – Creating a Simple Dash Application
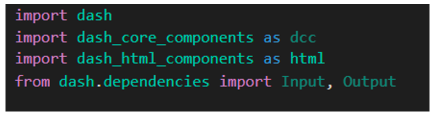
Let’s start to create a simple Dash application, using Yahoo Finance stock data. First, let’s install the packages:
Once the packages have been installed and we’ve got the data, we can start with the layout.
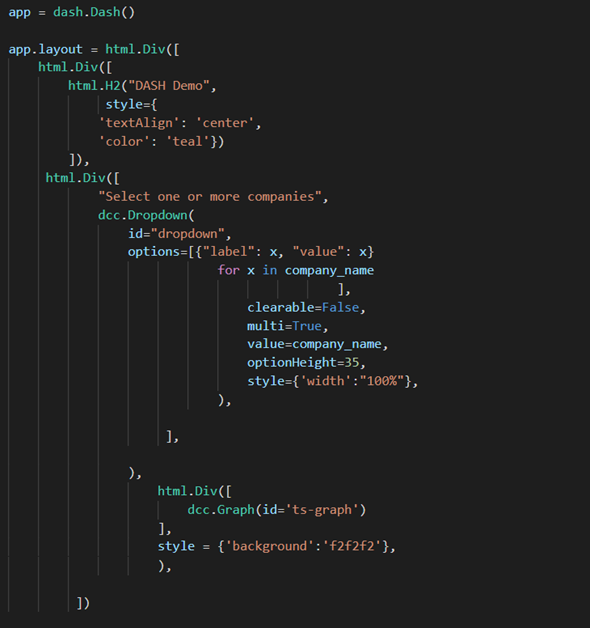
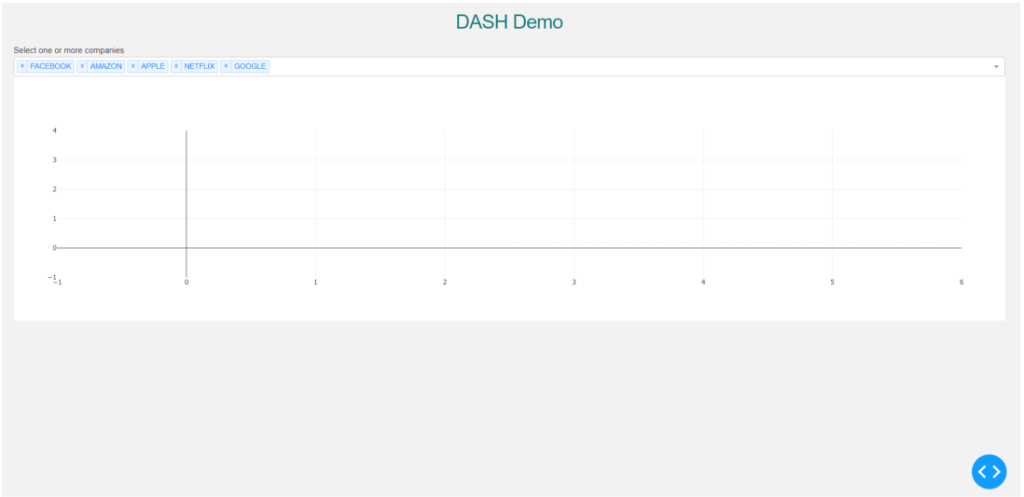
The first step is to initialise the Dash app, and then to design our layout: we are going to add divisions or sections with the html.Div() to separate all the objects. First, we are going to create a division to add a title, using HTML Components such as H1, H2, etc., and style it (as in pure web development).
Next, we add a dropdown with dcc.Dropdown() from Dash Core Components and a graph too, with html.Graph(). We won’t specify the graph type now but on the callbacks, so we can create interaction between the dropdown and the graph.
In order to view our app we need to run our web server:
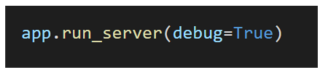
The app will now be running on our localhost in the web browser:
Once our layout is ready, we can add interactivity between the objects; this object can now be seen as Input and Output (hence the Input and Output function). Dash provides the @app.callback decorator (a Python decorator takes in a function, adds some functionality and returns it) which will add the input/output logic to our different functions:
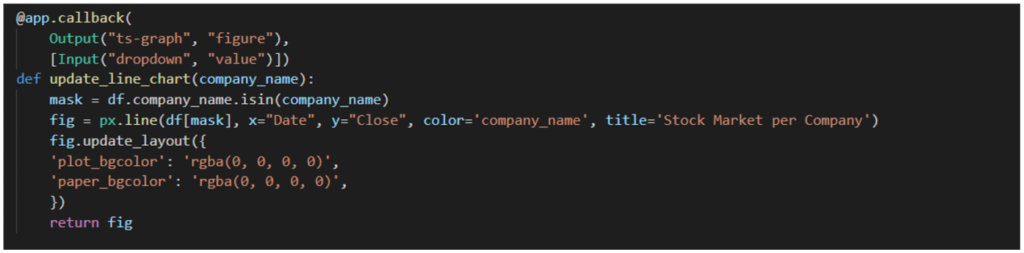
In this case, our callback will use the graph as its output and the dropdown as an input, so we can visualise the companies that we select from the dropdown:
Why Dash?
The example that we have seen is a just a small sample of what Dash can do – it has a lot more functionalities to offer than what we’ve showcased in this article.
Dash is a great option for Python users working on data analysis, data exploration, visualisation, modelling, reporting, and so on. Merging Python with web development languages like HTML and CSS allows us to build highly customisable objects with tailored sizing, positioning, colours, fonts, etc. Dash can be also used with R, Julia, and Jupyter.
If you are planning to build a self-styled enterprise-level app and create cool and complex objects easily in Python, Dash is the way to go! And don’t hesitate to get in touch with our team of experts if you need some help building and deploying your customised data apps!