18 Jan 2023 A Guide to Machine Learning in Oracle Analytics
Nowadays, if you want to predict behaviour you no longer need to know how to code in Python or R. There are multiple platforms that offer machine learning models without coding, and in this blog post we’ll introduce you to the Oracle Analytics Machine Learning (ML) module. We will demonstrate how to enable the module, look at the options to create, explore and make transformations on a dataset, and then guide you through its capabilities and the usage of both built-in and custom models for making predictions.
Machine Learning is available to use in the Oracle Analytics Cloud, Server and Desktop editions; since it is not enabled by default in the Desktop edition, please follow the instructions below.
Oracle Analytics Desktop
Before enabling the ML module, you’ll see that the options for custom models are missing (as the ML module will not work before being enabled). You could try to create and train a model on a dataset before enabling it, but an error will be retrieved when you try to run the data flow.
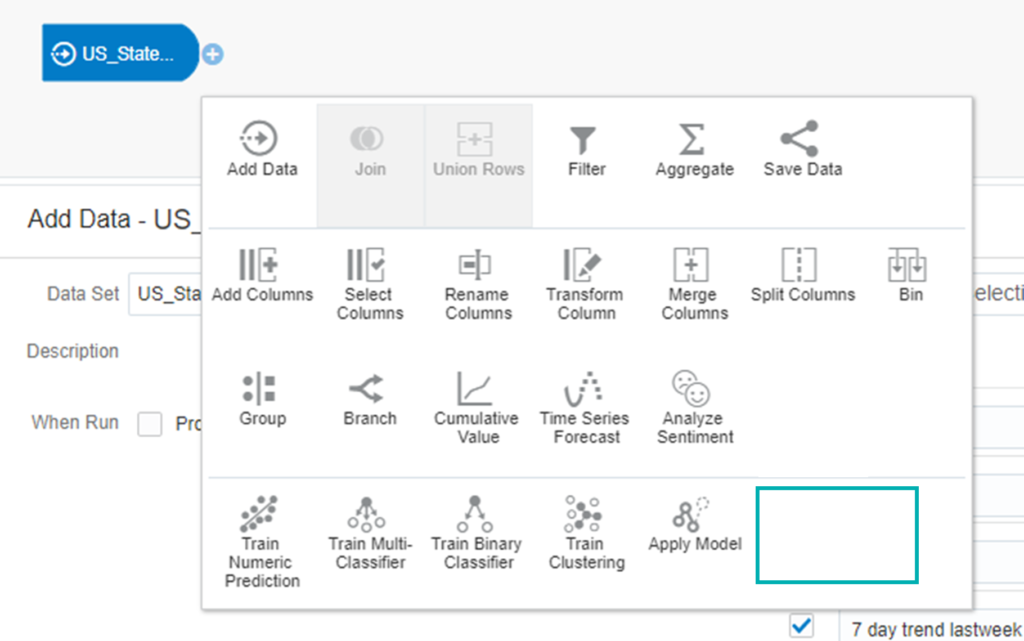
Figure 1: Missing options before enabling the ML module
To enable the ML module in Oracle Analytics Desktop, go to Start and type Install DVML:
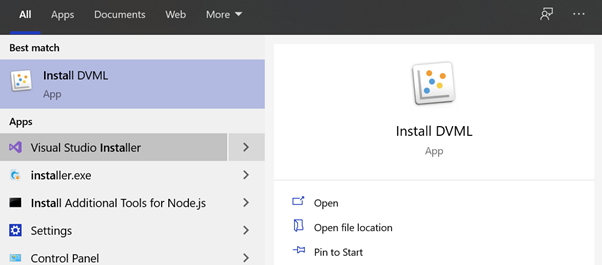
Figure 2: Enabling the ML module in the Desktop version
Oracle Analytics Server
Please follow the steps from Oracle Support to enable Custom Scripts for Machine Learning and Data Flows in OAS.
The options Apply Custom Script and Train Custom Model are now available and ready to use:
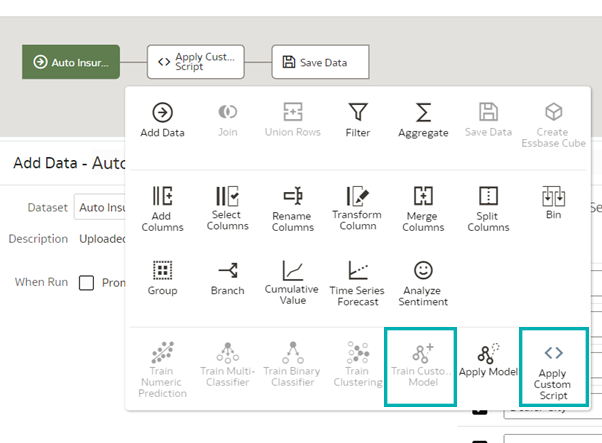
Figure 3: New options available after enabling the ML module
Creating a Dataset
When creating a new dataset, there are options to upload an external file, to use an existing Subject Area and/or to create a new database connection, and to choose a table. Oracle will join the sources automatically if there is a column with the same name and data type in all the sources, but it is possible to change this condition and add it manually.
One very handy feature is enriching the dataset with the recommended Oracle tips, like extracting information from date columns, improving geographical columns with latitude, longitude, city, state, etc. New calculated fields are easily created out of existing ones – with a right click you get a list of quick operations available for that data type, and if you want more than that just click on Edit:
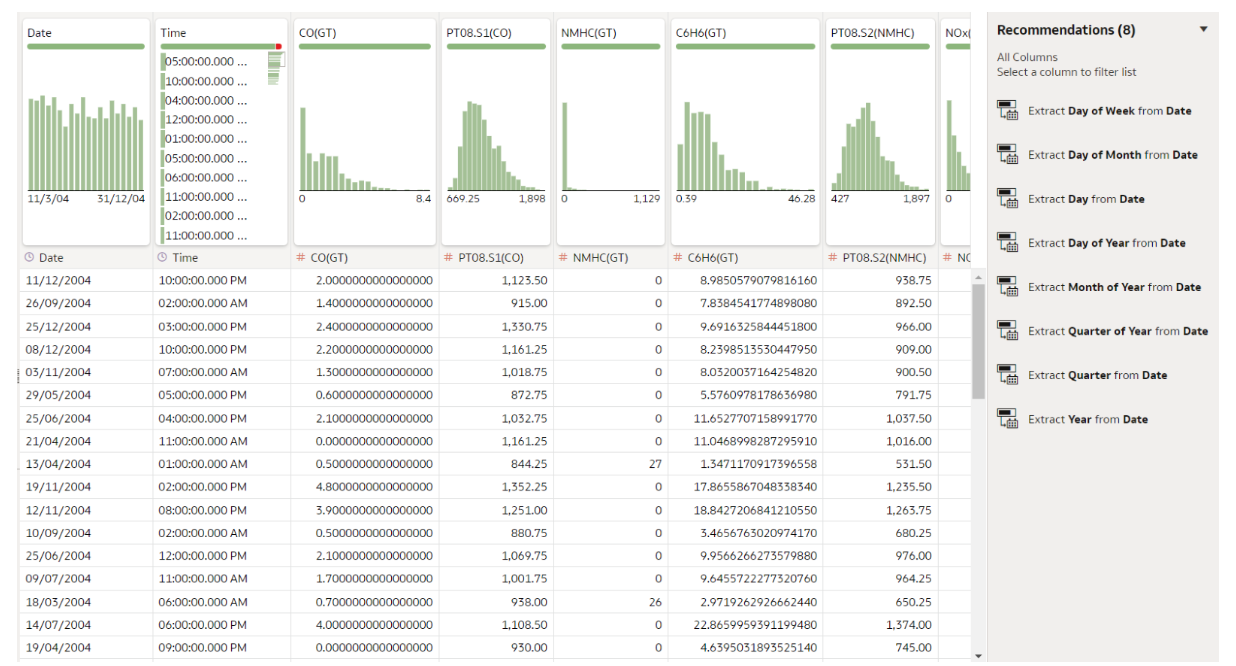
Figure 4: Enriching the dataset
There is an option to analyse a column with the Explain functionality. Explain analyses the selected column within the context of its dataset and generates text descriptions of the insights it finds. For example, you’ll find out basic facts, key drivers, segments explaining the column, and anomalies.
Applying Custom Python Script
If the standard data transformations Oracle offers in the tool itself are not enough, you can apply your own Python scripts for more complex ones and solve problems in a more elegant way.
First, the Python script must be embedded in an XML format to be able to work inside the tool. The following code, which can be found in the Oracle Analytics Library, is an example of XML embedding. The main tags that need to be defined are explained below:
<!--?xml version="1.0" encoding="UTF-8"?-->
<script>
    <scriptname>py.TermFrequency_oracle</scriptname>
    <scriptlabel>Term Frequency Analysis DF-EVAL(py)</scriptlabel>
    <target>python</target>
    <type>execute_script</type>
    <scriptdescription>
    <![CDATA[
        This is a python script which takes text values of a column as input and gives out the
        term frequency of top 'n' words in descending order (top 30 by default). The stop words
        (common words such as 'and','the') are removed by the script for better analysis.
    ]]>
    </scriptdescription>
    <version>v2</version>
    <outputs>
        <column>
            <name>term</name>
            <displayName>term</displayName>
            <datatype>varchar(100)</datatype>
        </column>
        <column>
            <name>frequency</name>
            <displayName>frequency</displayName>
            <datatype>integer</datatype>
        </column>
   </outputs>
   <options>
        <option>
            <name>topn</name>
            <displayName>topn</displayName>
            <value>30</value>
            <required>false</required>
            <ui-config />
        </option>
        <option>
            <name>Text</name>
            <displayName>Text</displayName>
            <type>column</type>
            <required>true</required>
            <description>The column to used for computing term frequency</description>
            <domain></domain>
            <ui-config></ui-config>

        </option>

        <option>
            <name>includeInputColumns</name>
            <displayName>Include Input Columns In Scored Dataset</displayName>
            <value>false</value>
            <required>false</required>
            <type>boolean</type>
            <hidden>true</hidden>
            <ui-config></ui-config>
        </option>
        </options>
        <scriptcontent><![CDATA[
import pandas as pd
import numpy as np
import copy
from sklearn.feature_extraction import text
from sklearn.feature_extraction.text import CountVectorizer

def create_TF_DF(list_words):
    vectorizer = CountVectorizer(decode_error='ignore', strip_accents='unicode',
    stop_words='english',analyzer='word')
    vectors = vectorizer.fit_transform(list_words).toarray()
    vocab = vectorizer.get_feature_names()
    freq = np.sum(vectors, axis=0)
    topn = int(args['topn'])
    df1 = pd.DataFrame({'term':vocab,'frequency':freq})
    df1 = df1.sort_values(by='frequency',ascending=False)
    df1 = df1.head(topn)
    return df1

def obi_execute_script(dat, columnMetadata, args):
    words = args['Text']
    df = dat[[words]].copy()
    df[words] = df[words].fillna('');
    df1 = create_TF_DF(df[words].tolist())
    return df1

]]></scriptcontent>
</script>
In the script tag, the important subtags are:
- Scriptname – intuitively, it should be the same as the name of the script.
- Type – must be execution_script, otherwise you won’t be able to see it in the list of scripts when you want to Apply custom script on a dataset.
- Inputs – input parameters.
- Outputs – output parameters.
- Options – options you can define in your script, either mandatory or optional.
- Scriptcontent – the entire Python script. It’s important to define a function called obi_execute_script with input parameters (dat, ColumnMetadata, args), where dat is your dataset, ColumnMetadata is column metadata, and args are parameters in the options tag.
Now, import the script to Create > Script:
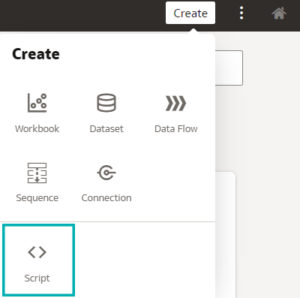
Figure 5: Importing custom Python script
If you are using Python libraries that do not come with the tool, you’ll get an error like this:
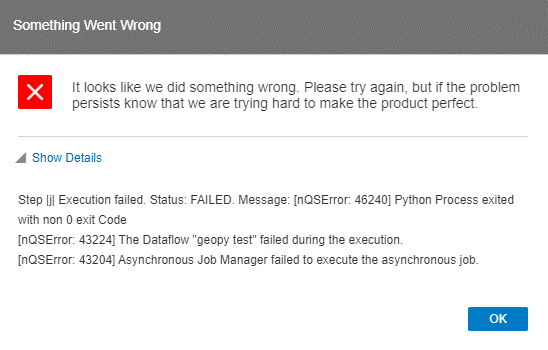
Figure 6: Error when a specific Python library is not installed
To solve the error, we need to install the missing libraries. In Desktop editions, check the list of all built-in packages at this path : ‘C:\Program Files\DVMLRuntime\Lib\site-packages’, and then install it like this:
- Open Command Prompt as an administrator
- Place yourself in folder ‘C:\Program Files\DVMLRuntime\PCbuild\amd64’
- Execute command: python -m pip install geopy
For the Server edition, Python libraries are placed in the folder (paths may differ): ‘/u02/OAS/oas_5.9/bi/modules/oracle.bi.dvml/lib/python3.5/’. To install a new library in the Server edition, ask your system administrator.
You are now ready to transform and cleanse using a Python script – create a new data flow, select the desired dataset, and apply the custom script:
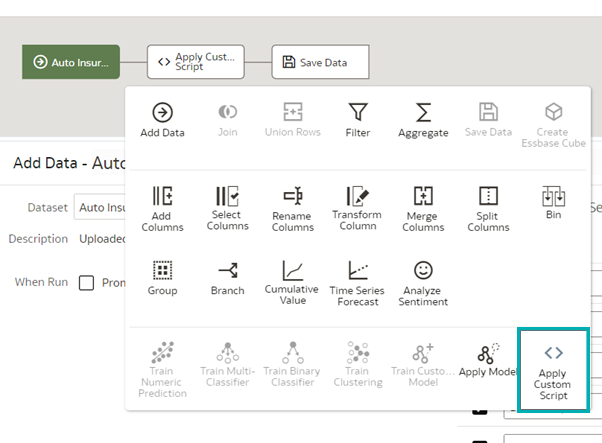
Figure 7: Applying custom Python script
Built-in ML Models
Now that the dataset has been cleansed, with the new columns and calculations added, we’re ready to do some predicting!
Oracle Analytics predictive models use several embedded ML algorithms to Shapemine your datasets, predict a target value, or identify classes of records:
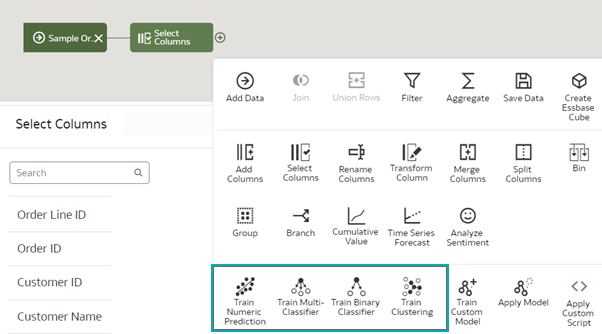
Figure 8: Predictive modelling types
Here’s a list of the algorithms available in the tool:
Numeric Predictions | CART for Numeric Prediction training | |
|---|---|---|
Multi-Classification | CART for model training | |
Binary Classification | CART for model training | |
Clustering | Hierarchical Clustering for model training |
First, create a data flow and add the dataset you want to use to train the model. This training dataset contains the data that you want to predict (for example, a value like sales or age, or a variable like a credit risk bucket).
You can also use this data flow editor to edit the dataset by adding columns, selecting columns, joining, and so on, as necessary.
After you’ve confirmed that the data is what you want to train the model on, add a training step to the data flow and choose a classification (binary or multi), regression, or cluster algorithm to train the model.
Here we chose Train Numeric Prediction and the available numeric algorithms are shown below:
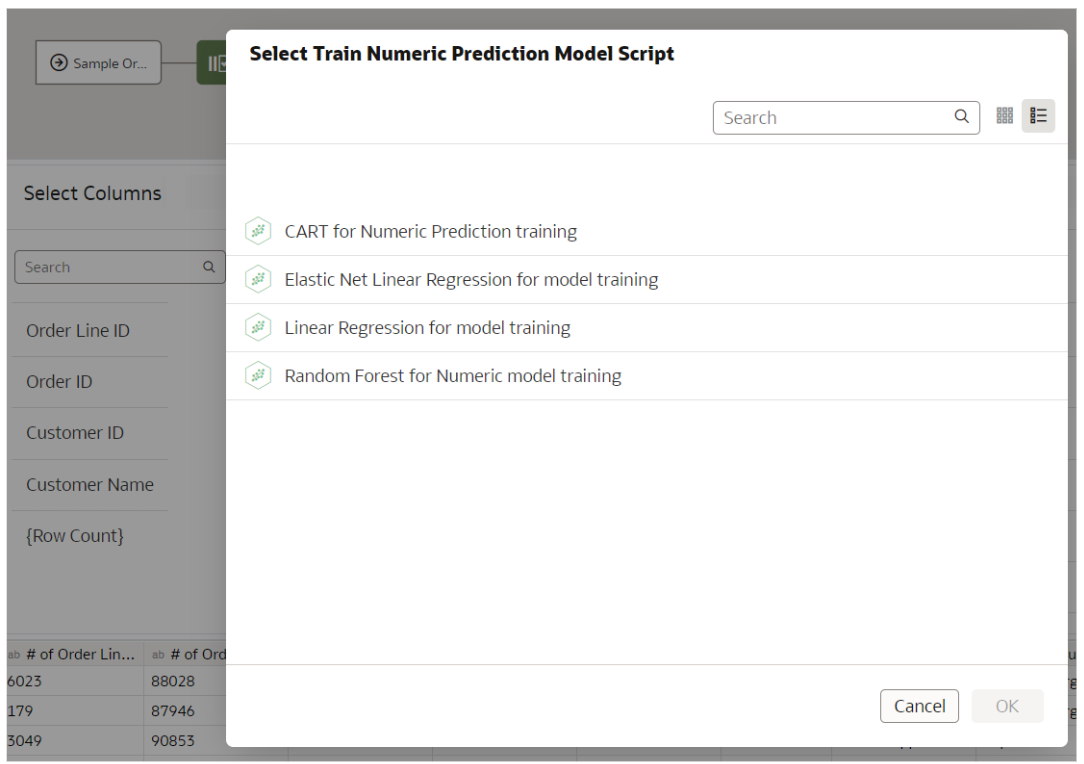
Figure 9: Numeric prediction algorithms
Once one of the algorithms has been chosen, its parameters are shown, ready for tweaking. You also specify the size of the training dataset here:
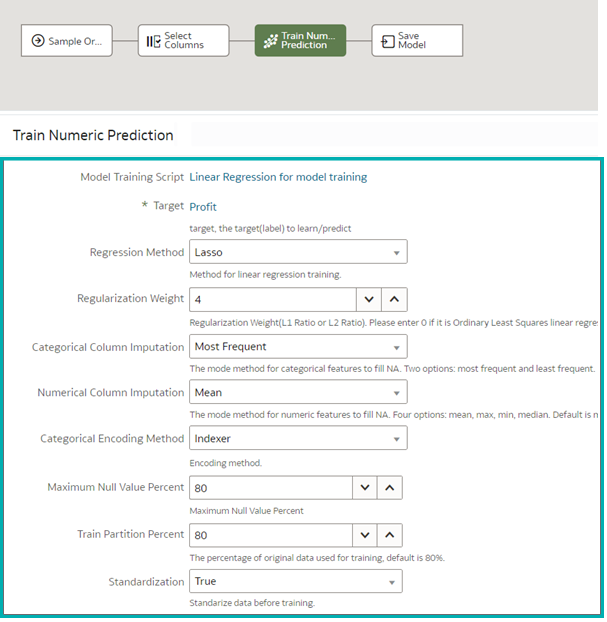
Figure 10: Tweaking the algorithm’s parameters
Name the resulting model, save the data flow, and run it to train and create the model. It will appear in the model registry, which is accessible via the main menu > Machine Learning > Model tab. Right-click on the model to determine its quality, like in this screenshot:
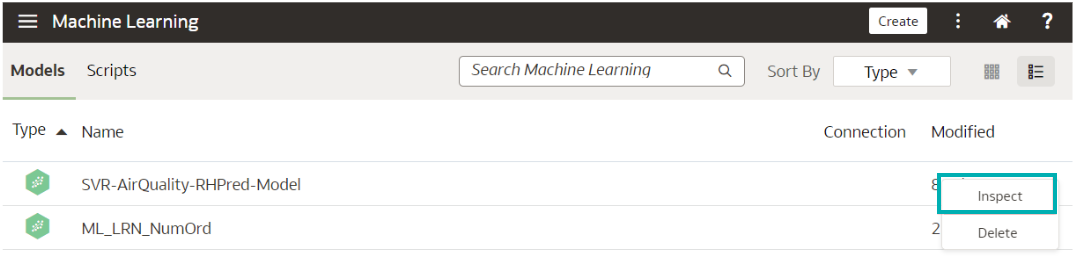
Figure 11: Model registry: inspecting the model
Each type of algorithm has specific metrics that define the model quality:
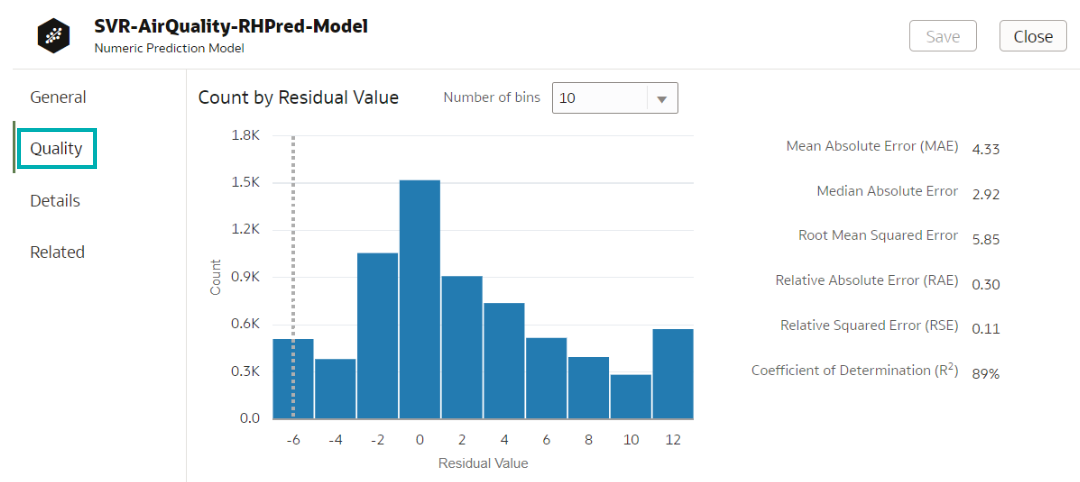
Figure 12: Quality of the inspected model
You can iterate the training process until the model reaches the quality you want, and when you’re satisfied the next step is to apply it to the entire dataset:
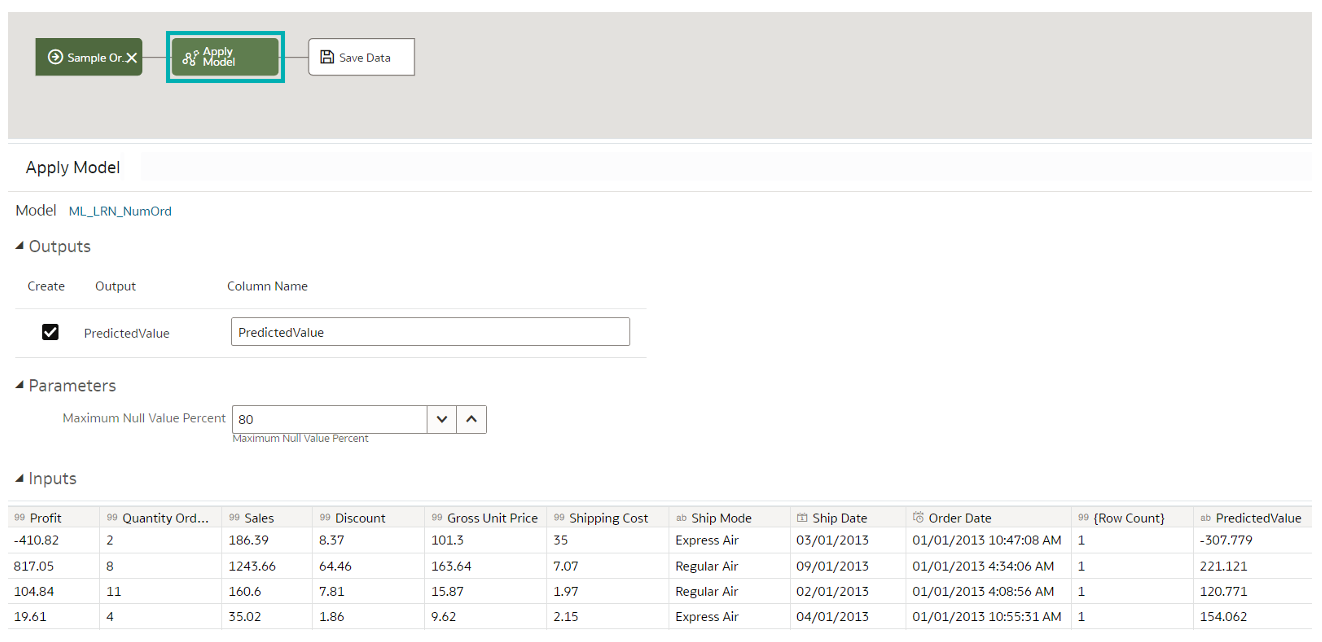
Figure 13: Applying the model to the entire dataset
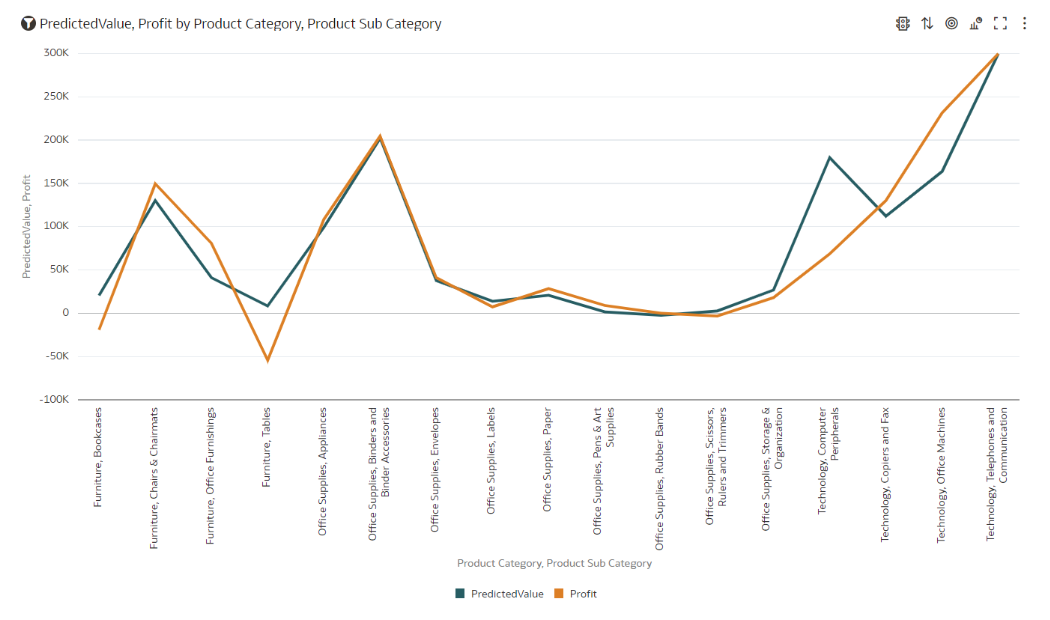
Now you can create a report where you’ll visualise prediction values with realised ones:
Custom Models in OAS
If the built-in models don’t meet your specific needs, you can train the data using a custom model implemented in Python. Like execution scripts, Python scripts for training and applying a model must be embedded in an XML format, and the tags and the functions will be slightly different. Be careful with the following:
- The Python train and apply script must have the same name, the only difference being the suffix. Example: ML_Custom_SupportVectorRegression.train & ML_Custom_SupportVectorRegression.apply.
- Tags
- Group – which group of algorithms yours belongs to (Machine Learning (Supervised) or Machine Learning (Unsupervised)).
- Class – custom.
- Algorithm – state which algorithm is being used.
- Type – when training a model type it’s create_model, when applying it’s apply_model.
- Scriptcontent – when training a model you have to define the obi_create_model(data, columnMetadata, args) function, when applying it’s obi_apply_model(data, model, columnMetadata, args).
You can find examples of these Python scripts in the Oracle Analytics Library.
Conclusion
Oracle Analytics is a great way to start exploring an ML platform. Out of all the modern platforms on offer, this one is ideal if you:
- Are already using Oracle.
- Have simple ML requests and coding is not necessary.
- Want to try out an ML platform.
- Don’t know how to code.
- Are not a data scientist.
- Want to develop a prediction model quickly.
- Are a data scientist and want to automate some of the ML process steps.
And even if none of these points apply to you, why not give it a try anyway? Explore its features, play around with the models and you might be surprised!
Contact us if you want further information about ML, OAS, or if you just want to see how to leverage your BI setup for better business results – our certified and experienced consultants will be happy to help!