29 Oct 2018 Data Virtualization
As we saw in our previous articles What can Big Data do for BI? and What can Cloud do for BI and Big Data?, the combination of Big Data, Cloud and Advanced Analytics can be very helpful to tackle new use cases that traditional Business Intelligence cannot handle on its own.
In this article we will explain what Data Virtualization (DV) is and what makes it different from traditional BI; we will also have a look at some use cases and some of the most popular DV vendors.
1. Introduction to Data Virtualization
Data Virtualization (DV) is a data integration technology for Business Intelligence. Although it has been around for more than 20 years, it is only now that more and more corporations are starting to use it as a workaround to Extract-Transform-Load (ETLs) and data warehousing in areas such as Business Intelligence Analytics (BIA), application development and Big Data.
The main purpose of data virtualization is to provide a unified, abstracted and encapsulated view of the data coming from a single or heterogeneous set of data sources, while the data remains in place, so you can create analytical dashboards with valuable information.
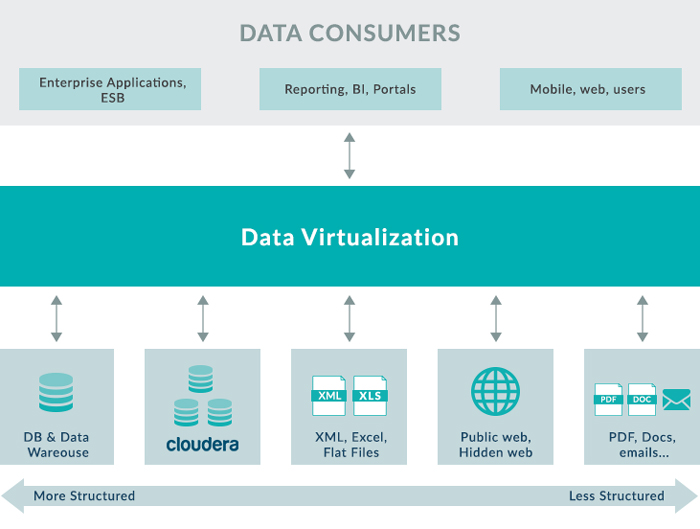
Figure 1: Representation of a Data Virtualization scenario.
As we can see in Figure 1, Data Virtualization reduces the need for ETL processes; what DV does is to implement some of our transformations and normalizations into the presentation layer as it comes back from the sources, so we don’t need separate staging areas for ETL.
DV tools allow us to connect our BI platforms to the canonical layer that has been generated in the DV platform, as opposed to going against the original sources. It expands access to multiple sources, so you can get a broader set of analyses and reports.
2. How does it work?
Data virtualization tools usually combine two different procedures: the data virtualization presentation layer and the data federation, which provides federated access to multiple data sources in a transparent manner.
Data virtualization and federation are two processes that are enabled by using software tools to create a virtual semantic presentation of data. They enable applications to transparently query data that is distributed across multiple storage platforms. If you’ve got data stored in an Oracle database, and you’ve got another data set that is stored in a DB2 database, a data federation mechanism will allow you to run a query against a virtual layer, or a semantic layer, that looks like a single data model, but then the tool itself takes that query and breaks it down into the query part that goes against the Oracle database and the query part that goes against the DB2 database. By doing this it masks the details of how the data is formatted in its original sources, or where it’s managed.
As we can see, DV simplifies the ability to blend data from multiple sources via consumer-oriented data materialization rules, so that it’s up to the consumer to define what the data is going to look like when it comes back. It’s just the data virtualization federation layer and the data virtualization federation tools that facilitate translating queries that go against the virtual semantic layer into the different parts that need to be sent out to the various original sources.
3. Workflow
First, there is a consuming system invoking a set of data services that then query a standardized, canonical, relational view.
At this point, the virtualization part tools transform the request against that canonical, relational view and transform that into a series of queries that are going to access the data. Sometimes they are queries, and sometimes they are going to turn into applications that scan through data sitting in flat files, and perhaps even have systems that walk through unstructured data.
When the data request goes out to access data, it goes through different federated sources which return the requested data back to the federation layer, and the virtualization layer normalizes it for the defined presentation. Finally, it goes back through the canonical, relational-logic model to the invoking consumer.
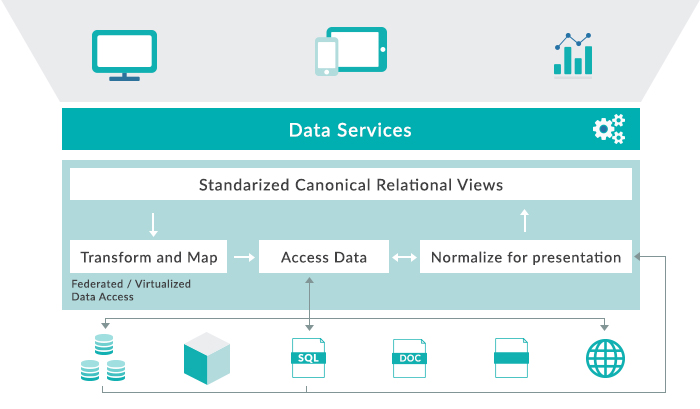
Figure 2: Data Virtualization workflow.
3.1. Benefits
- Reduce risk of data errors.
- Reduce system workload through not moving data around.
- Increase speed of access to data on a real-time basis.
- Significantly reduce development and support time.
- Increase governance and reduce risk by using policies.
- Reduce required data storage.
3.2. Drawbacks
- May impact operational systems response time due to unanticipated user queries or not being tuned early on.
- Does not impose a heterogeneous data model, meaning the user must interpret the data, unless combined with Data Federation and business understanding of the data.
- Requires a defined governance approach to avoid budgeting issues with shared services.
- Change management is a complex task.
4. Use cases
Data Virtualization is ideal when you have to make a business decision and there is no time to lose. The most common uses cases for Data Virtualization are Agile BI, Big Data and unified views of data.
4.1. Data Virtualization vs Data Warehousing
Data Virtualization stands out for its simplicity and the time needed to implement a solution. It’s much faster than a data warehousing solution, simply because you don’t need to design, build and test a data warehouse and the ETL to copy data into it.
And as you don’t have to go through this process, you will save a lot of money (less hardware, man-hours, software, etc.). Data Virtualization also prevents data inconsistencies and a loss of data.
Nevertheless, data warehousing is still the best solution for historical data.
4.2. Traditional BI & Data warehousing
Implementing changes is much faster in a DV platform than in the world of physicalized data, and building logical data warehouses is a much faster process than building physical ones. Once you have implemented the data model in your DV environment, you can reuse that model with any BI tool you want and with any interested data consumer.
- Real-time reporting
- Logical data warehouse
- Hybrid Data Virtualization / ETL
- Operational BI and Analytics
4.3. Big Data & Advanced Analytics
Data Virtualization provides an abstraction and federation layer that hides the complexities of big data stores and makes it easy to integrate data from these stores with your current DW (or other data within the enterprise). The DV platform connects both data stores and federates queries across both systems, so that the “hybrid” data warehouse appears as a single data store to users.
- Hadoop / NoSQL as an Analytics Sandbox
- Hadoop as a Staging Area
- Hybrid Data Storage
- Hadoop/NoSQL for ETL
- Data discovery and “What if” Analytics
4.4. Web & Cloud integration services
The DV platform can work as a technology adapter providing, amongst other things, SQL, web services and JSON access to data. This means that you can use the platform as an API for accessing data.
- Cloud data services
- Cloud/SaaS Application Integration
- B2B integration through Web Automation
- Single View Applications
- Company mergers and acquisitions
5. Checklist: Could Data Virtualization help your organization?
The following questions are useful to determine if data virtualization would be a good solution for your business requirements:
- Does the business request quick, cost-effective reporting solutions?
- Is there a need to build real-time reporting, analytics, and self-service BI?
- Do you need to overcome departmental policies to allow your applications to share confidential information?
- Do you need to integrate external sources (social networking, online sources, thirds, etc.) with your internal applications and BI?
- Do you need to integrate multiple data types (unstructured or structured data) from a public cloud application with internal structured data?
- Does your organization use multiple BI tools, each with a different presentation layer?
If the answer to any of these questions is “Yes”, then data virtualization is worth investigating.
5.1. Platforms
Figure 3 shows a Forrester Wave vendor comparison, allowing us to see the challengers, contenders, strong performers and leaders in the market:
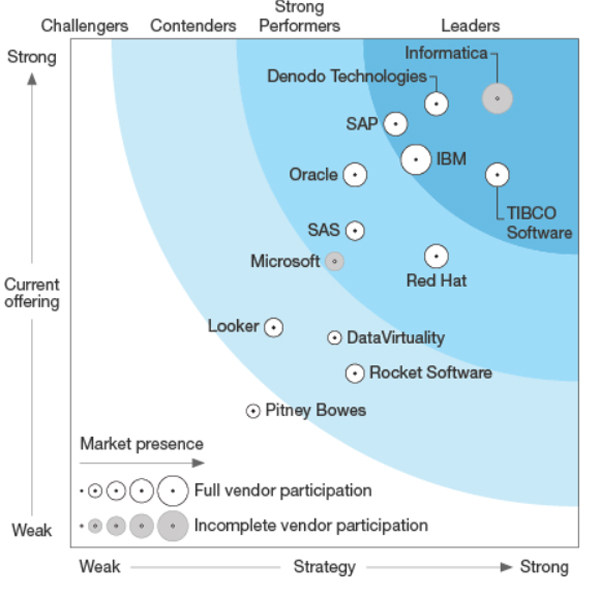
Figure 3:Vendor comparison. Source: Forrester.
This comparison was made in Q4 2017. We can see that Informatica, Denodo and Tibco are the leaders in data virtualization, all of them with strong offerings. Lately, more options are appearing with similar aims as the mentioned solutions, AtScale and Dremio are worth mentioning. The first distinctive feature of this couple of technologies is that they can be deployed on Hadoop clusters while most data virtualization vendors require specific platforms. AtScale focusses on the BI arena and aims at being the universal semantic layer for all BI tools. Dremio, that actually defines itself as a Data-as-a-Service technology, does conceptually a similar job than data virtualization technologies but it is open-source, it focusses greatly on Big Data platforms and it offers acceleration capabilities.
Moreover, some BI tools like Zoomdata and Arcadia Data are shipping, as part of their product, solutions that are also conceptually similar to data virtualization but more limited in type of sources and features. Zoomdata Fusion lets you outsource the “virtualization” component to an external Spark engine, so you can tackle blending of sources with Big Data engines. Likewise, Arcadia Data, which runs on a Hadoop cluster, also allows blending different sources leveraging the Hadoop cluster and its own Analytical Views features. Other BI tools also offer blending solutions but have scalability issues (they do not run on clusters) on top of the mentioned limitations in types of sources and features.
In either case, there might be certain caveats when merging the virtualization layer with the visualization tool as the logic lies in the dashboards or in the best case scenario in the visualization server. In the first case, when the logic lies in the dashboards, if you need to alter the semantic model you can end up with multiple versions of truth at the semantic definition; this is partly solved if the logic lies in the visualization server. But please note that in both cases reusability is not friendly with other tools.
Conclusion
DV is a highly efficient way to make data from operational systems available for real-time needs, and it can also pull in older data from BI databases, allowing BI tools to access all the company’s business information, both current and historical, in a unified way.
Multiple BI tools can access the data in the same way with DV, using the same business terminology and the same KPI aggregation rules. The organization can ensure everyone uses the same data, whilst still being able to deploy a mixture of tools (reporting, dashboarding or predictive analysis) to suit different needs, locations and licensing arrangements.
To sum up, the main benefits of DV are:
- A single version of the truth, even when multiple BI solutions are used.
- A huge time-to-market improvement: a “virtual data warehouse” is available faster than with any other solution.
- The ability to provide information in a controlled way, while combining historical and real-time data.
- Mitigation of vendor and technology dependency by putting a neutral layer between databases and the applications that use them.
DV should be considered by any company that wants to address BI needs fast, even those that are also developing an EDW; DV can be used to supplement these developments and is a convenient way to model the requirements and confirm with the business that those requirements are correctly defined, an approach that can significantly shorten delivery cycles for the EDW.
Please contact us at ClearPeaks if you need further guidance!