22 Nov 2023 Exploring Cloudera Data Engineering on CDP Public Cloud
This article is the third entry in our series of blog posts presenting some of the main services offered by CDP Public Cloud. We’ve already talked about Cloudera Data Warehouse (CDW) and Cloudera Data Flow (CDF); today we’ll look at Cloudera Data Engineering (CDE).
We even have a webinar where you can see all of them in action! Click here to watch it on demand.
Cloudera Data Engineering is a Kubernetes-based service within CDP Public Cloud that allows you to create, manage, and schedule Apache Spark jobs without the need to create and maintain Spark clusters. The service lets you define virtual clusters with a range of CPU and memory resources, and scale them up and down as necessary to run your Spark workloads, helping to control your cloud costs. What’s more, you can also run and schedule queries to CDW, enabling the execution of comprehensive pipelines that integrate with your existing data warehouse, then read, analyse, and write your data using a combination of Spark code and SQL-like queries.
Additionally, CDE ships with Apache Airflow, which allows you to automate a workflow or a data pipeline using either Python DAG files or the user-friendly GUI, providing a powerful orchestration tool that enables easier automation, dependency management and customisation. Each CDE virtual cluster includes an embedded instance of Apache Airflow, but you can also use CDE with your own Airflow deployment. CDE currently supports two Airflow operators: one to run a CDE Spark job, and the other to access Cloudera Data Warehouse.
In the following sections, we’ll delve deep into these tools and show you how to automate data pipelines using CDE and Airflow. We’ll start by setting up a CDE cluster, then execute a straightforward Spark job. After that we’ll schedule an Airflow workflow that incorporates both Spark jobs and CDW queries, using a DAG file, and finally we’ll do the same using the Airflow GUI. Let’s get on with it!
Enabling the CDE Service
First of all, we need to enable a CDE Service, and in our example we’ll be using CDP Public Cloud on Azure. The steps below can be followed on AWS as well, in essentially the same way.
To enable the service, we first navigate to the CDE section and define its details and size:
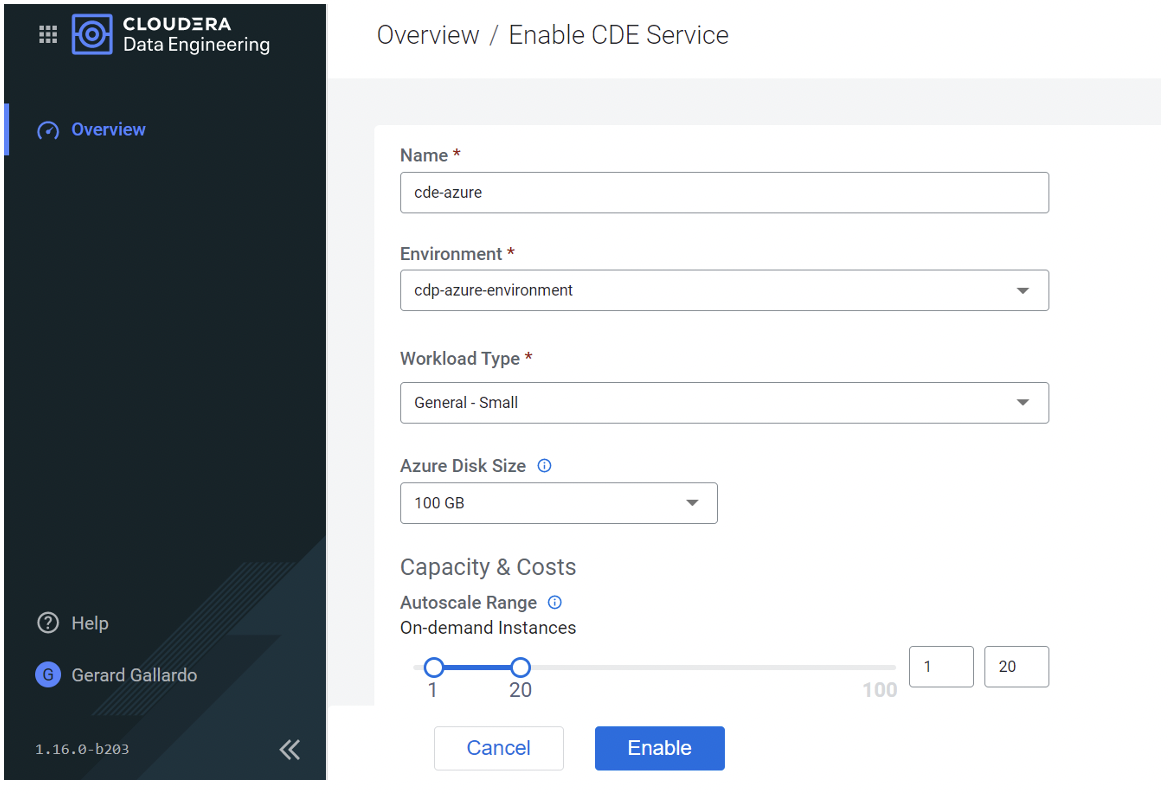
Figure 1: Enabling the CDE environment
Once the service has been enabled, we create a new cluster (in our example we’re using the minimum CPU and storage, but you can change this according to your needs).
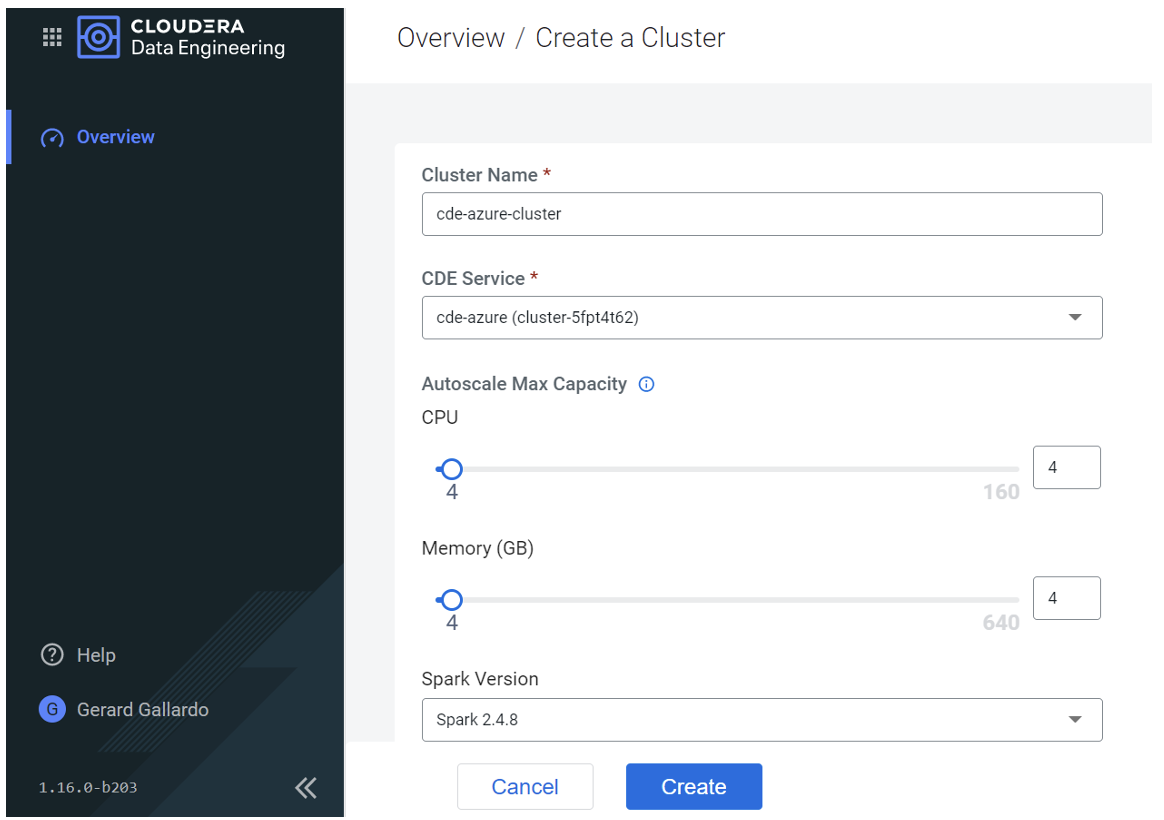
Figure 2: Creating a new CDE cluster
After the cluster has been created, the overview looks like this:
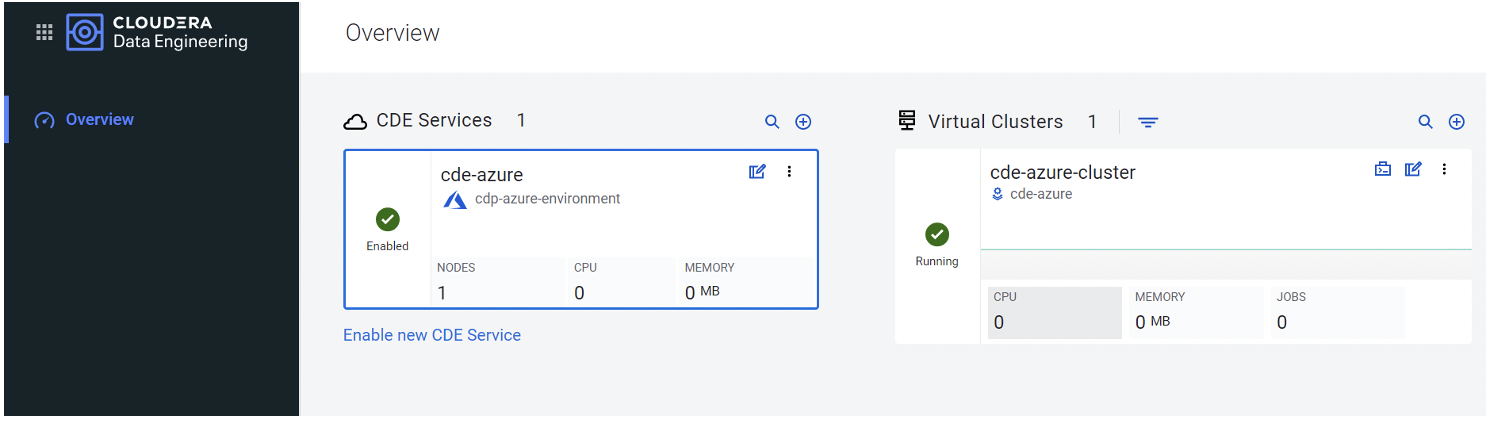
Figure 3: Overview of CDE environment and cluster(s)
Running a Spark Job
Now that our cluster is up and running, we can run our first Spark job. On the Job Details page, we can select the Job Type (Spark or Airflow), and the Application File (via file or URL). As shown in the screenshot below, we’ll start with a simple example – a Spark job, uploaded as a file:
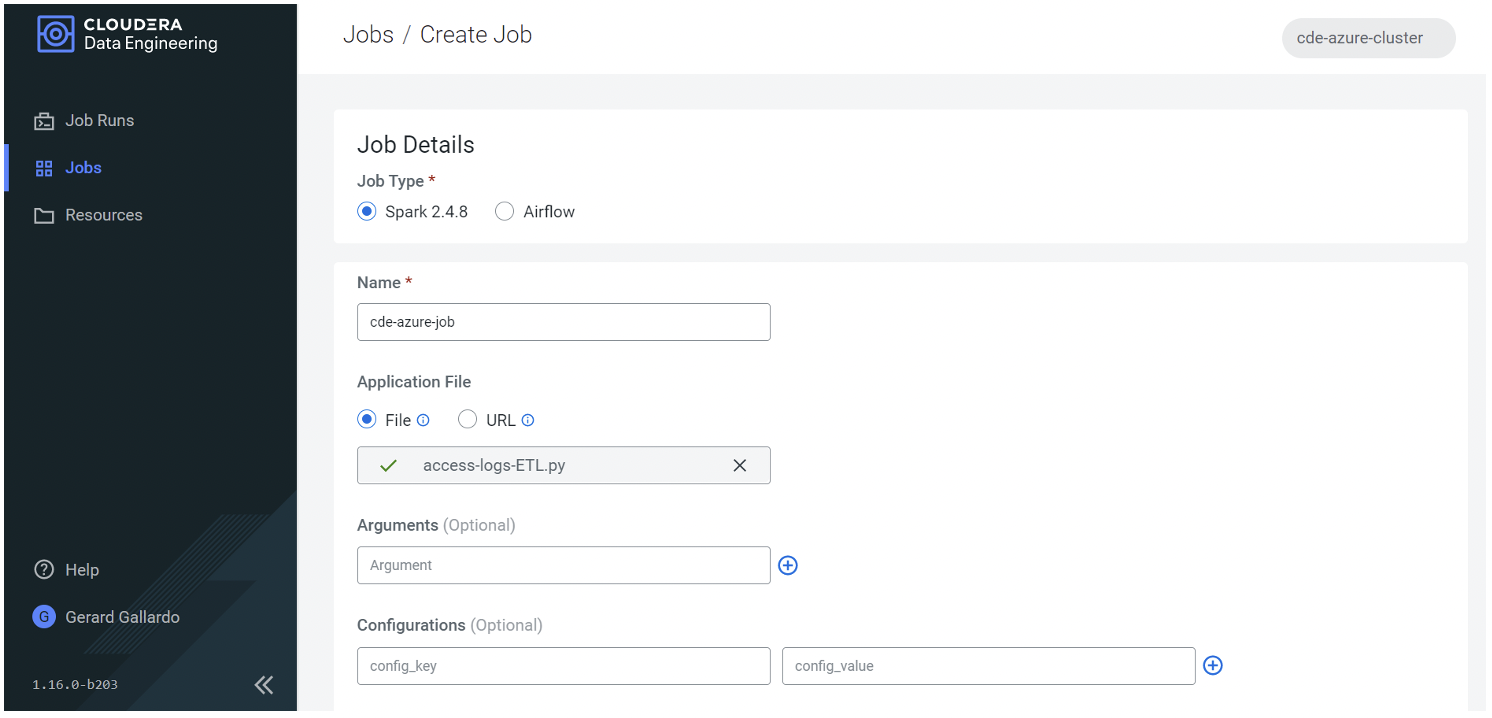
Figure 4: – Creating a Spark job in CDE
The access-logs-ETL.py file shown above contains a simple Spark script which reads some logs from an S3 location then writes them to a Hive table in CDW (of course, the CDW Service needs to be operational too; check out our about CDW if you want to know more). Below, a snapshot of the code – as you can see, there is no need to define additional settings or variables in order for it to run in our cluster, not even to run queries on CDW:
from pyspark.sql import SparkSession
from pyspark.sql.functions import split, regexp_extract, regexp_replace, col
import sys

spark = SparkSession \
    .builder \
    .appName("Pyspark Tokenize") \
    .getOrCreate()

input_path ='s3a://cdp-cde-demo/access-log.txt'
base_df=spark.read.text(input_path)

split_df = base_df.select(regexp_extract('value', r'([^ ]*)', 1).alias('ip'),
                          regexp_extract('value', r'(\d\d\/\w{3}\/\d{4}:\d{2}:\d{2}:\d{2} -\d{4})', 1).alias('date'),
                          regexp_extract('value', r'^(?:[^ ]*\ ){6}([^ ]*)', 1).alias('url'),
                          regexp_extract('value', r'(?<=product\/).*?(?=\s|\/)', 0).alias('productstring')
                         )

filtered_products_df = split_df.filter("productstring != ''")
cleansed_products_df=filtered_products_df.select(regexp_replace("productstring", "%20", " ").alias('product'), "ip", "date", "url")

print(f"Creating retail Database \n")
spark.sql("CREATE DATABASE IF NOT EXISTS retail")

print(f"Inserting Data into retail.tokenized_accesss_logs table \n")
cleansed_products_df.\
  write.\
  mode("overwrite").\
  saveAsTable("retail"+'.'+"tokenized_access_logs", format="parquet")

print(f"Count number of records inserted \n")
spark.sql("Select count(*) as RecordCount from retail.tokenized_access_logs").show()

print(f"Retrieve 15 records for validation \n")
spark.sql("Select * from retail.tokenized_access_logs limit 15").show()
Figure 5: Writing data in CDW using Spark on CDE
Remember that although it’s running queries on CDW, this is still a Spark job, running on our CDE cluster. Later in the article we’ll show you how to schedule actual CDW jobs.
Once all the details for our job have been set, we click on “Create and Run” to finish the process. After completion, we can see if it has been executed properly by checking the (hopefully) green status icon as shown in the following screenshot:
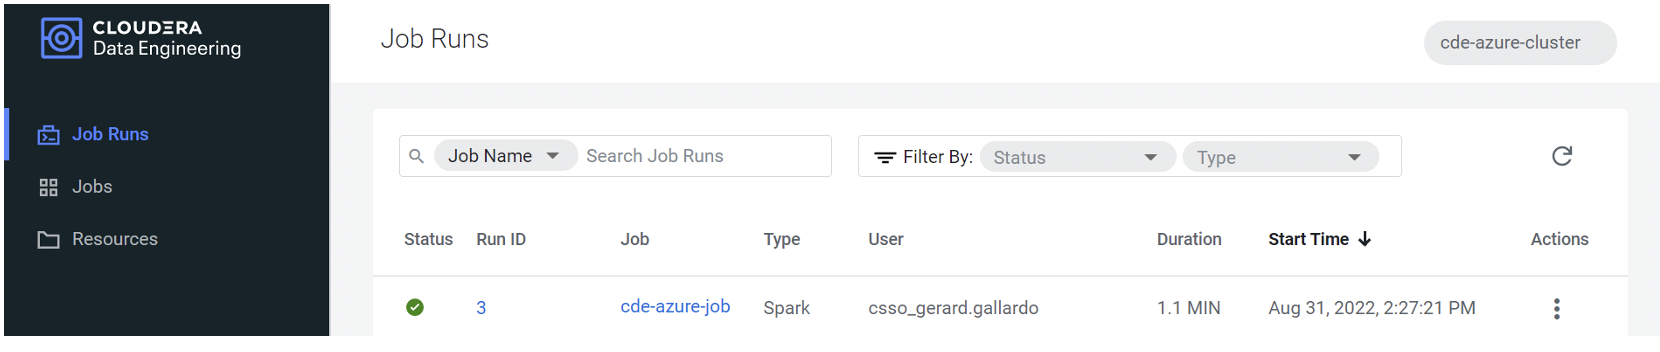
Figure 6: Job status overview
If we now move to “stdout” in Logs, we can see all the output from the job that we’ve just run. Optionally, we can also move to the Analysis tab and get a deeper view of the different stages of the job:
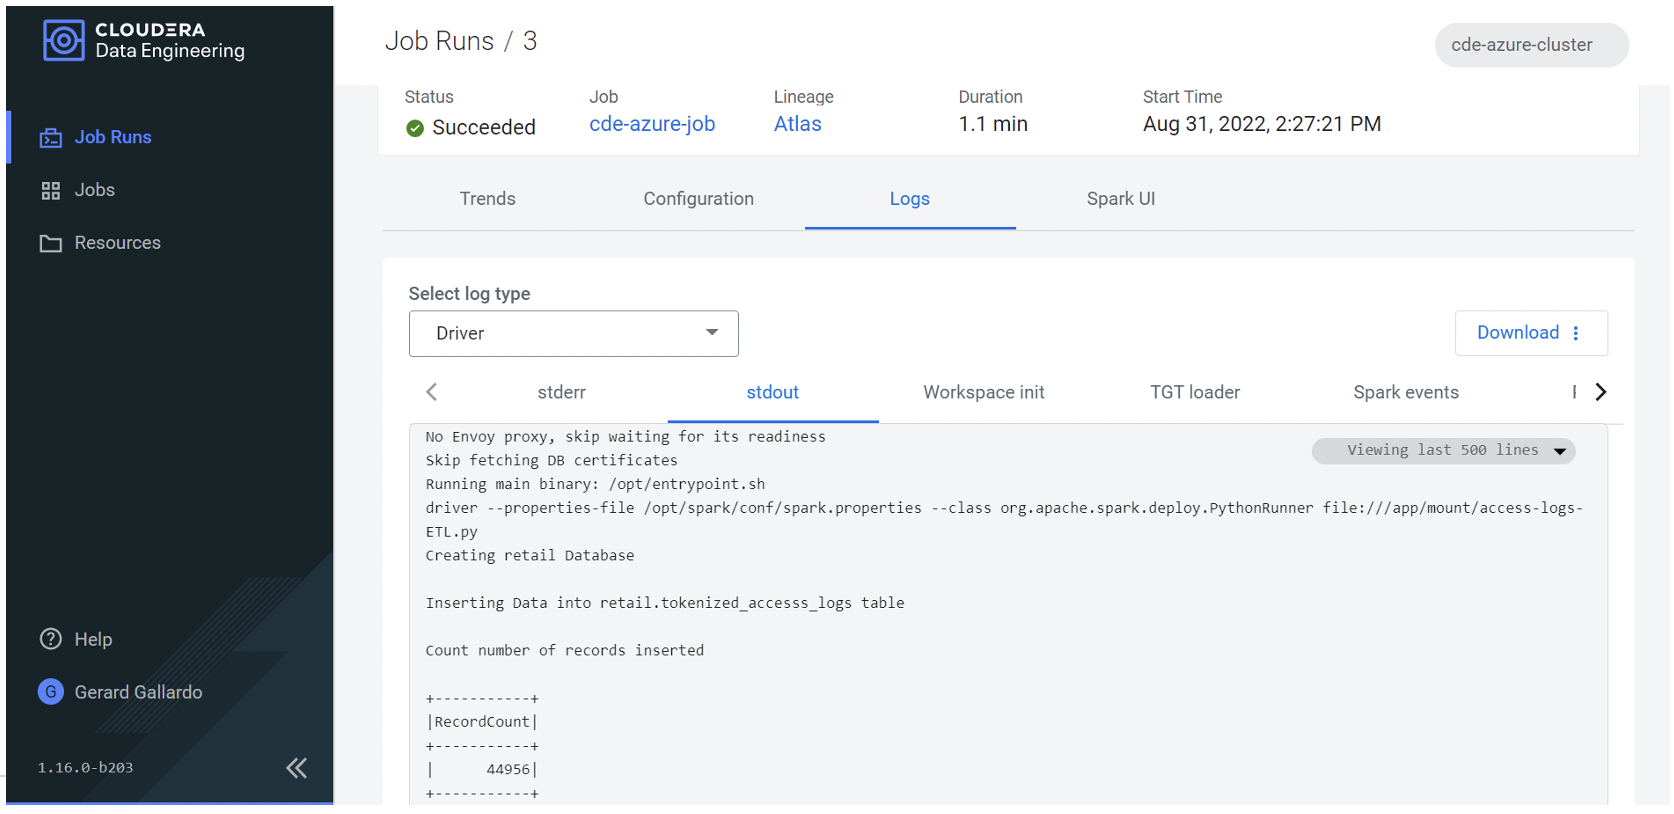
Figure 7: More details of the executed job, including its output
Going back to our CDE Overview, we can also see a real-time chart showing how much CPU and memory our job used during execution:
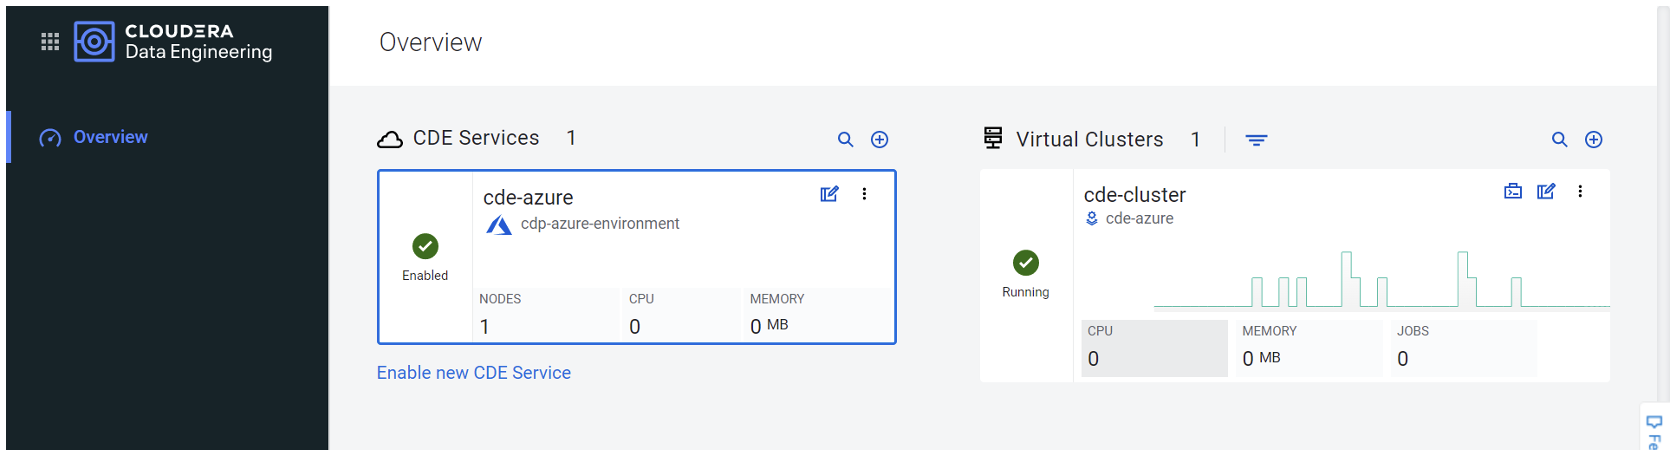
Figure 8: Resource consumption on the CDE Overview page
Finally, if we want, we can also add a schedule to our job. For example, we can run it every hour, as shown below, or alternatively we could define a CRON expression:
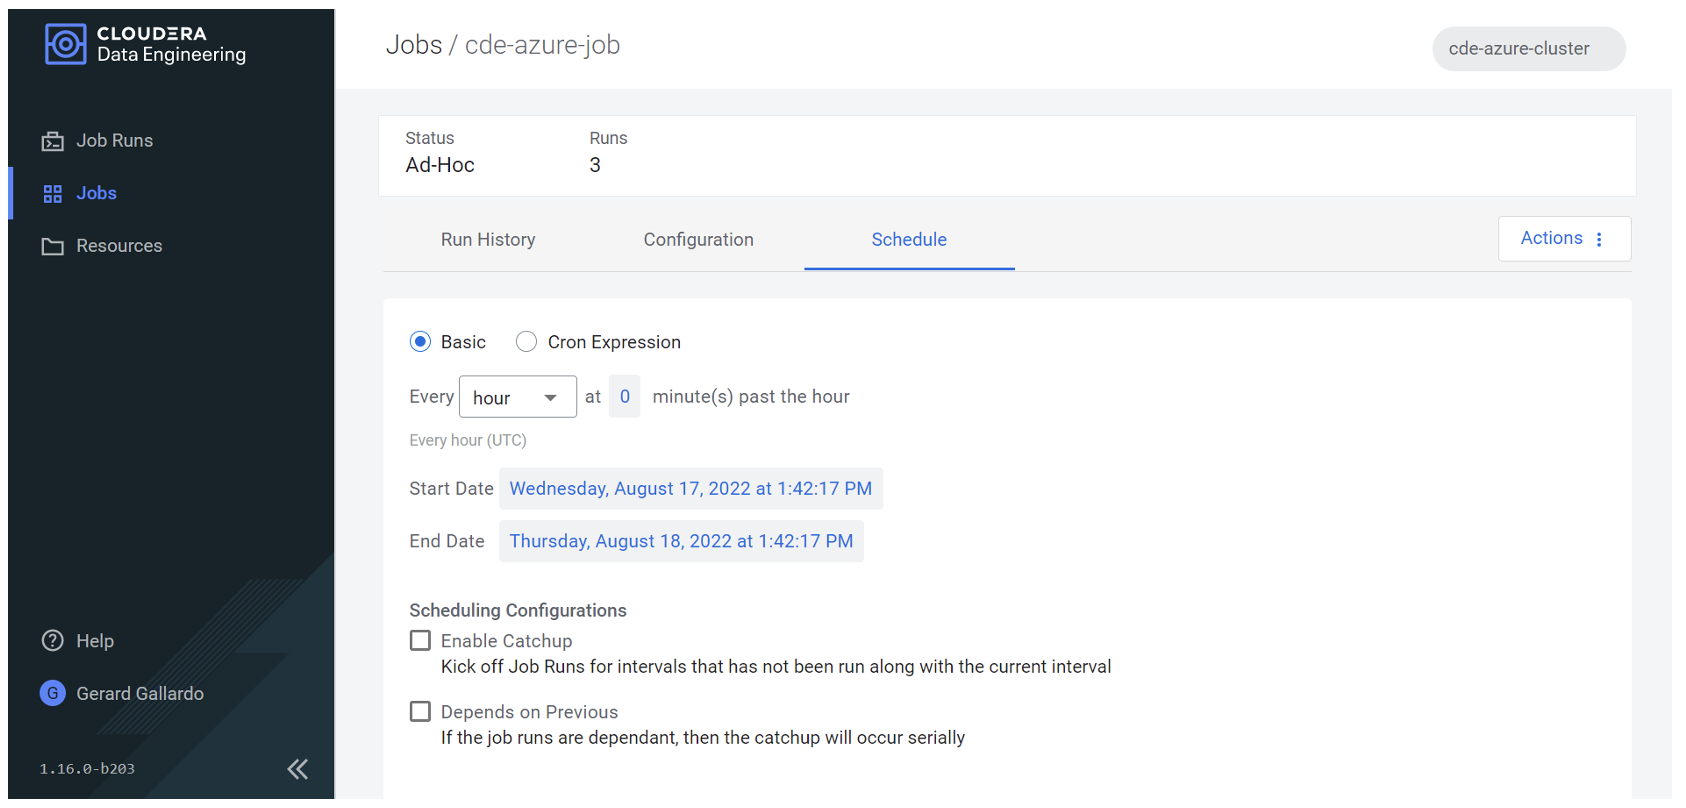
Figure 9: Defining the CDE job schedule
Running Spark Jobs with Airflow
Now that we know how to create Spark jobs, let´s see how to combine them with Airflow jobs.
To demonstrate, we created two ETL Spark jobs that perform tasks similar to those in the previous example:
- ETL-Spark-Job.py: The first Spark script oversees reading the content of an access-log.txt file from an Azure Storage Account container, carrying out minor modifications to the file contents and performing some SQL queries to analyse the content of this new file, before finally writing back the results as a new file in the same Azure Storage Account container.
- ETL-Spark-Job-2.py: This second file is responsible for reading the file saved by the previous Spark script and for performing additional SQL queries to further analyse its content.
We can combine these two files into a workflow, integrated with a DAG file containing 2 different CDEJobRunOperators that will execute 2 different ETL tasks as Spark jobs in CDE. Below is an example of the DAG file:
import pendulum
from dateutil import parser
from datetime import datetime, timedelta
from datetime import timezone
from airflow import DAG
from cloudera.cdp.airflow.operators.cde_operator import CDEJobRunOperator

default_args = {
    'owner': 'gerard',
    'retry_delay': timedelta(seconds=5),
    'depends_on_past': False,
    'start_date': pendulum.datetime(2022, 1, 1, tz="Europe/Amsterdam")
}

example_dag = DAG(
    'airflow-pipeline-demo',
    default_args=default_args,
    schedule_interval=None,
    catchup=False,
    is_paused_upon_creation=False
)

ETL_task_1 = CDEJobRunOperator(
    connection_id='cde-azure-cluster',
    task_id='ETL_1',
    dag=example_dag,
    job_name='access-logs-ETL'
)

ETL_task_2 = CDEJobRunOperator(
    task_id='ETL_2',
    dag=example_dag,
    job_name='access-logs-ETL-2'
)

ETL_task_1 >> ETL_task_2
As we can see in the last line of the file, it’s essential to assign priorities among the different jobs to define the correct order of execution. In our case, we run ETL_task_1 before ETL_task_2.
Note that our DAG has the schedule_interval set to “None”, meaning the job is run on demand and not scheduled. The scheduling process will be discussed in the following section.
Now that our DAG file is ready, we can create and run the Airflow job, as shown below:
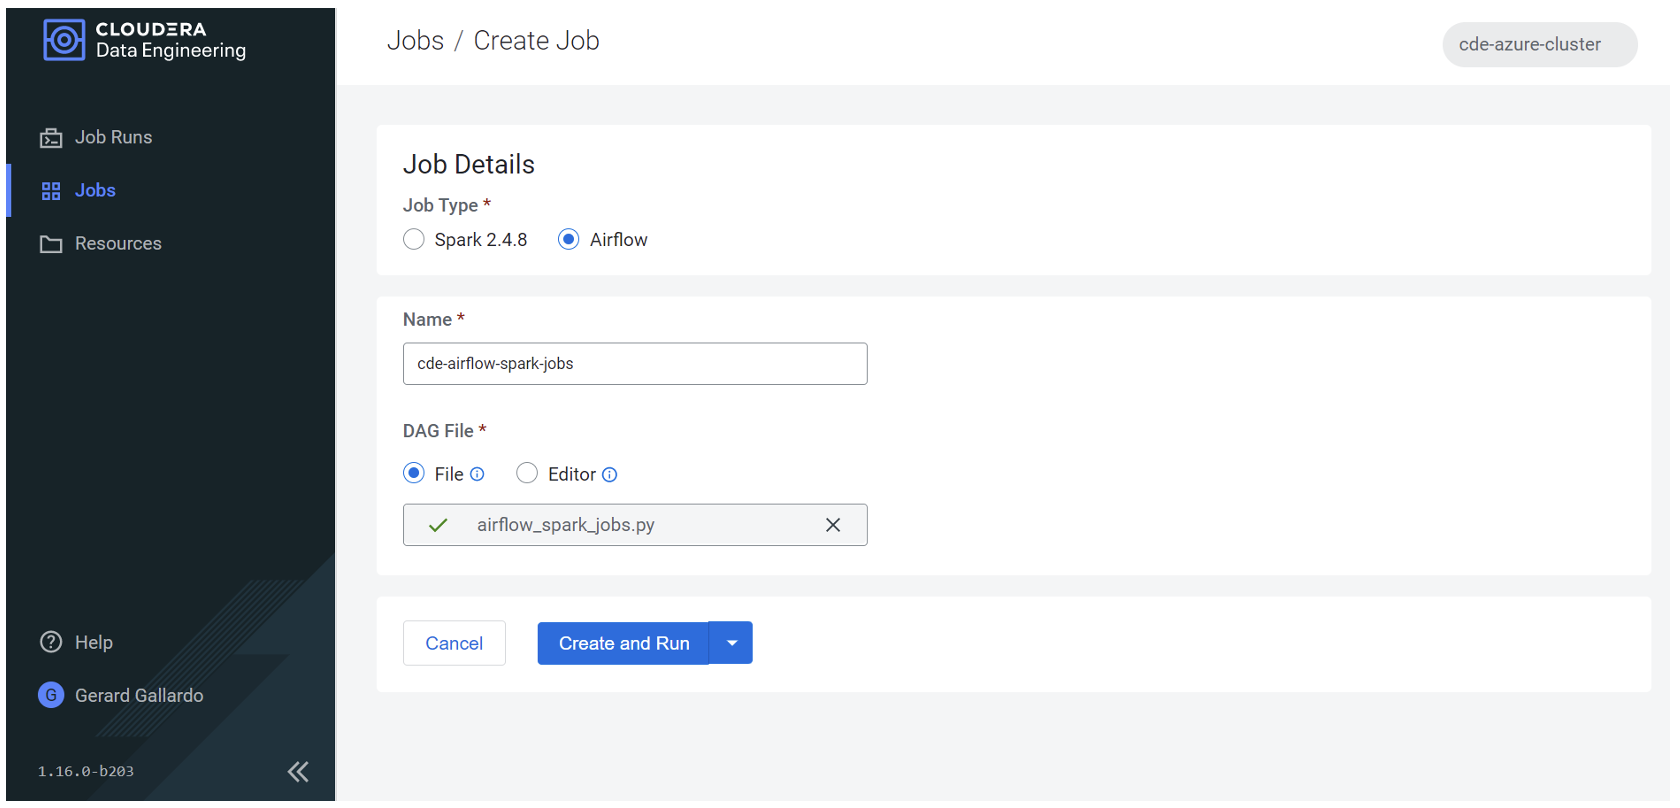
Figure 10: Creating an Airflow job
After letting it run, we can see that it has correctly executed both our Spark jobs:
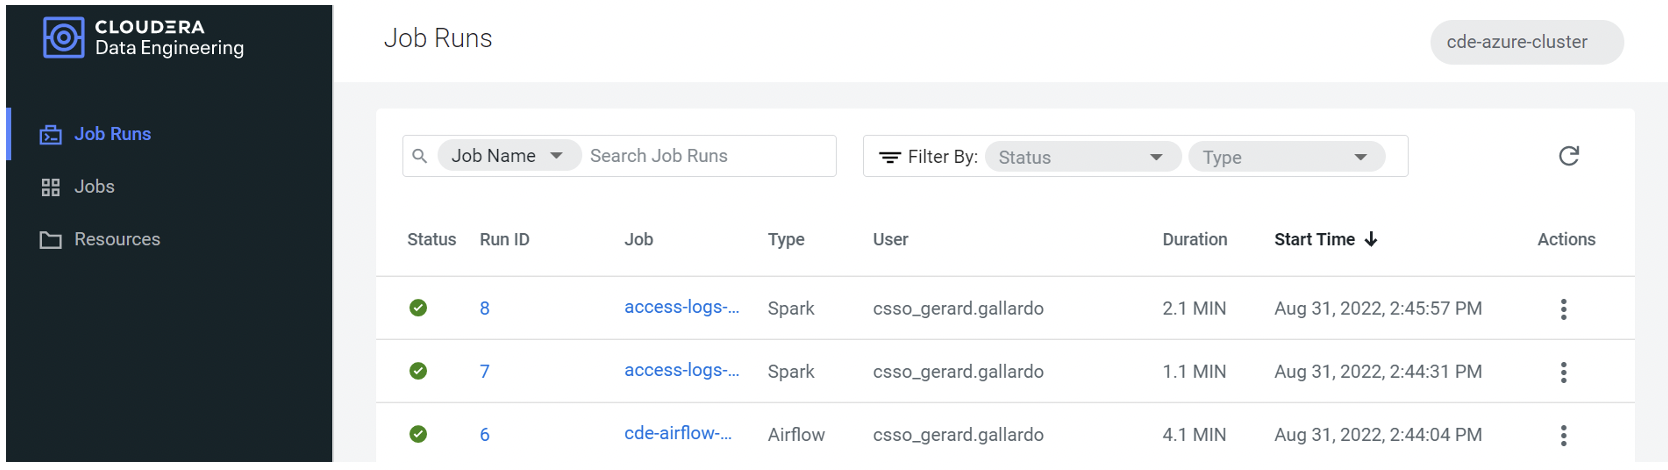
Figure 11: Status overview of the Airflow execution
Apart from looking at the details and the logs of the specific jobs, we can also navigate to the Airflow UI for more details about the workflow itself:
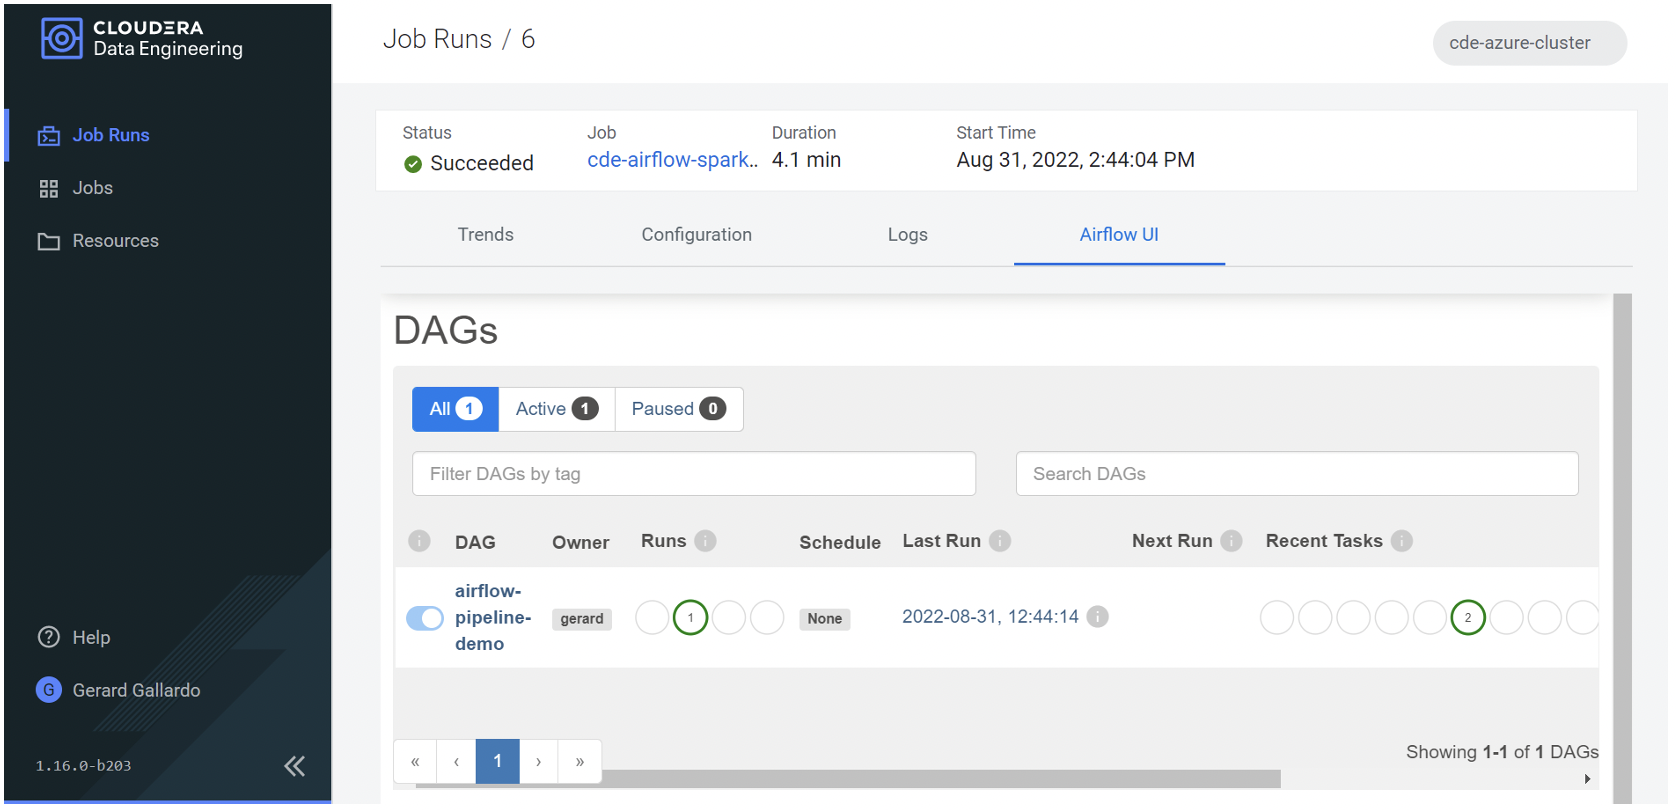
Figure 12: Airflow UI overview
In the Tree, Graph and Gantt tabs we can see that, as indicated in our DAG file, ETL_1 – corresponding to the job access-logs-ETL – is executed first. Once this job has finished, ETL_2 – corresponding to the job access-logs-ETL-2 – starts:
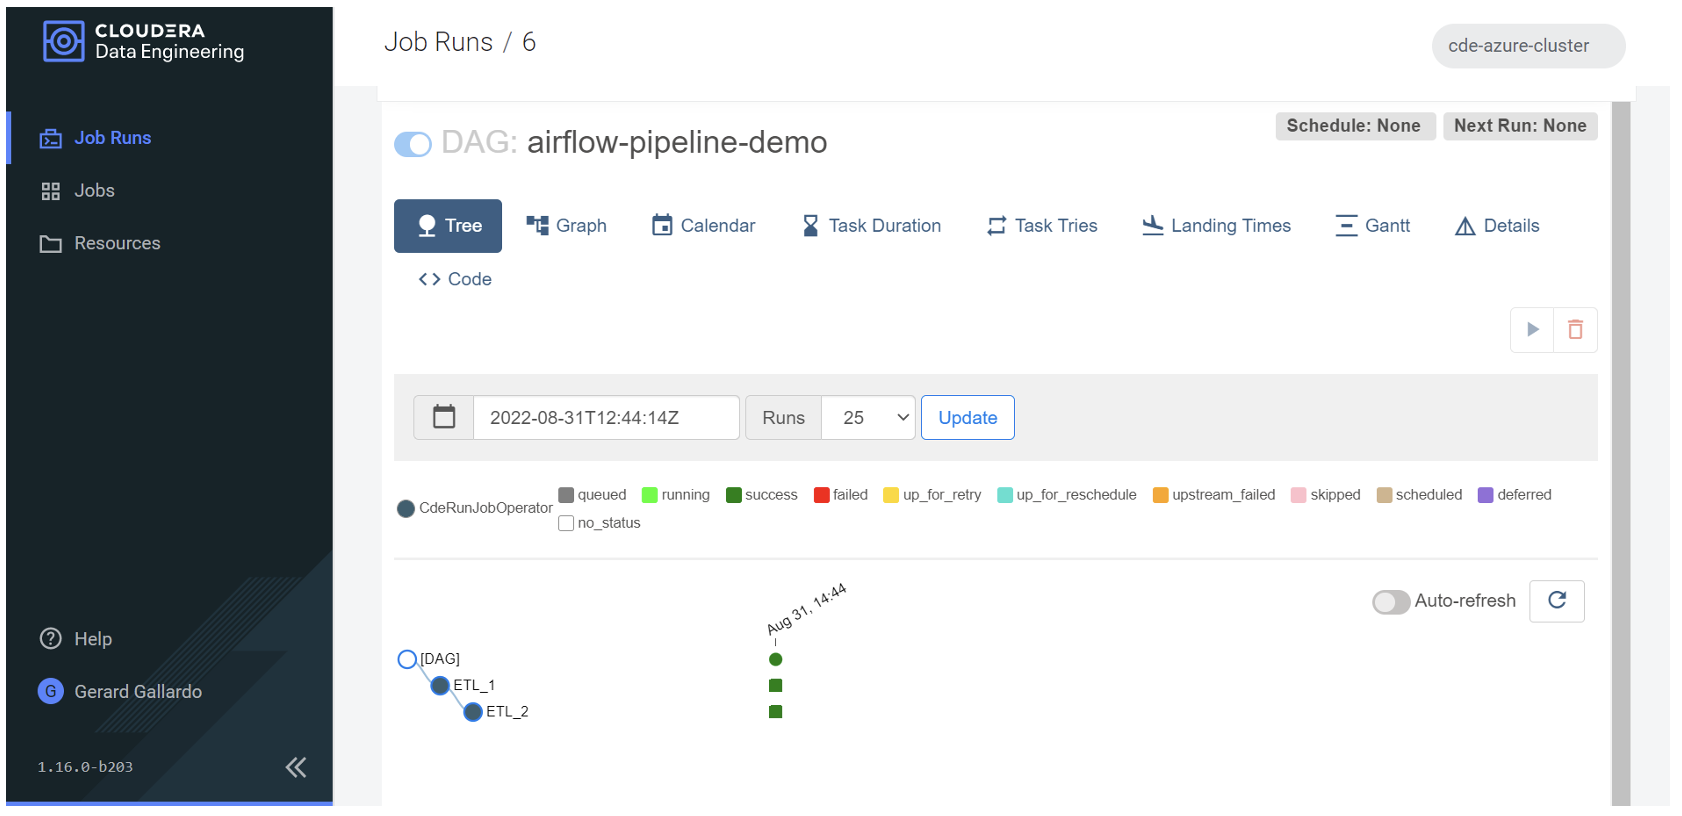
Figure 13: GUI of the DAG in Airflow
We can also observe more details about the execution times in the Gantt tab:
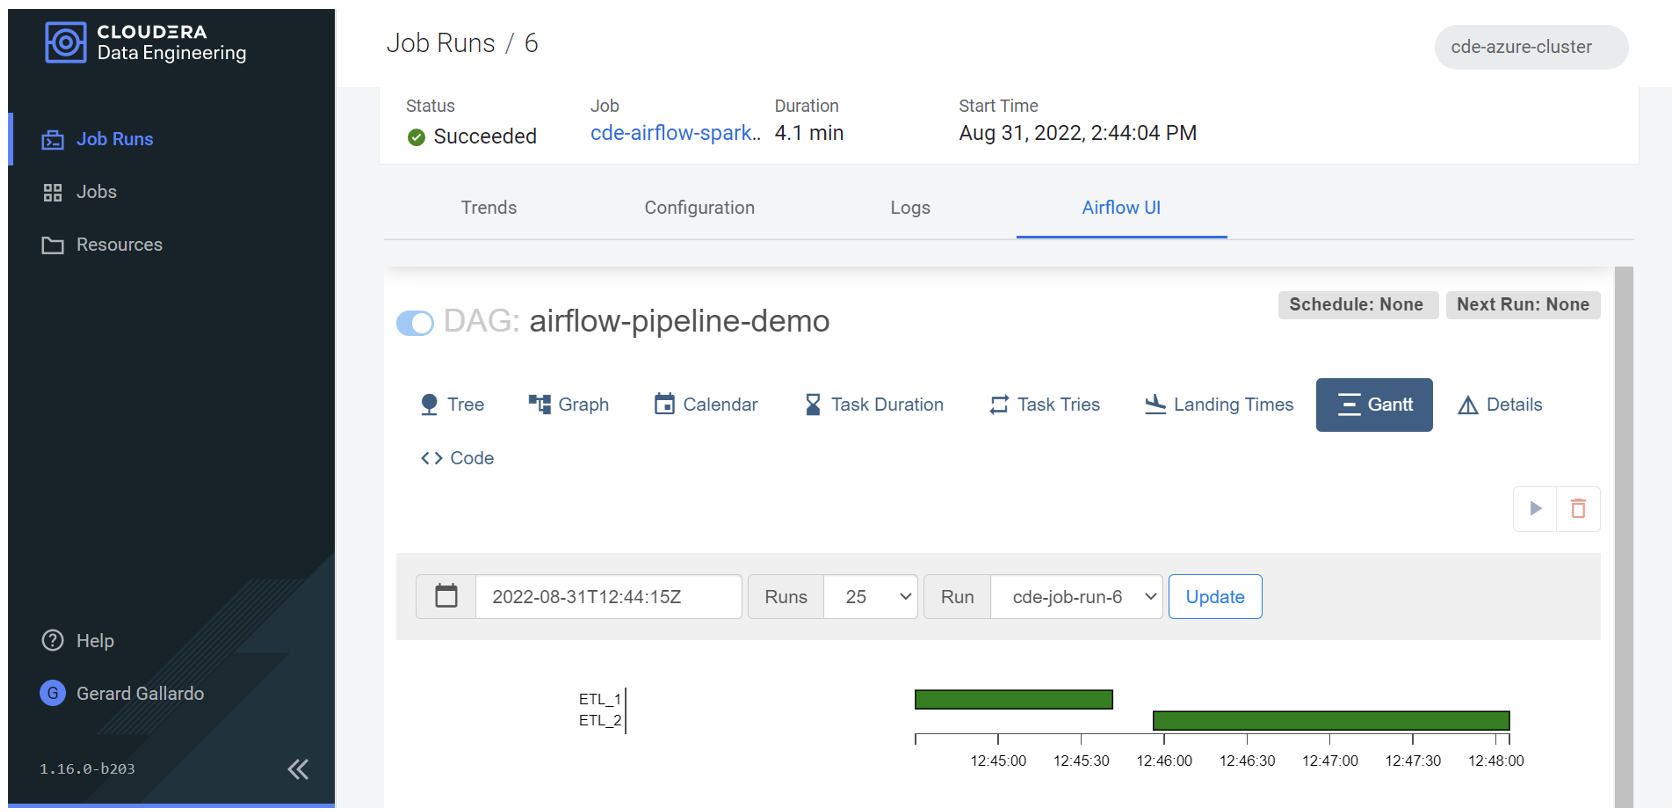
Figure 14: Gantt view of the executed jobs
Finally, if we want to take a look at the DAG file code to review the workflow itself, we can do so by navigating to the Code tab:
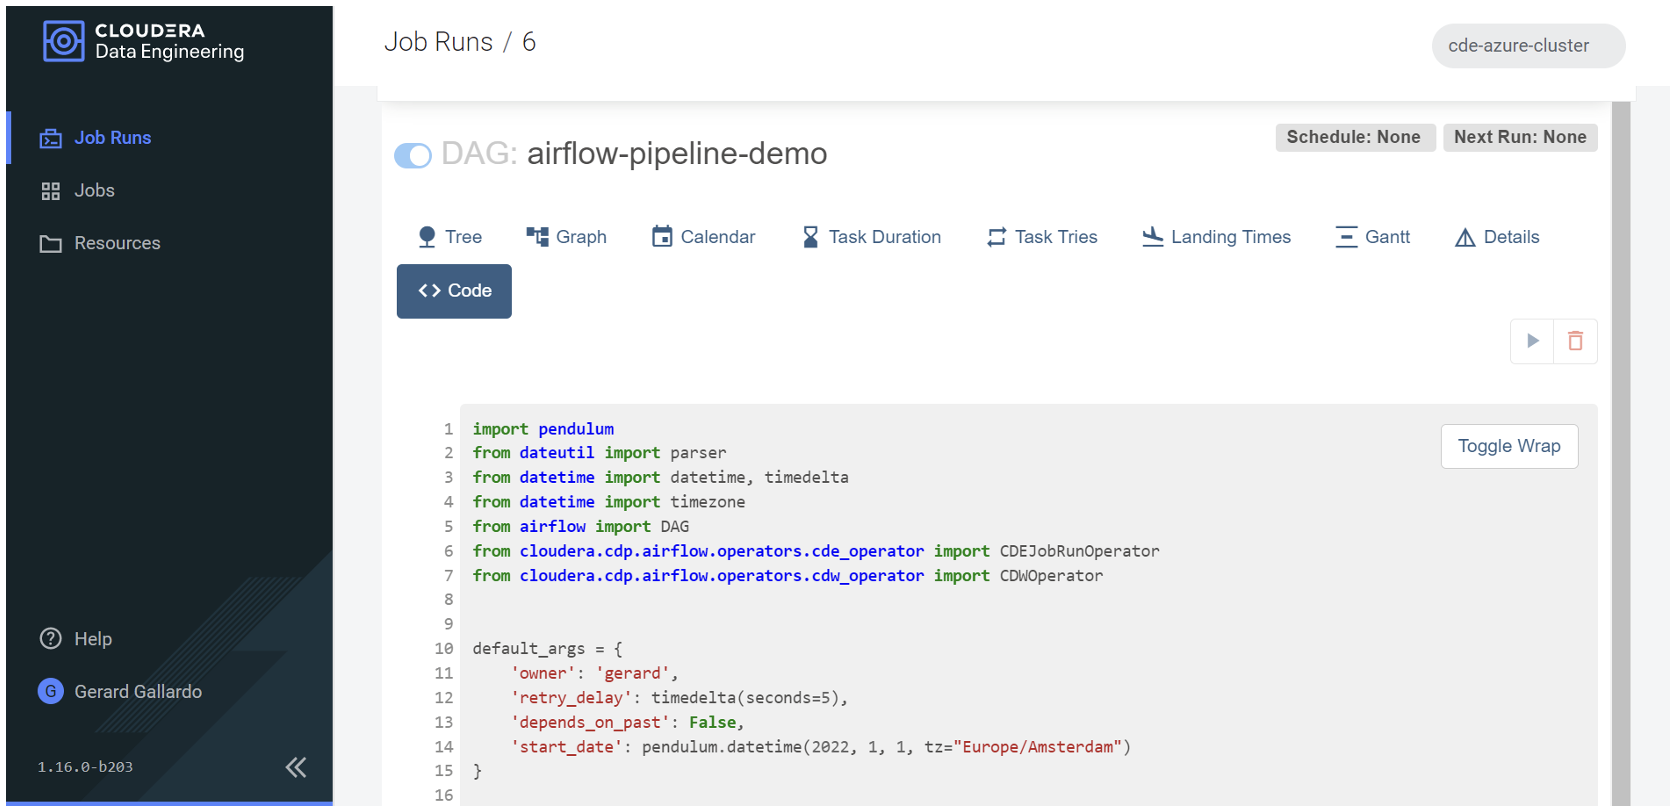
Figure 15: Reviewing the code of the scheduled job
Mixing Spark Jobs and CDW Queries
Apart from Spark jobs, what if we want to add CDW queries to run in the same Airflow pipeline? In this section, we’ll describe the different options available.
Creating a Connection to CDW
First of all, we need to create a connection to an existing CDW warehouse.
To do so, we navigate to the Cloudera Data Warehouse Overview page by clicking on the “Data Warehouse” tile in the Cloudera Data Platform (CDP) management console, and in the Virtual Warehouses column we find the warehouse we want to connect to (if there isn’t a warehouse, we must create one).
We click on the three-dot menu on the right, select “Copy JDBC URL”, and note down the hostname (in the example below, the hostname portion of the following JDBC URL is shown in italics):
jdbc:hive2://<your.cloudera.warehouse.hostname>/default;transportMode=http;httpPath=cliservice;socketTimeout=60;ssl=true;retries=3;
To create a connection to an existing CDW virtual warehouse via the embedded Airflow UI, start by navigating to the Cloudera Data Engineering Overview page. From there select the service that contains your virtual cluster, and in the Virtual Clusters column, click on “Cluster Details”. Next, access the “AIRFLOW UI” and, within this interface, find and click on the “Connection” link from the Admin dropdown menu. Finally, click on the “+” sign to add a new record and fill in the necessary fields to set up the connection, as shown below:
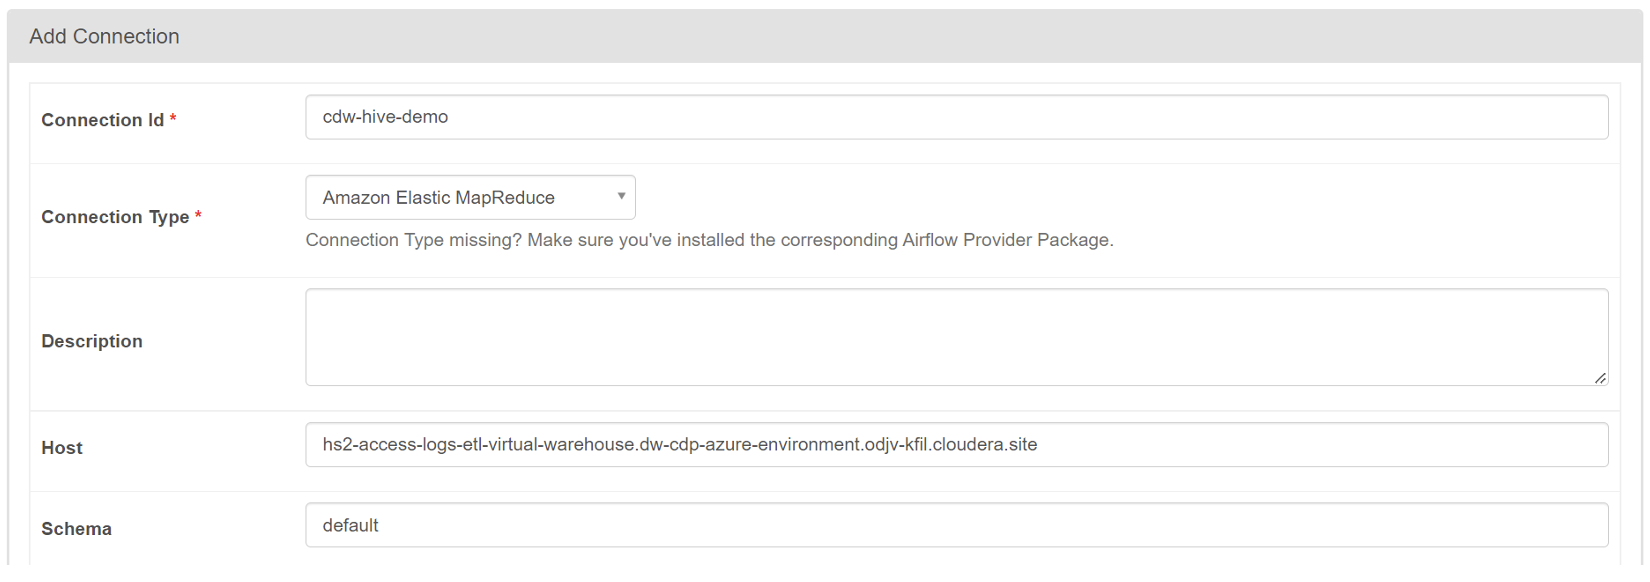
Figure 16: Creating a connection to a CDW warehouse
After clicking on “Save”, we can see our newly created connection listed in the Airflow UI, like in this screenshot:
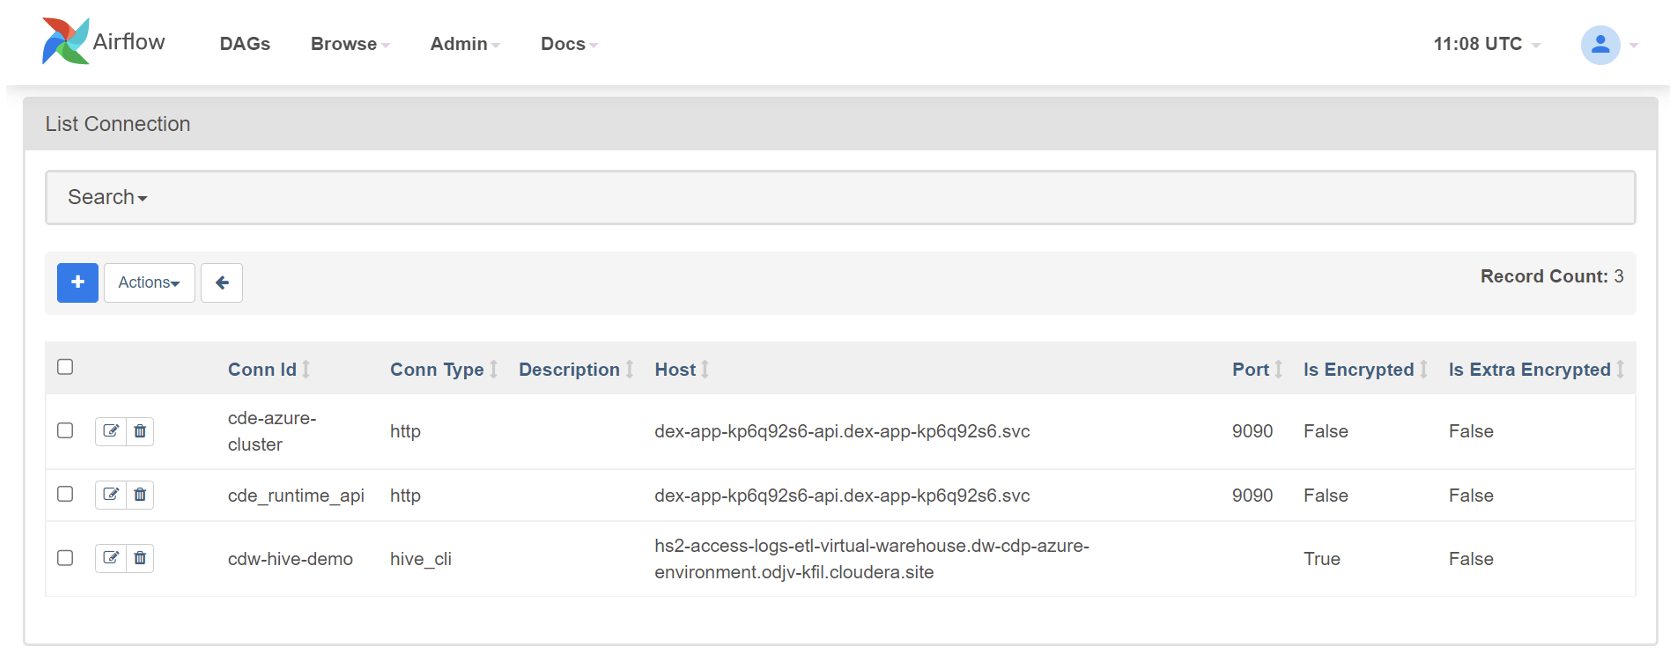
Figure 17: Available CDW connection in the Airflow UI
Using a DAG File
With our CDW connection now established, there are various options for scheduling CDW queries. One effective method is to create an Airflow DAG file, like the one we previously developed; you can see an example below. It’s important to note the added import statement at the beginning, and how the CDWOperator includes core details of the query: the hql value contains the actual select statement, while the cli_conn_id value points to the ID of our new CDW connection. Lastly, the dependency chain is updated at the end to incorporate this new query:
from cloudera.cdp.airflow.operators.cdw_operator import CDWOperator

...

cdw_query = """
Select count(*) as RecordCount from retail.tokenized_access_logs;
"""

cdw_query = CDWOperator(
    task_id='dataset-etl-cdw',
    dag=example_dag,
    cli_conn_id='cdw-hive-demo',
    hql=cdw_query,
    schema='default',
    ### CDW relted args ###
    use_proxy_user=False,
    query_isolation=True
)

ETL_task_1 >> ETL_task_2 >> dw_step3
At this point, we use the new updated DAG file to create and run our CDE Airflow job, just like we did before. After completion, we can examine the results and confirm that the CDW job has been correctly executed:
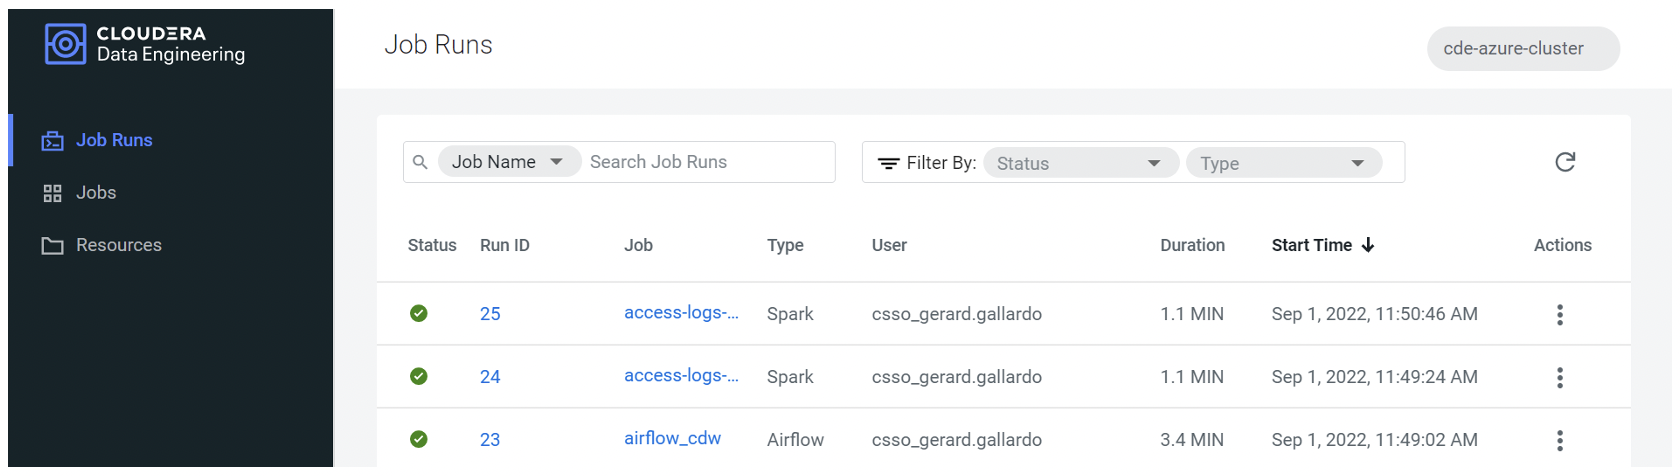
Figure 18: CDW query being executed together with the Spark tasks in the scheduled Airflow job
Just like our previous example, this DAG file does not come with a pre-assigned schedule. If we want to schedule our Airflow job, we can assign a specific value to the schedule_interval property. For instance, setting it to timedelta(minutes=5) will ensure our Airflow job runs every 5 minutes (more details about how to set an interval are available here).
If we actually make the change and re-create the job in Airflow, we can see it labelled as “Scheduled”:
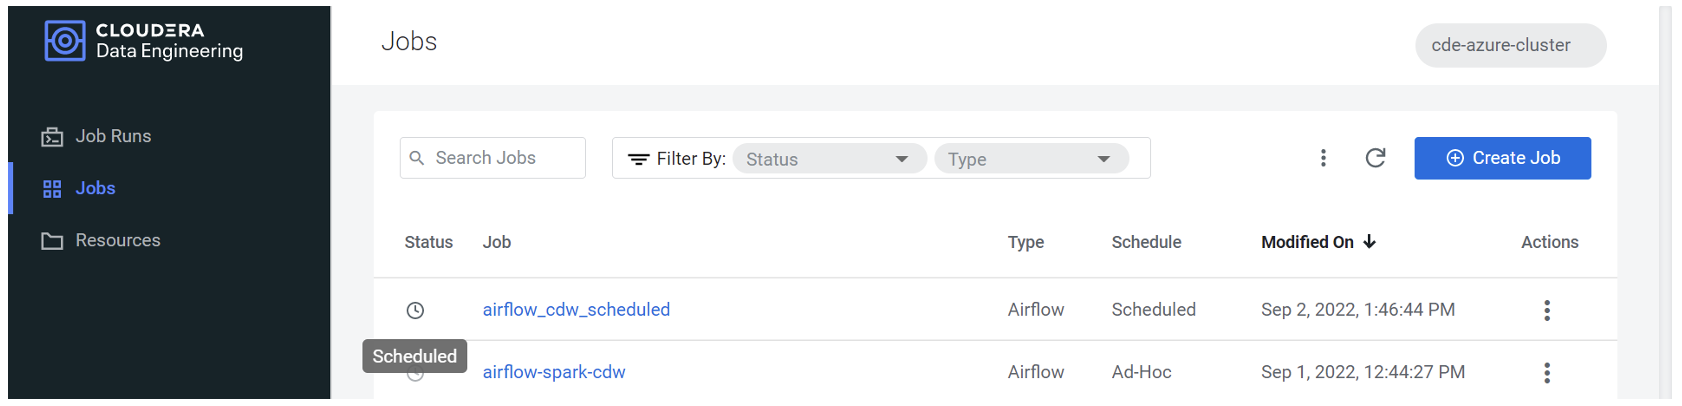
Figure 19: a “Scheduled” job in Airflow
Effectively, it does run every 5 minutes, as we can see here:
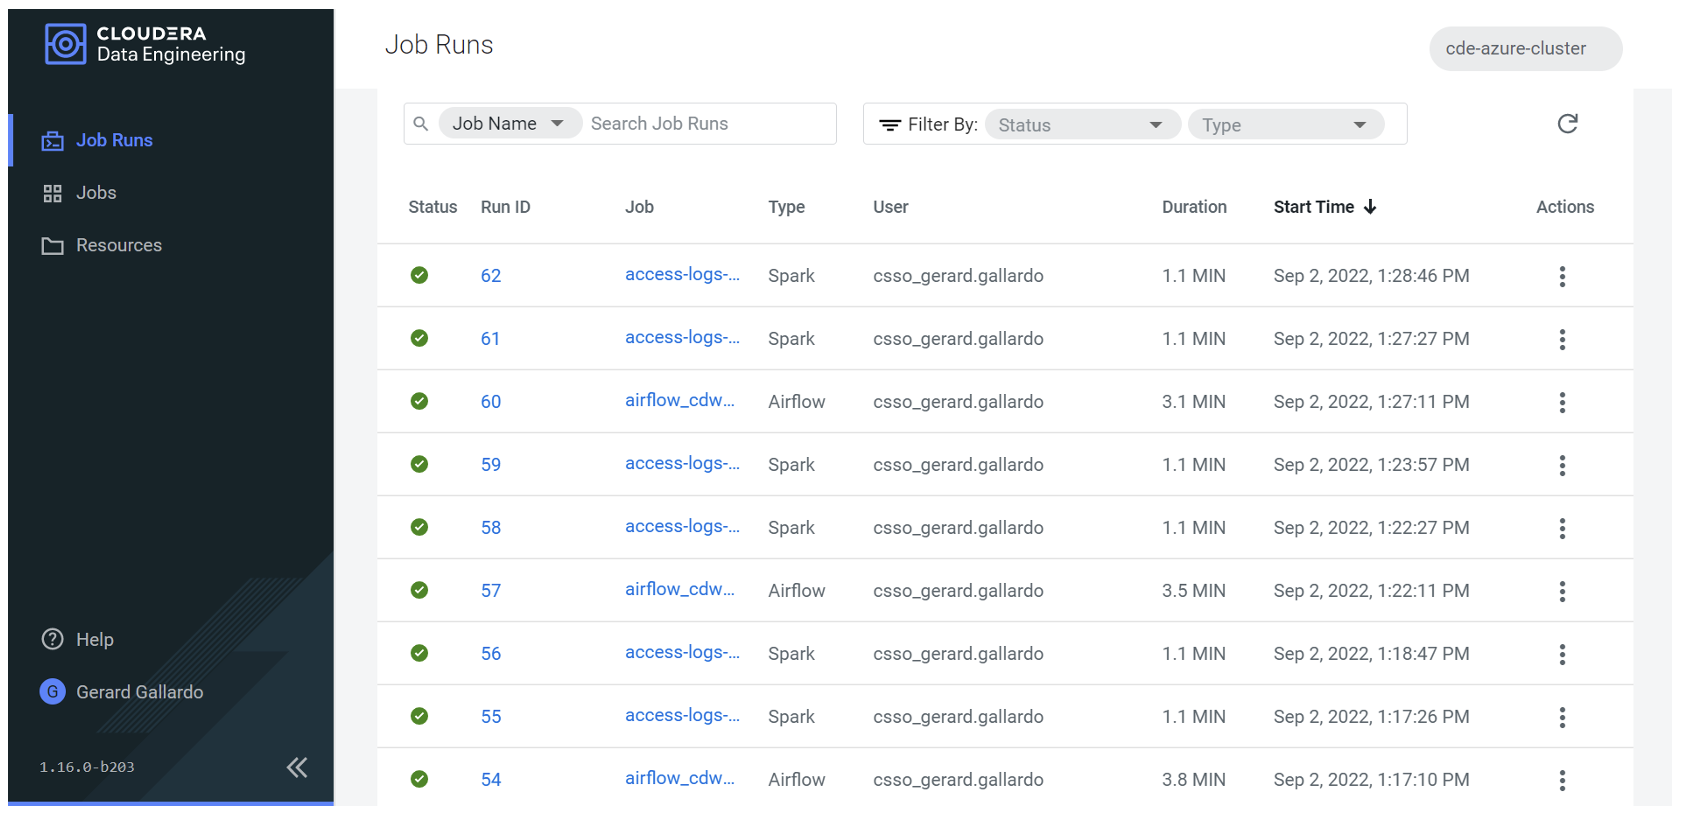
Figure 20: Multiple runs of a scheduled job in Airflow
Using the Airflow UI
One of the nicest features about Airflow is the ability to orchestrate jobs using a GUI. Could the above process be replicated using the Airflow graphical editor instead of using DAG files? The answer is yes!
As we can see below, configuring our job in the Airflow editor is very easy. We can select shell scripts, Python scripts, but most importantly both the CDE Job and CDW Query are available for inclusion in our flow:
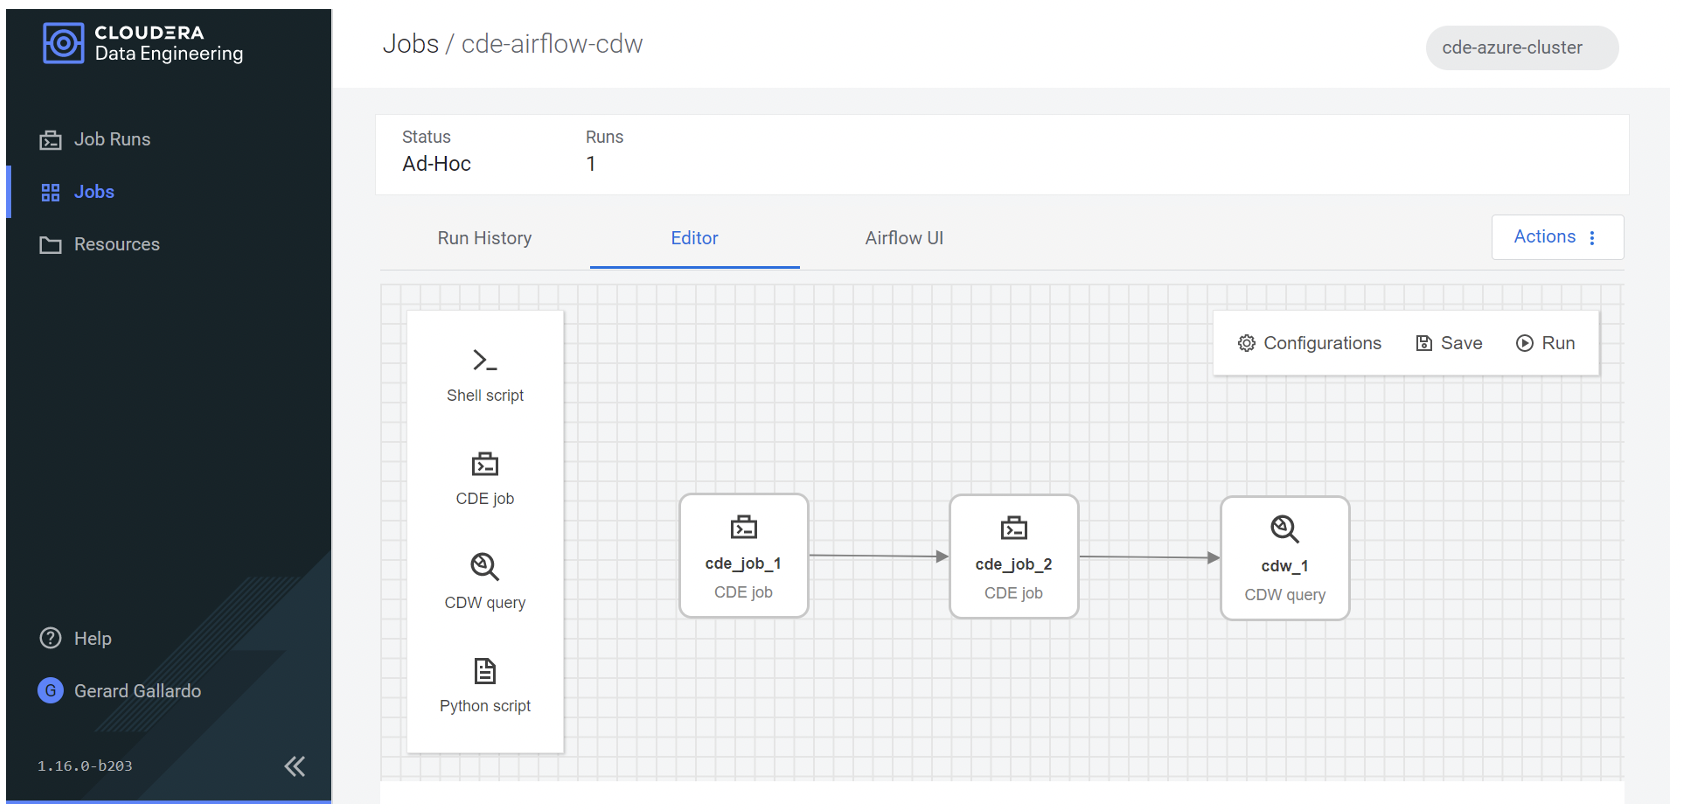
Figure 21: Our Airflow job built using the GUI
This first CDE job corresponds to the access-log-ETL Spark job from our previous example; by clicking on it we can see the details we used to create it. Similarly, the second CDE job corresponds to the access-log-ETL-2 Spark job:
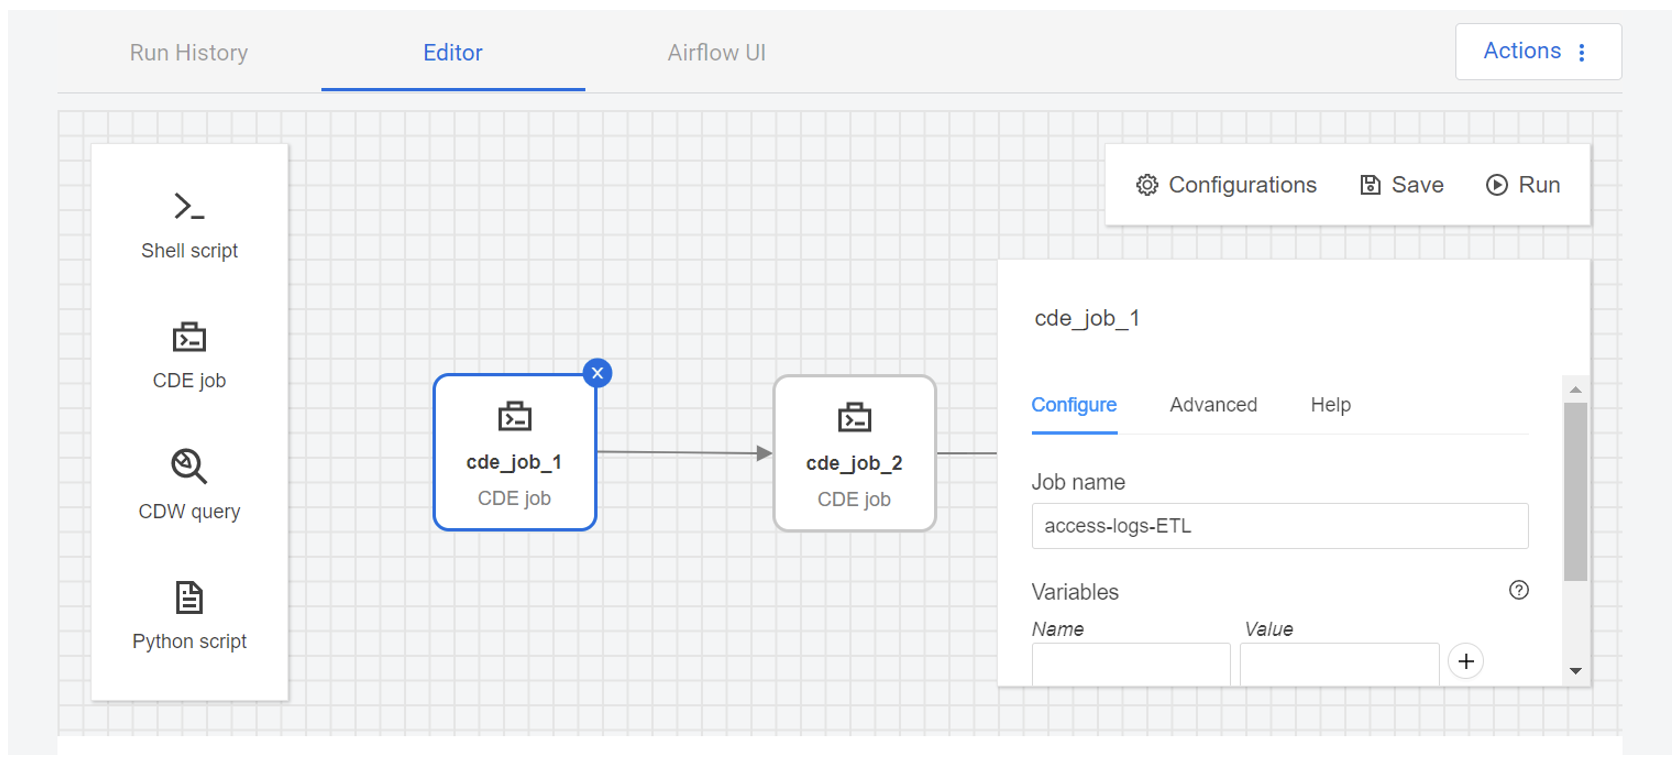
Figure 22: Details of the first Spark job in the Airflow GUI
The CDW query corresponds to the one we used in the last step of our previous DAG file. As illustrated below, we have inserted the query directly into the editor. Other configurable options, such as the CDW connection, are also available for customisation:
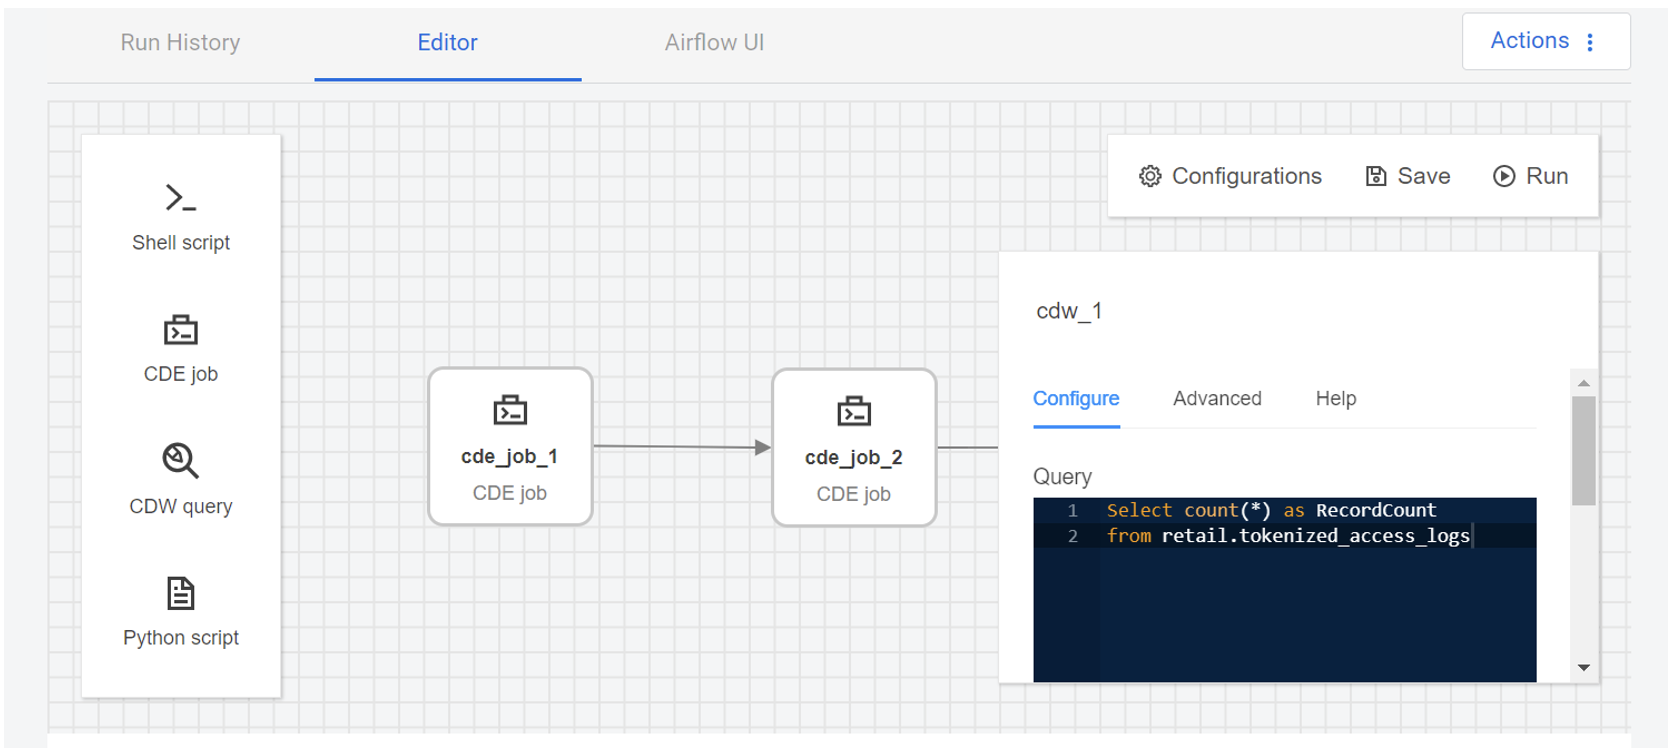
Figure 23: Details of the CDW query in the Airflow GUI
Once the job has been created, we can still access all the details and information about job configurations, schedules and runs that was available before. For example, we can see the Tree view of the jobs, their related graphs, the execution calendar, timeline, and so on:
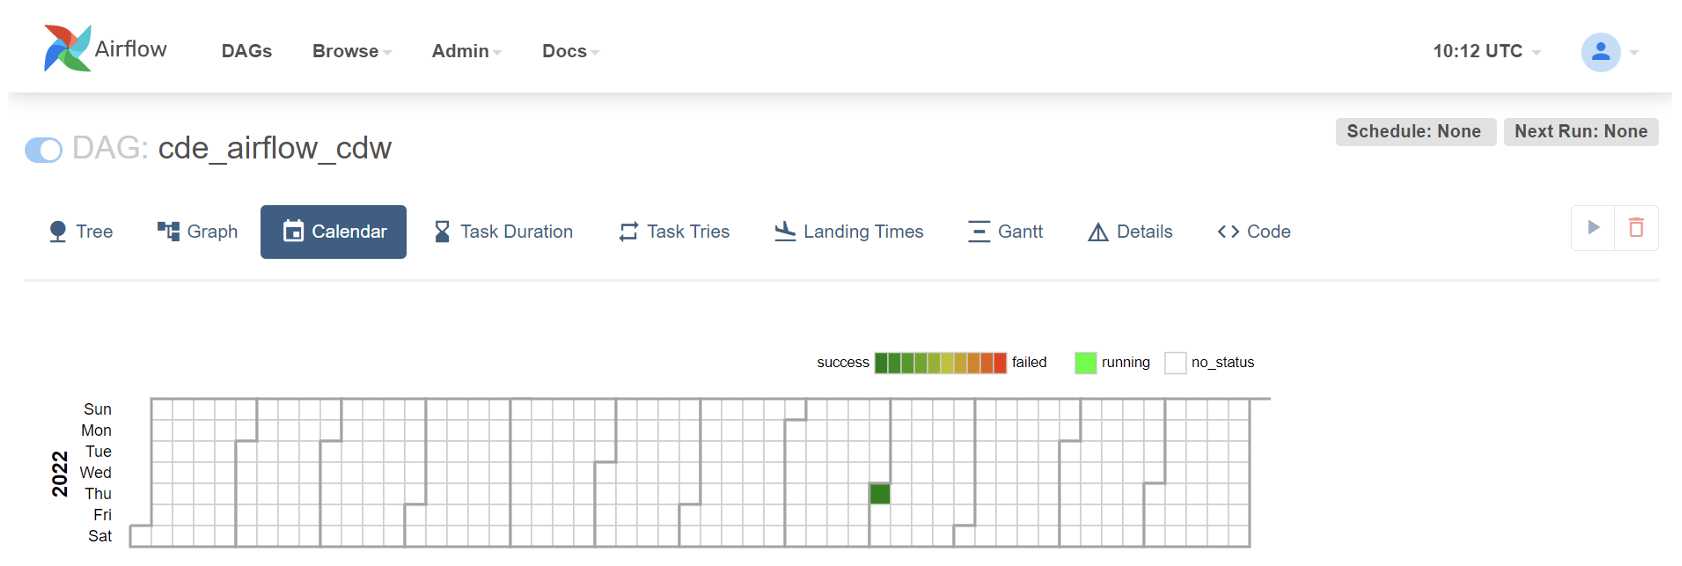
Figure 24: Calendar view of the Airflow job
By clicking on the “Code” tab, we can even see the actual DAG, based on the job we created in the editor, but automatically generated!
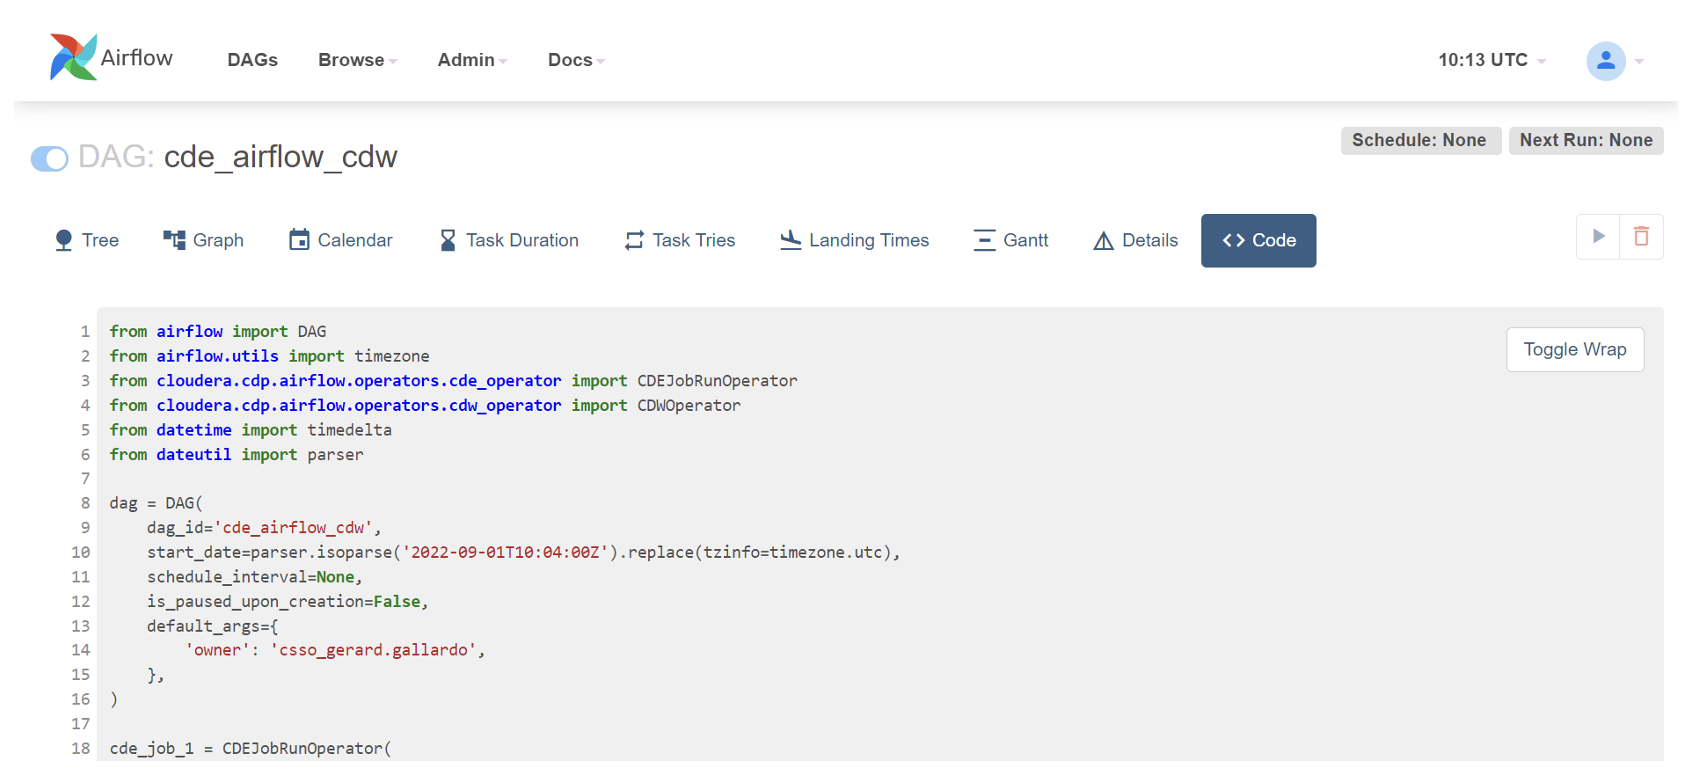
Figure 25: Auto-generated DAG file
From this point onwards, we can edit the job as much as we like. For example, below we can see a scenario where we schedule 3 parallel CDW queries to run after the second Spark job:
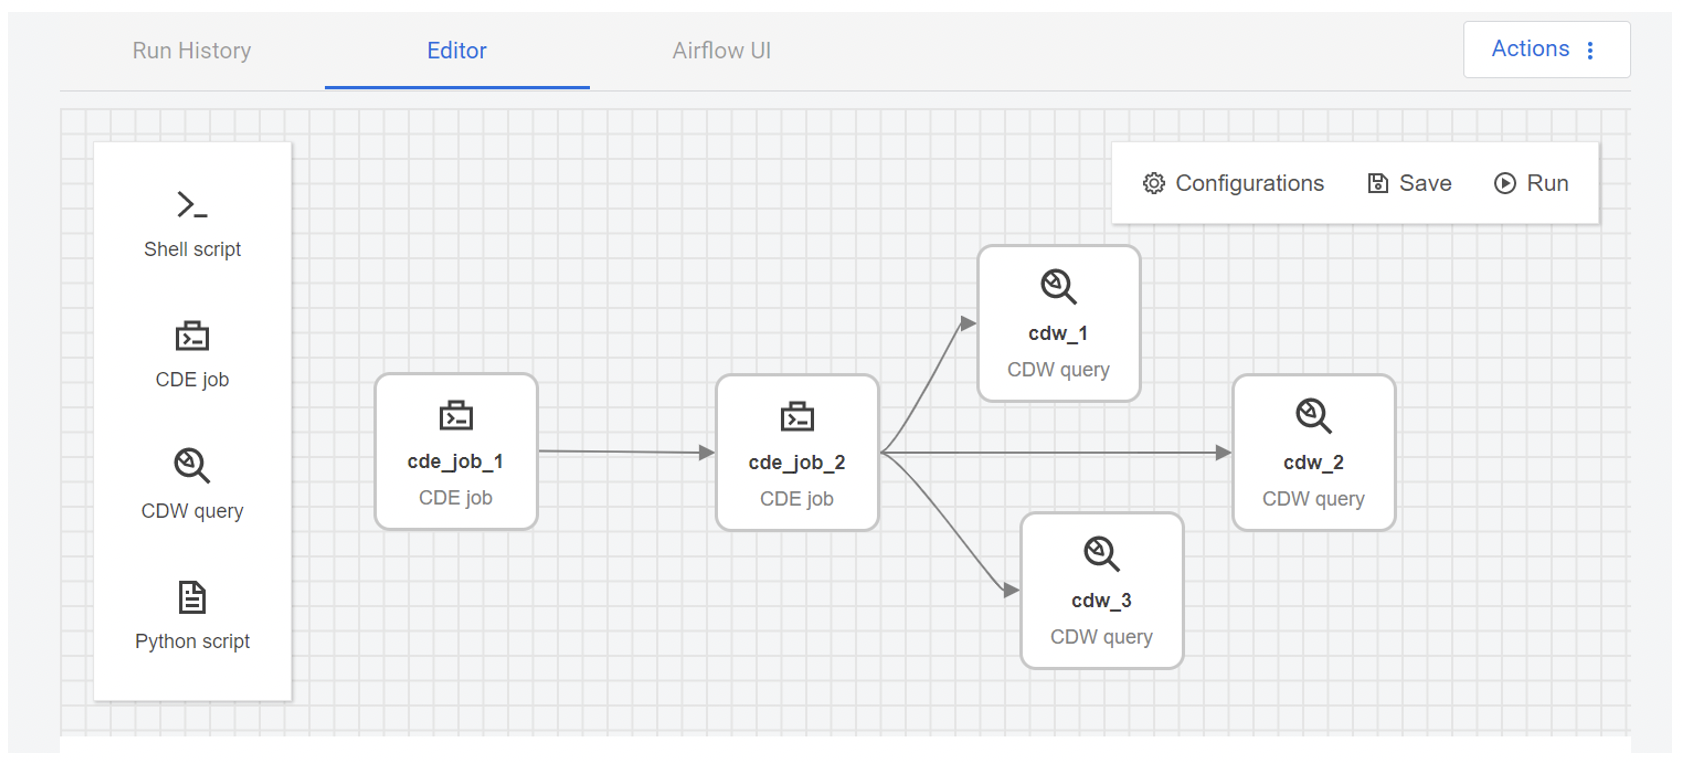
Figure 26: Updated Airflow job with multiple parallel steps
Conclusion
This blog post concludes our explorative series on some of the main Cloudera Public Cloud services. Today we’ve seen the potential of CDE, showing you how easy it really is to spin up auto-scaling Spark clusters and orchestrate data engineering jobs and CDW queries with its very user-friendly interface.
Together with other services such as CDW and CDF (that we’ve already covered) or CML, this offers a comprehensive one-stop shop for all your data needs. Now we highly recommend that you take a look at our webinar to see a full end-to-end demo of these tools in action on Cloudera Public Cloud.
Remember, though, that these tools are continuously evolving, and regular updates are released publicly to cover the most requested use cases or features. For example, Apache Iceberg is already a stable presence in the Cloudera stack, as more and more users adopt it for their workloads – and we predict it will become the de facto standard for your table formats, so you should probably have a look at what it offers! CDF is also being enhanced, and since our webinar and blog post were released there have been many interesting updates! For instance, with CDF 2.4, you can now use a DataFlow Designer as well as – you guessed it – a PutIceberg processor!
At ClearPeaks, as proud Cloudera partners, we are working on countless projects using their technologies, both on premise and on cloud. Should you have any questions or doubts, or if you are just interested in learning more about them, do not hesitate to contact us. Our certified experts will be happy to help you!