26 Oct 2023 External Tools in Power BI Desktop
Power BI external tools are third-party apps that are registered and available in Power BI Desktop.
There is a large community of business intelligence professionals and developers who are creating tools that use Power BI APIs to integrate with and enhance Power BI Desktop’s reporting and data modelling capabilities, enabling you to work more efficiently.
In this article, we will show you some of the top third-party tools available to help you choose the one that best suits your needs. At the same time, we hope to encourage you to explore, to experiment with, and to use them to unlock the full potential of Power BI.
External Tools Integrated with Power BI
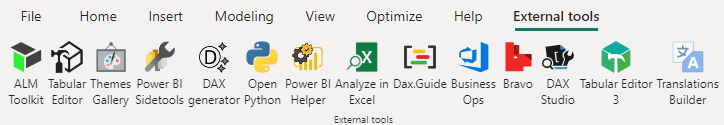
These tools are installed locally and integrated into Power BI Desktop using the External Tools ribbon. When you launch one from the External Tools ribbon, Power BI Desktop provides the tool with the name and port number of its internal data model engine instance as well as the current model name, allowing the tool to connect automatically, thus ensuring a seamless connection experience.
If you don’t see the External Tools ribbon, you will need to update to the latest version of Power BI Desktop and have at least one external tool installed.
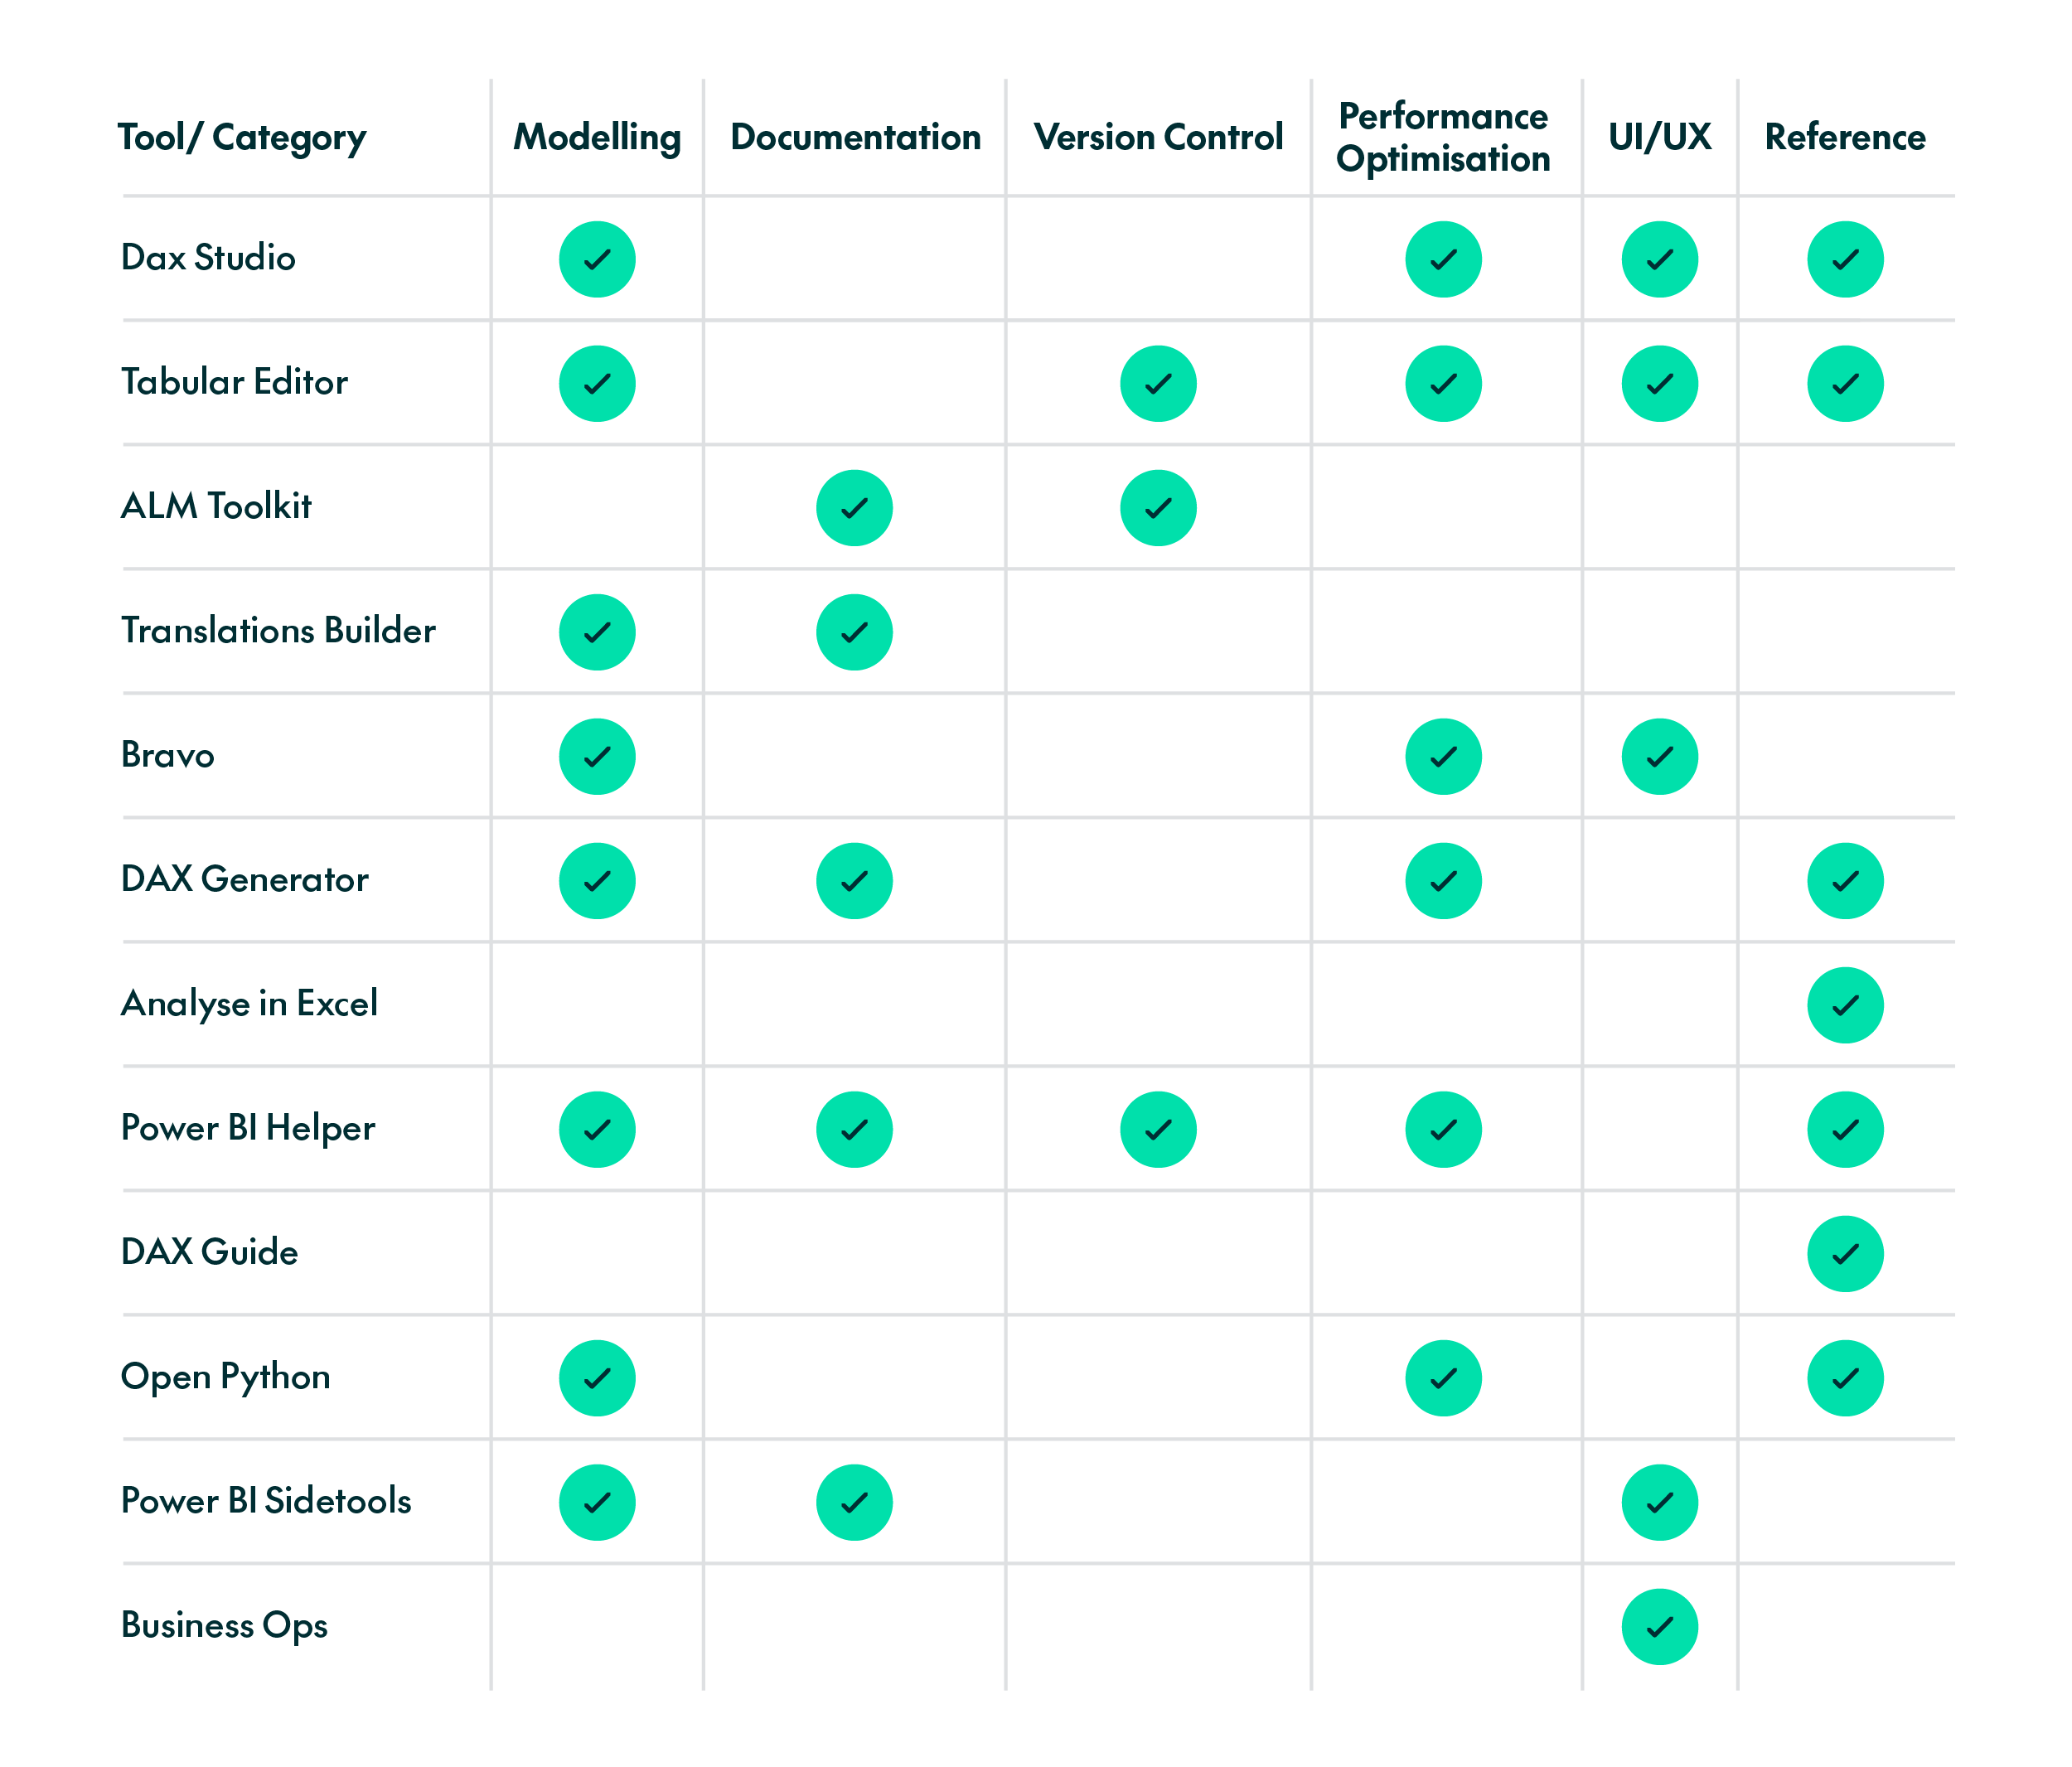
Classification
External tools for Power BI can be classified into different categories based on their purpose and functionalities. Some tools may belong to multiple categories:
- Modelling: To help you create more advanced and efficient data models.
- Documentation: To better understand and document your Power BI projects.
- Version Control: To manage different versions of data models.
- Performance Optimisation: To improve performance – these tools may provide features that help to optimise queries, to reduce data refresh time, and to manage memory usage, leading to faster and more efficient data analysis.
- User Interface (UI) / User Experience (UX): These tools provide an interface to interact with Power BI and to enhance the user experience while working with the program. They may offer a more intuitive and user-friendly way to access certain functionalities, or improve the visualisation and organisation of information.
- Reference: Tools that provide reference documentation, tutorials, libraries, and other resources to help you work with data models.
Here’s a list to help you to choose the most appropriate third-party tool to improve your work:
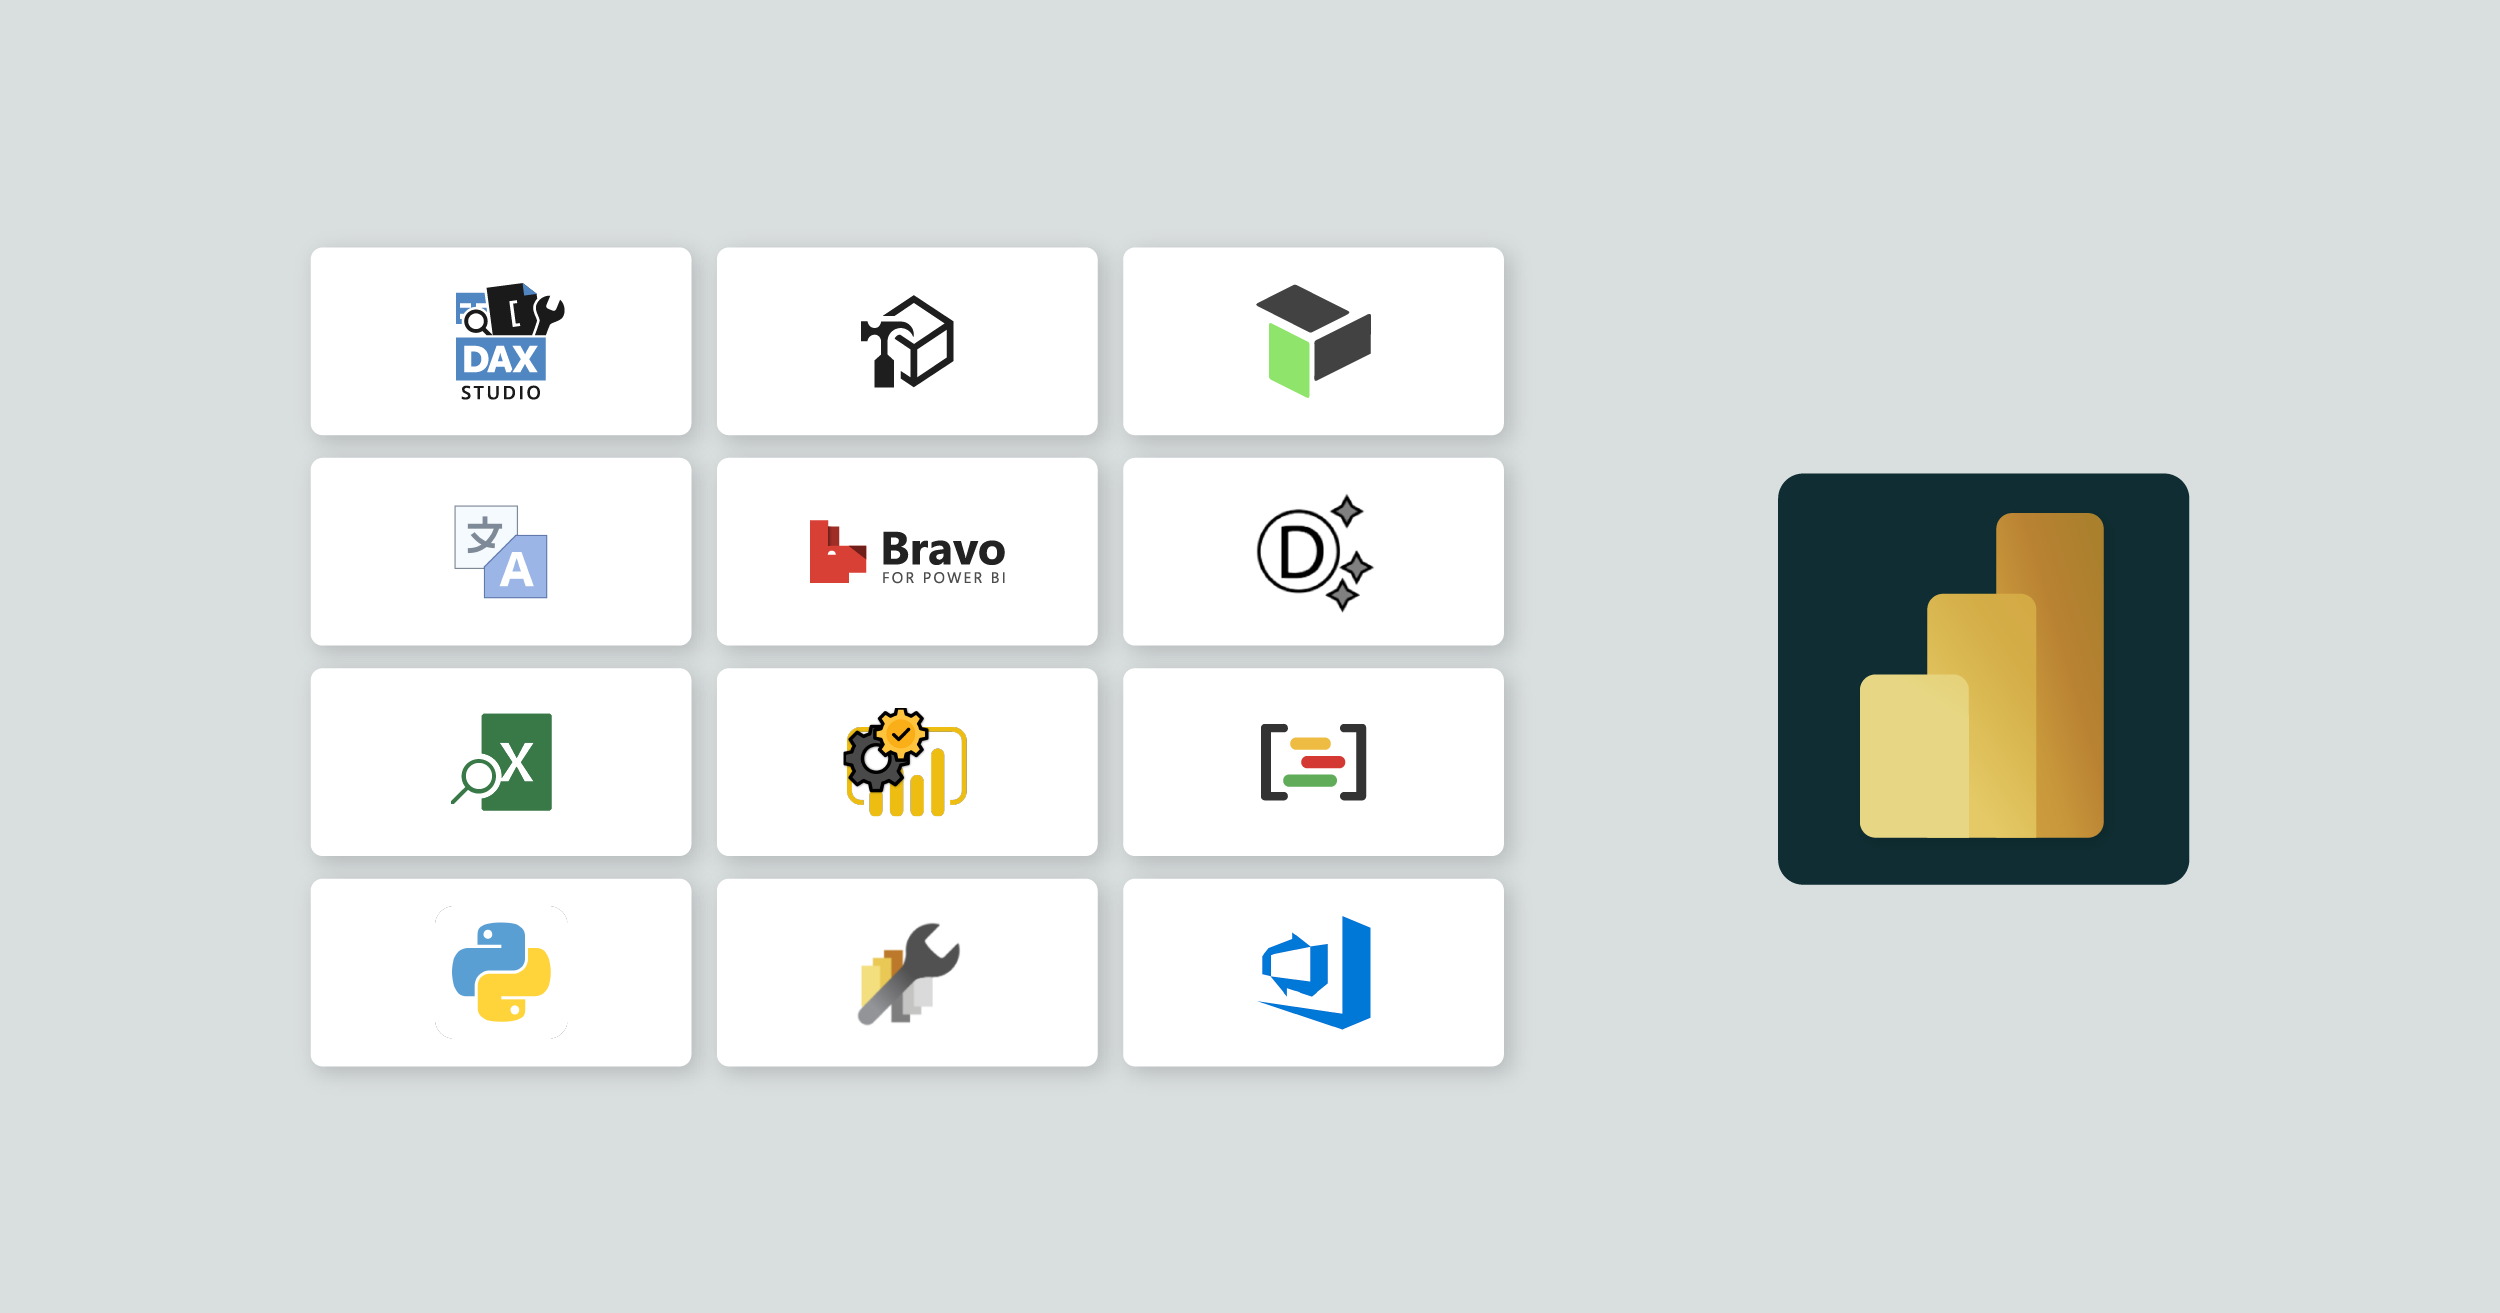
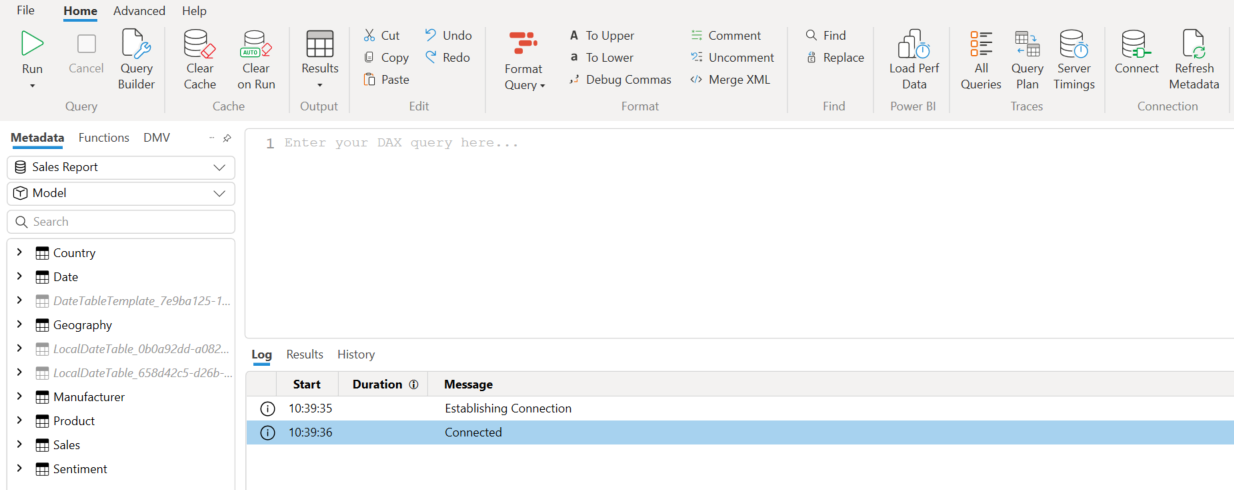
DAX Studio
One of the most popular external tools, DAX Studio is a free, open-source tool for writing, executing, and analysing DAX queries. It is very useful when working with large datasets or complex DAX formulas, as it allows you to analyse and optimise your DAX queries.
DAX Studio provides a powerful, user-friendly interface to create, test and execute DAX queries against your data models, much more efficiently than the Power BI formula editor. It also allows you to identify which DAX formulas or queries are causing performance issues and provides recommendations to improve them, helping you to understand why your model is slow or heavy, identify bottlenecks, and take the necessary actions to resolve any issues.
But the benefits of DAX Studio are not only limited to optimising your DAX formulas; it is also very useful for identifying and rectifying performance problems in your models. With VertiPaq Analyzer, a tool integrated into DAX Studio, you can view detailed information about the storage used by your data model and thus identify which tables or columns are consuming the most.
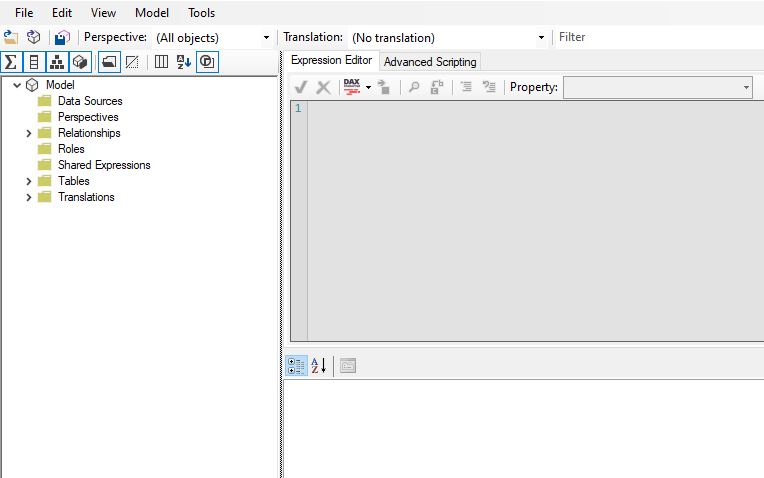
Tabular Editor
This is a very popular external tool, built and run by the talented Daniel Otykier.
Tabular Editor is a free, open-source tool to create and manage Power BI tabular models. There are two versions: Tabular Editor 2, an open-source project, and Tabular Editor 3, a commercial version with many extra features, dedicated support, and a better user interface, but at a cost.
It is very useful for advanced users and developers who need to perform more complex data modelling tasks than those that can be done in the Power BI graphical interface. The tool allows you to make changes to the model faster and more efficiently.
It offers many features which can make your modelling even smoother, like partition and perspective creation, enabling you to organise your data in a way that makes sense for your specific use case. For example, you can split a table in a tabular model into multiple partitions, and each partition can have its own data source and processing schedule, allowing you to better manage large datasets and optimise model performance. Perspectives can be used to simplify the model for different user groups, or to create custom reports that focus on specific areas of the data.
It also offers the option to automate repetitive tasks by writing scripts in C# or Visual Basic. If you have multiple measures or columns that need to be organised into display folders, you can write a script to apply the same folder structure to all of them at once. This can save a lot of time and effort compared to creating and organising display folders manually for each individual object.
What´s more, Tabular Editor has a powerful version control system that makes it easy to manage changes to your tabular model and to work effectively with others. You can see a complete history of the changes made to your model, and add comments to each version to help you keep track of why specific changes were made.
It also lets you compare your model with the “Best Practice Analyzer” and use the best practice rules to improve your model’s performance.
You can also manage translations for your tabular model, making it easier to create multilingual reports and dashboards. We’ll look at another interesting tool for this later in this article.

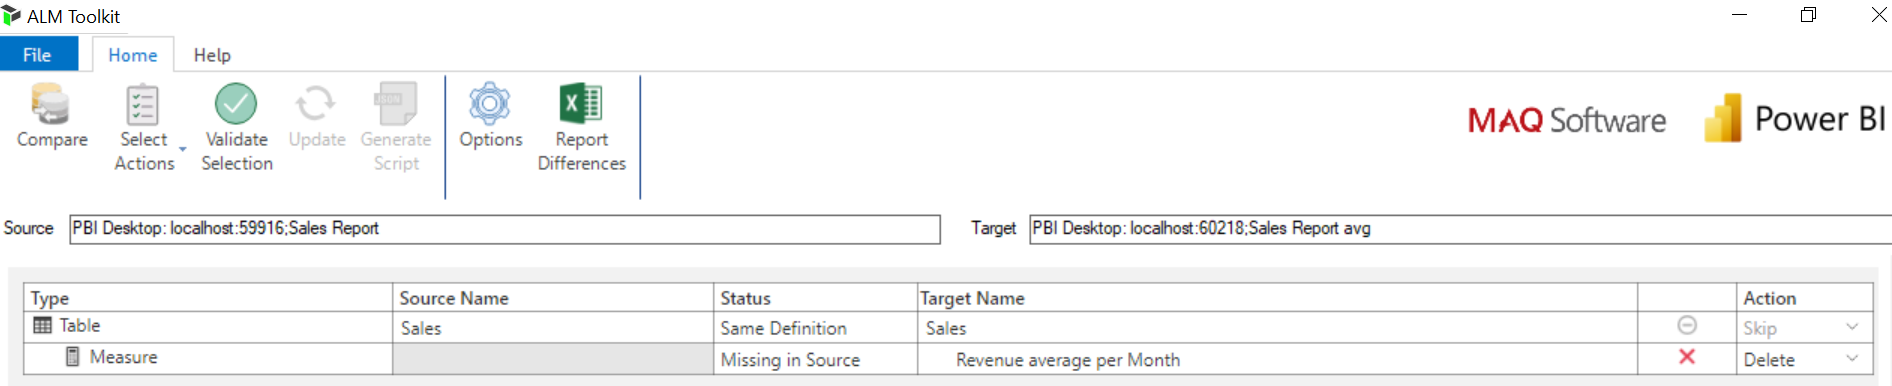
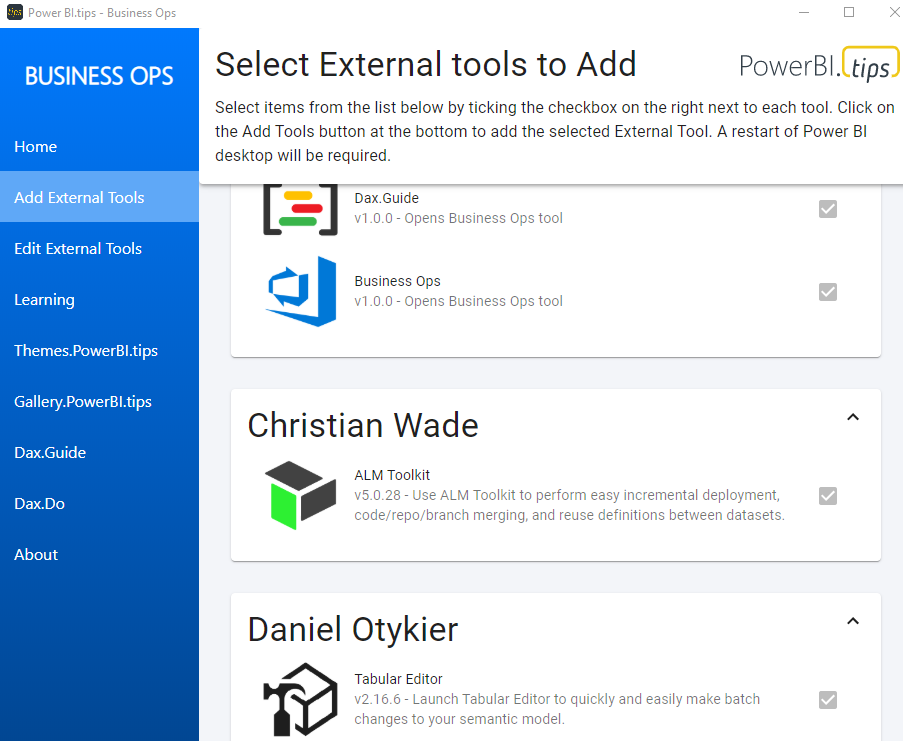
ALM Toolkit
ALM Toolkit (Application Lifecycle Management) is another free and open-source external tool. It helps you manage the application life cycle of a tabular model in a collaborative development environment. Multiple users can work on the same model at the same time and share their changes; the tool also facilitates the deployment of changes.
Lifecycle management is crucial in this environment, to ensure that changes are made systematically and implemented correctly, thus reducing the risk of errors and conflicts in the development process.
With this tool, for example, you can compare the schema of two datasets and identify the differences to guarantee proper deployment. You simply specify the source and target dataset and then compare the two. This is really handy when you work as a team on the same report published in Power BI Service.
Additionally, you can merge changes from different branches of your code, helping you to manage production branches for bug fixes and enabling multiple developers to work on the same project.
ALM Toolkit also provides a version control function that records changes made to the model and associates them with a commit message. These commit messages can be used to provide a detailed description of the changes and the reasons behind them.
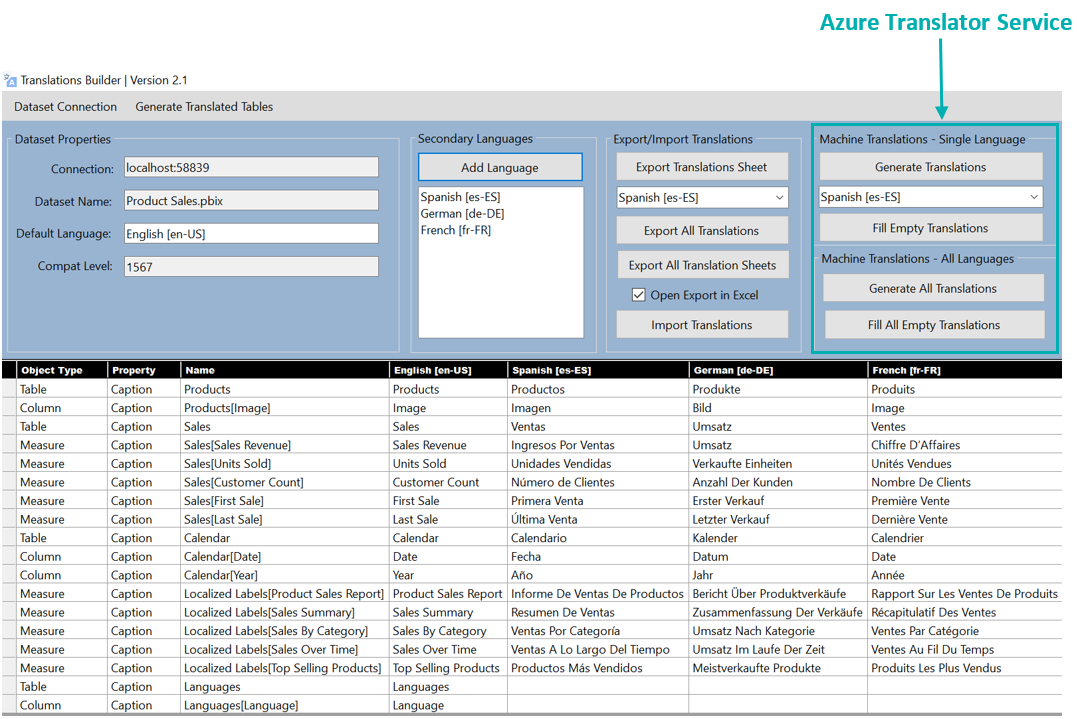
Translations Builder
As we said before, you can use Tabular Editor to add and edit translations manually, but Translations Builder is specifically for building multi-language reports.
The main problem in Power BI when creating multilingual reports is the lack of a built-in functionality for the automatic translation of all report elements, including column names, chart legends, and filter descriptions. Thus, creating a multilingual report in Power BI requires additional manual work to translate each of these elements, making the process laborious and time-consuming.
But now, with new features such as the DAX USERCULTURE function, Field Parameters, and this tool, you can build multi-language reports, like a Power BI report in English for some users which is also displayed in other languages like Spanish, French and German for other users. And all of this without the need to clone and maintain a separate PBIX project file for each language, reducing maintenance and overheads!
However, even though Translations Builder is a free tool, there are some requirements that you should consider, such as the need for a Power BI workspace with Premium capacity (Power BI translations do not load properly for reports in the shared capacity). You will need an Azure subscription (a Key and Location which provide access to the Azure Translator Service) for automatic translations as well – otherwise only the manual option is available. This automatic translation may produce some errors, so the tool provides a simple option to export these translations for human correction and then import them back.
To work with this tool, it is important to understand that there are three types of translation:
- Metadata Translations (tables, columns, and measures): the easiest to implement.
- Report Label Translations (report titles, section headings, button captions, etc.).
- Data Translations (column values in rows): this requires the most effort to implement.
Depending on the type, the approach and the functions used will vary.
Microsoft published a blog post that explains clearly how to work with multi-language reports, including videos and even a hands-on lab.
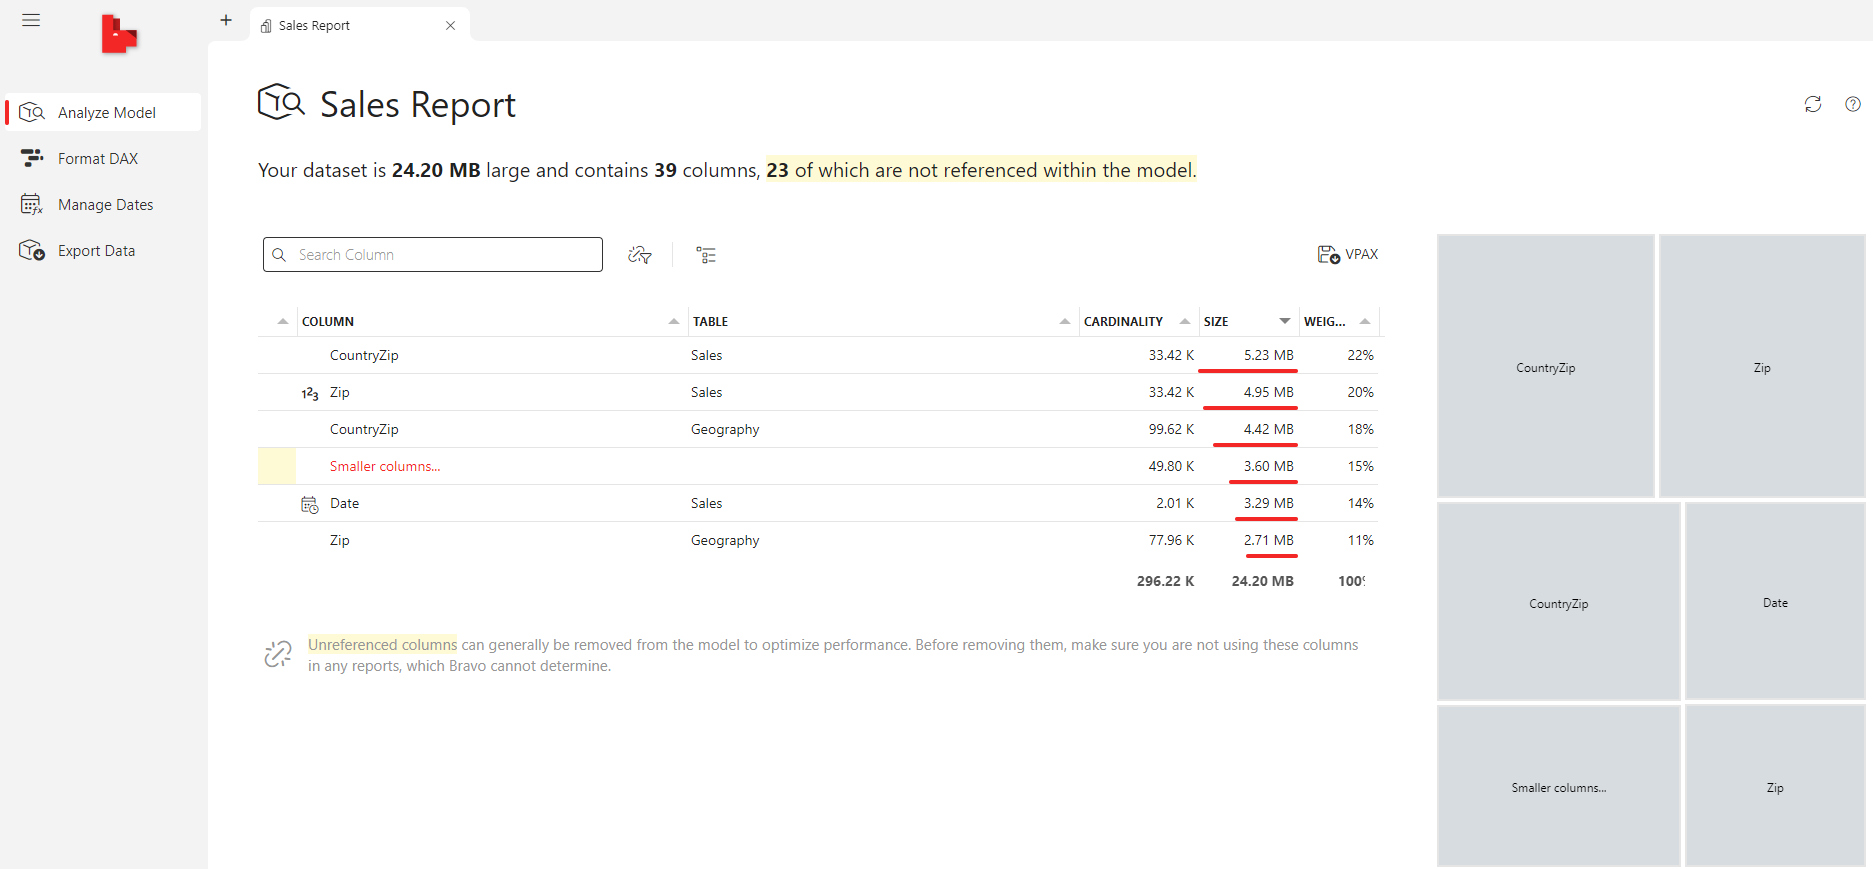
Bravo
Bravo is a free open-source tool that helps you create a Power BI model with a simple user interface. Bravo is not designed to replace advanced tools such as DAX Studio and Tabular Editor, but is aimed at users who do not require such a level of complexity. However, for simple tasks or for Power BI beginners, Bravo can be very useful.
With Bravo, you can quickly find out where a model consumes memory and remove the more expensive columns after verifying that they are not used by any report, thus optimising your model.
You can also preview the measures that require formatting, and then easily format them using the DAX Formatter service, ensuring that your DAX code is clean and readable.
Moreover, Bravo provides a comprehensive solution for creating date tables in your data model using different calendar templates, options, languages, and the holidays in various countries. You can connect this table to multiple tables and apply time intelligence functions to your measures; it also offers customisable date templates which can be distributed by an organisation to ensure the standardisation of the company calendar.
Finally, with Bravo you can export data from one or more tables to either multiple CSV files located in the same folder or to a single Excel file with a separate worksheet for each table. However, there is a limit of 1 million rows per worksheet when using Excel (you will have to use the CSV format if you exceed this quantity), and you cannot export a selection of rows or columns.

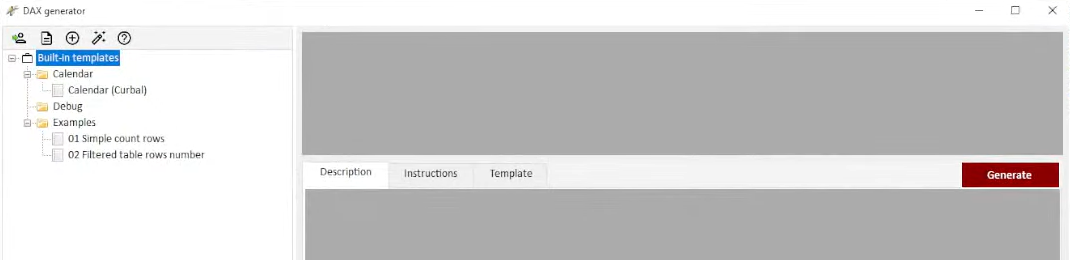
DAX Generator
DAX Generator is a free tool and is integrated as one of the Power BI Sidetools features, or you can download and install it separately.
This tool generates DAX expressions from templates created by experts: you can download various templates from Github and apply them to your models. They come with sections like descriptions to help you grasp their functionality and clear instructions for application. You can also create your own parameterised templates in cases with common DAX measures that you’re going to use repeatedly, thus saving time and simplifying the process; these DAX expressions can be as simple or as complex as you wish.
With DAX Generator, you can also format the DAX expression using the DAX formatter from SQLBI, debug with the integrated debugger, or parse a DAX formula to help you identify any issues.
Using the DAX Generator can be of great benefit in a business environment, as the ability to create standard DAX templates can improve the consistency and quality of DAX code throughout the company. Working with a reuse approach for various projects will also reduce the time and effort needed. Sharing your templates is the key, either within the company or collaborating with the wider community.
![]()
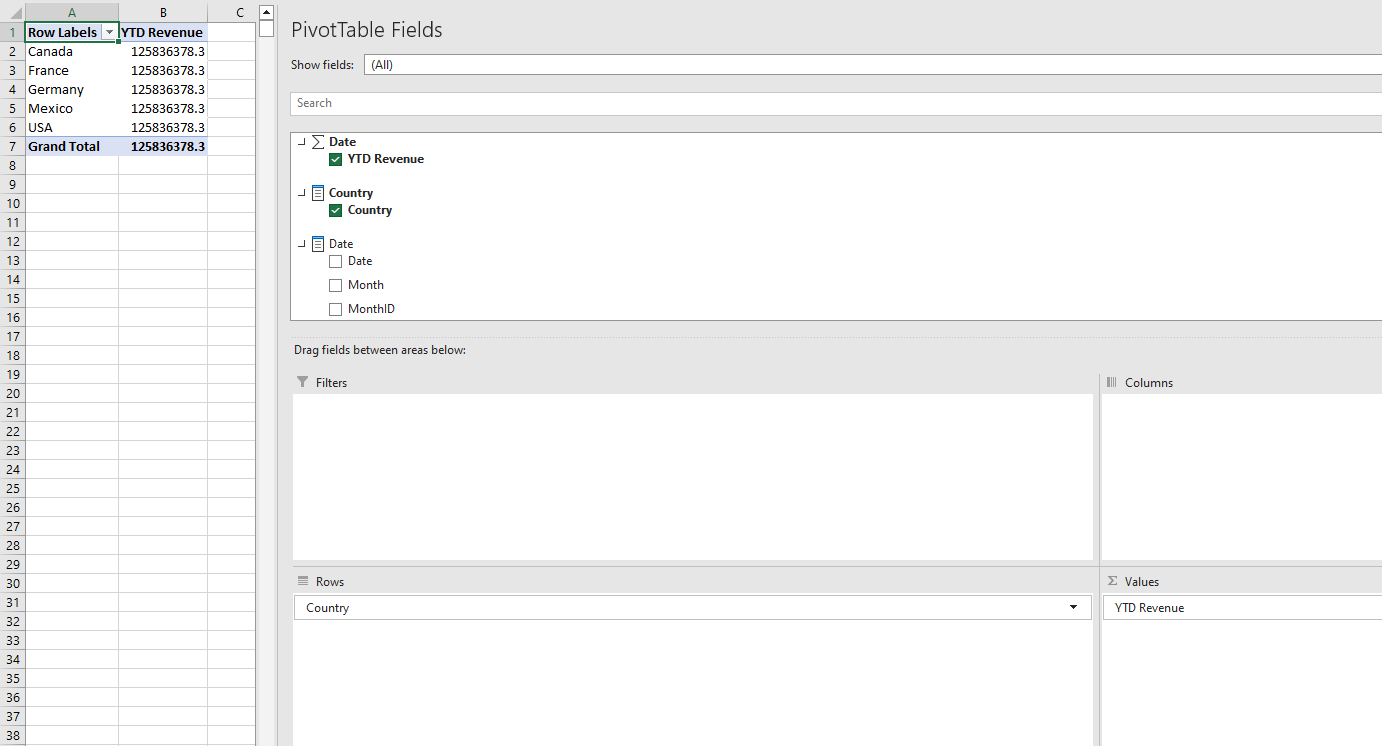
Analyze in Excel
Analyze in Excel for Power BI Desktop is a free tool also designed by SQLBI. You will need to have Excel on your computer to use it.
You can use Analyze in Excel to create a new Excel PivotTable from the data hosted in Power BI Desktop with a single click. If you prefer working in Excel or need to integrate Power BI data into other Excel reports, this feature is just what you’ve been looking for!
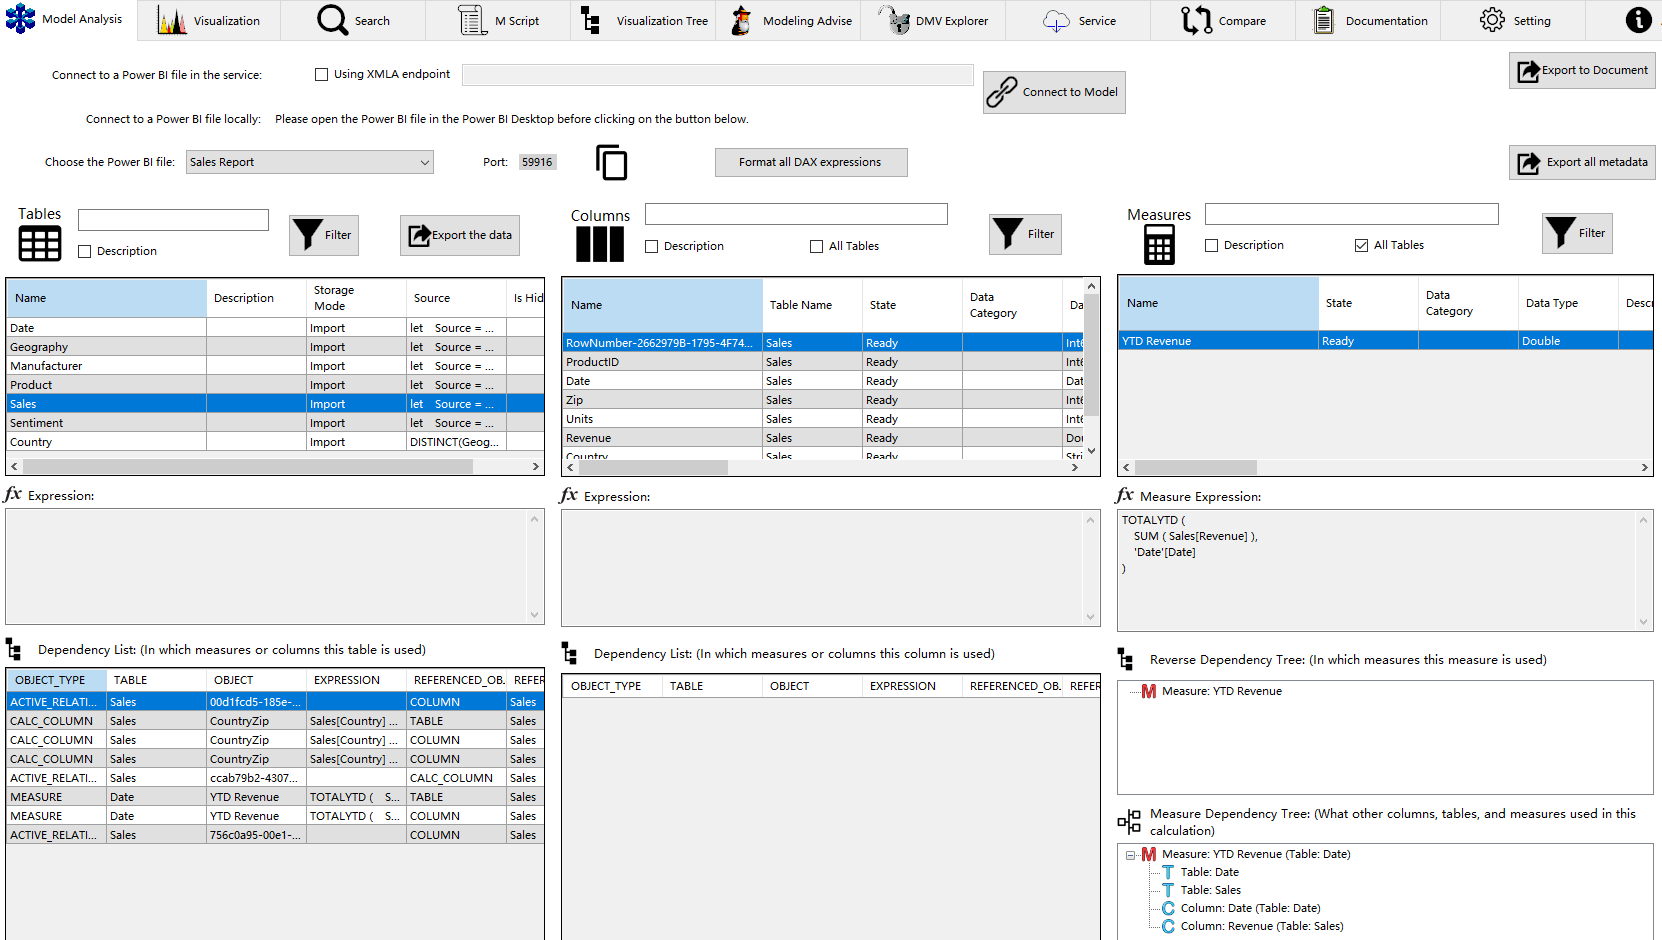
Power BI Helper
Power BI Helper is a comprehensive, cost-free tool designed for Power BI developers, analysts, administrators, architects and managers, so that they can document their work and enjoy a better development experience.
You can analyse your Power BI file, explore the data sources, the Power Query script, the data model, DAX expressions, and visualisations too. For example, you can export the entire metadata or a selected table to an Excel file, format all DAX expressions, view where a particular measure is used, track dependencies, and more.
You can effortlessly identify and remove any unused fields or calculations, and get a cleaner data model. Power BI Helper offers advice on best practices to further improve your data model. To put it simply, this tool can significantly reduce the size of your Power BI files whilst improving the overall quality of your data model.
In the “Visualization” tab, there’s an X-ray of all the visualisations used in your dashboards. For each page within the report, you can see the types of visualisation and their location in coordinates, the fields used, the bookmarks created, and used and unused tables, amongst others.
This tool also provides full documentation of Power BI objects in the Power BI Service: workspaces, apps, dashboards, reports, datasets, dataflows, and gateways. You can use the tool to download reports locally as a backup, just in case you need to recover them at a later date.
Power BI Helper enables you to export the entire audit log for a custom period, allowing you to analyse user activity within your Power BI environment; this feature can be particularly useful for compliance and security purposes.
It can also create comprehensive documentation of your Power BI data model in either HTML or plain text, containing essential details about tables, columns, relationships, calculations, measures, and other significant properties of your data model. The documentation generated is perfect for sharing the model details with team members and it also serves as a reference for future updates. It can be used as a report catalogue to help you to find the report you need and to see what it contains too.
Moreover, with Power BI Helper, you can compare two versions of a Power BI report, highlighting the differences. This feature is useful for version control, letting you compare and review differences between versions before publishing a new one, ensuring that changes made to the report are correct and do not negatively impact its performance or functionality.

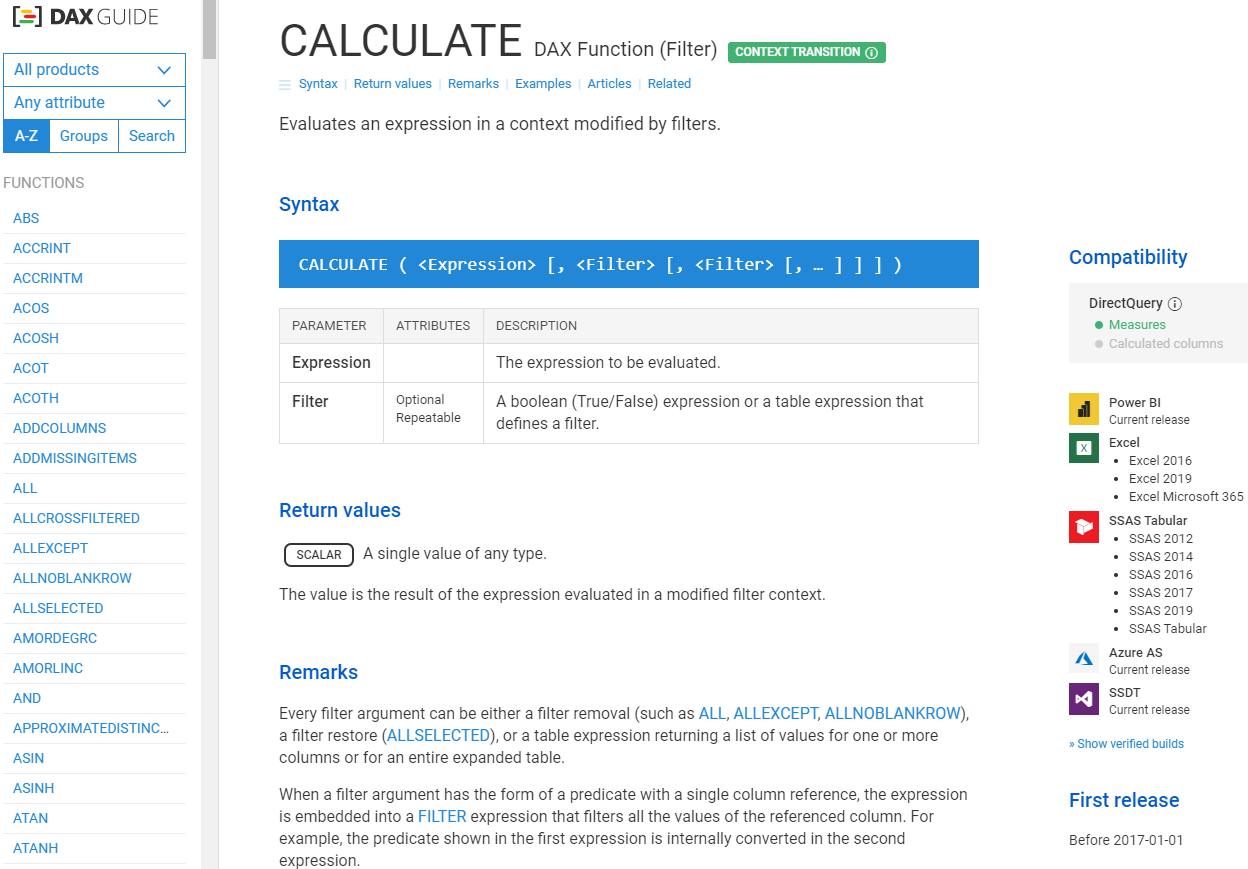
DAX Guide
DAX Guide is another free tool which offers useful tips and makes helpful content more readily accessible.
With this tool, you can easily access a comprehensive guide of DAX functions that includes examples and explanations of each function’s use. What’s more, you can instantly search for DAX functions and syntax to boost productivity.
Open Python
Open Python is a free open-source tool that enables you to run Python scripts in Power BI. You’ll need to have Python installed on your local computer to use it.
This tool empowers users to perform advanced data analysis and customise visualisations using Python libraries, clean and transform data, automate repetitive tasks, and carry out machine learning processes. Open Python also helps to integrate Power BI with other tools and technologies that support Python, including data analysis and visualisation libraries such as Pandas, Matplotlib and Seaborn, as well as machine learning libraries like Scikit-learn and TensorFlow, amongst others.
Although you can run Python scripts directly in Power BI Desktop, Open Python brings you greater customisation possibilities as well as better control over how the scripts are executed. Its user-friendly interface for running Python scripts can help you to save time and increase productivity too!
There´s also community support: as Python is a popular language, there is a large community of developers who can offer assistance, share their knowledge, and provide resources to help you solve problems and improve your use of Python with Power BI. This feature is extremely helpful, especially for those who are new to Python or are facing more complex problems.

Power BI Sidetools
Power BI Sidetools is a free tool designed to enhance the productivity of Power BI report development in Power BI Desktop.
With this tool, you can manage all the external tools you’ve installed, use the DAX generator as explained above, the DAX debugger that lets you easily debug measures, calculated columns and calculated tables without impacting calculation performance, and troubleshoot and optimise your DAX formulas too.
The included DAX parser lets you visualise your DAX expressions in a tree structure for better understanding of the logical structure of your DAX code, making it more straightforward to identify errors and improve performance. It’s easy to navigate and locate specific parts of your code, and even to obtain assistance by clicking on a function.
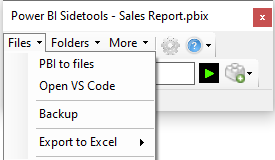
Power BI Sidetools also enables you to export data to Excel with just a simple click. You can also transfer DAX and M formulas to files; this is really practical when you want to save different versions in backups just in case the original file is accidentally deleted or corrupted. Furthermore, if you have created complex formulas that you use frequently, saving them in a separate file can allow you to reuse them across different reports, as well as helping with version control. Of course, you can also share these files with colleagues.
You can also view your DAX and M formulas in Visual Studio Code. This IDE provides a more advanced and user-friendly code editor compared to the formula bar in Power BI Desktop. Using all its features (syntax highlighting, auto-completion, code navigation, etc.) can help you to work more efficiently and to avoid errors, so it’s perfect when working with large, complex formulas.

Business Ops
Business Ops defines itself as “One Tool to Install them ALL”. With this external tool installer, you can quickly install multiple third-party tools and integrate them into a centralised location.
Business Ops boasts a great user experience when installing such tools, as you can easily add all the best and latest versions of these tools directly to Power BI Desktop.
Remember that you have to re-open Power BI Desktop to view an external tool that has just been installed.
Conclusion
Third-party tools can significantly improve your Power BI experience and help you gain deeper insights from your data. The tools we´ve seen in this blog post were selected for their reliability, ease of use, and powerful capabilities.
Remember that the “best” tool will depend on your specific needs and objectives. No matter what your needs or goals are, we recommend taking time to explore a variety of these external tools and seeing if integrating them into your Power BI workflow can help you leverage the full potential of your data!
If you’re interested in seeing how Power BI can help boost your business performance, don´t hesitate to get in touch with our team of certified consultants who’ll be happy to share their expertise with you!