02 Nov 2023 How to Export Google Universal Analytics Data into AWS on a Low Budget
Google Analytics is a powerful web analytics tool that enables website owners and marketing departments to track and analyse user stats. Google has recently released Google Analytics version 4 (GA4), and this upgrade introduces several improvements and new features, making it essential for businesses to refactor their implementation from Universal Analytics (UA) to Google Analytics 4.
While transitioning from UA to GA4 brings many benefits, the process also presents some challenges in data continuity. Google Analytics stopped collecting data in UA on July 1st 2023, and by July 1st 2024, access to historical UA data via the user interface and API will be lost, so businesses really need to get on top of planning the migration of historical data to ensure data insight continuity.
This article is going to explore a solution we implemented for one of our clients to export historical Google UA data into AWS, making it available for consumption by almost any visualisation tool.
Solution Overview
Google offers various methods for exporting Universal Analytics data, and one option is to export individual reports into files (CSV, Excel, PDFs, etc.). However, this process can be a bit tedious, as well as posing a risk to data continuity and potentially creating data silos. Another option for 360 customers is to use the export data to BigQuery feature, an interesting option if your data platform is deployed in Google, but not applicable if you’re hosted on Azure or AWS.
In our project, as our client’s enterprise data platform is hosted on AWS, the solution to export UA data has to be built using AWS services. No Google Cloud services, including BigQuery, are used in the proposed solution.
For data consumption, the client’s marketing department will continue using the same visualisation tool: Google Looker Studio.
As shown in the following schema, the key building blocks of the solution are:
- Extraction layer: implemented using Amazon AppFlow, creating several flows.
- Transformation layer: managed through AWS Lambda.
- Storage layer: employing AWS RDS PostgreSQL.
- Visualisation layer: Google Looker Studio is the current choice, but other visualisation tools like Microsoft Power BI, AWS QuickSight, Tableau, and Qlik can also be used.
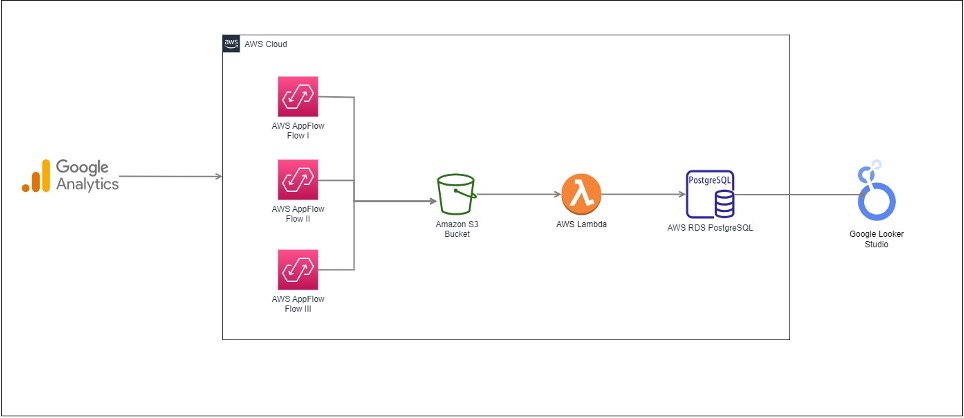
Figure 1: Solution Schema
Solution Implementation
Extraction Layer
Amazon AppFlow is a managed integration service that offers connectors to well-known SaaS applications such as Salesforce, Slack and the one we are interested in today: Google Analytics. Thanks to this connector we can extract data from Google Analytics through its API in a few simple steps, eliminating the need to manually prepare API calls.
First, on the Google console, create a Service Account that acts on behalf of your Amazon AppFlow application to access UA data. Once that’s set up, download the client ID and secret credentials. Lastly, enable and authorise the Google Analytics API for the application.
Figure 2: Google Service Account
Within the AppFlow console, first create the GA3 connector using the previously generated credentials. A pop-up window appears, prompting you to authenticate with the corresponding Google Account; once that’s done we can configure the flow.
Figure 3: Connector to Google Analytics
Configuring AppFlow involves selecting the specific Google Analytics object you wish to export data from. AppFlow provides a set of drop-down menus where you can select the desired objects, making the process very straightforward:
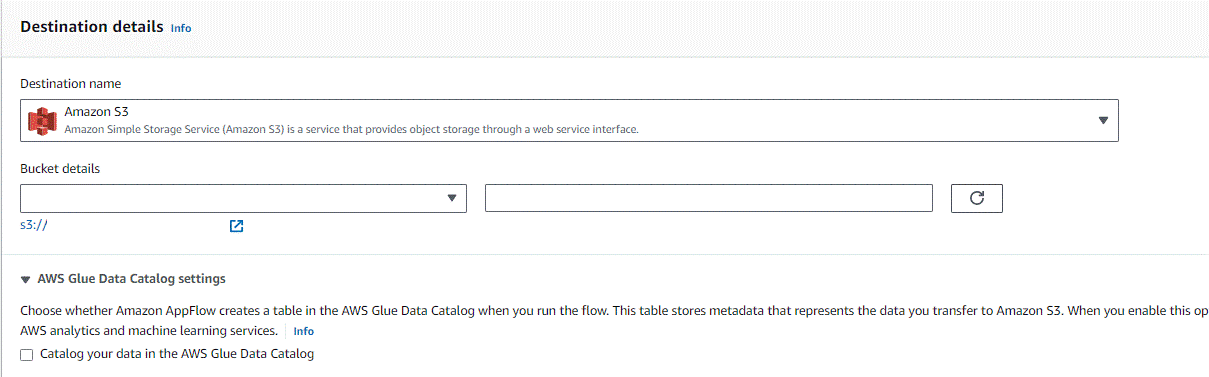
Figure 4: Setup Google Analytics as a source
As for the destination, AppFlow offers another drop-down menu of all possible destinations, including several AWS services and some third-party applications. Although you can create and even run your flow to store the data into any destination, only three are actually supported: AWS Lookout for Metrics, Amazon S3 and Upsolver. We tried to store the results elsewhere, but when running the flow, we encountered an error.
In the end the exports are stored in Amazon S3 in our project, and you can choose whether to catalogue the data in the AWS Glue Data Catalog. In our case, we opted not to, because the exported data is in a multiline JSON format, not supported in AWS Athena.
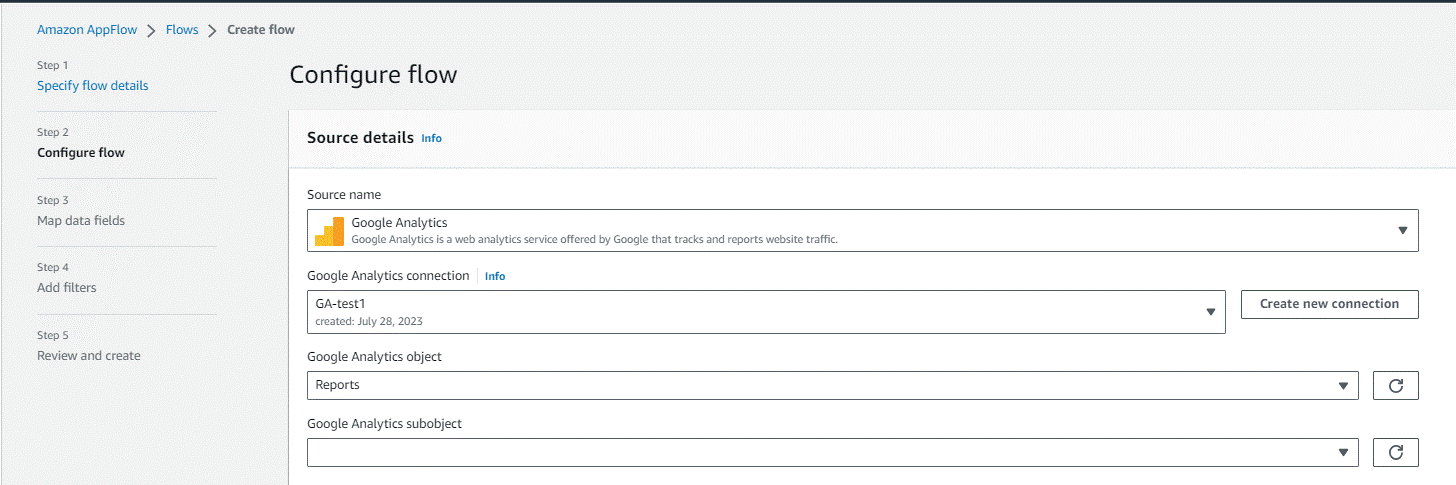
Figure 5: Setting up Google Analytics as AppFlow source
The following page is where you are going to spend the most time because it’s where all the UA properties are selected. There are two ways to configure the mapping: via the drop-down menu or by uploading a CSV file. In our first trial we configured it via the drop-down menu, but in the final version we used a CSV file to get more control over the selected fields.
These UA fields correspond to the dimensions and metrics utilised in the current visuals and dashboards that need to persist; field selection is project-specific.
The image below represents the field mapping for the project. Destination fields can be named as appropriate:
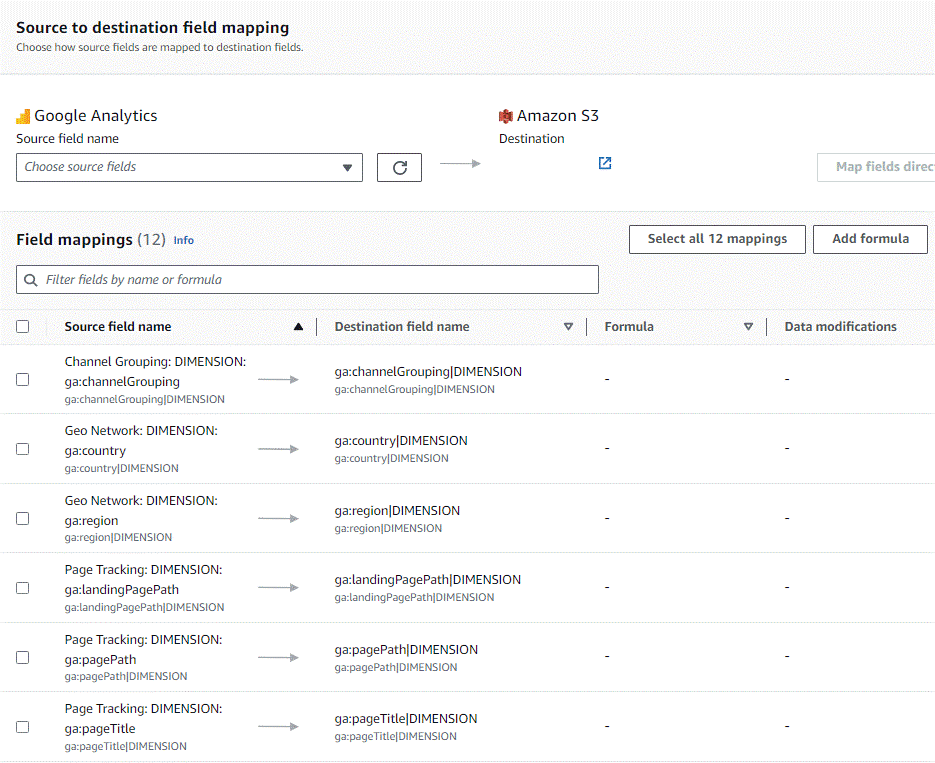
Figure 6: Select Google Analytics Properties
If you need further information on the significance of metrics and dimensions, check out the following link for a comprehensive explanation: UA Dimensions & Metric Explorer.
It is also worth mentioning that, as stated in the AWS documentation, a maximum of 9 dimensions and 10 metrics can be exported in a single flow. If you need to extract additional data points, as was the case in our project, you will need to group the dimensions and create multiple flows.
Amazon AppFlow allows you to specify the field for data partitioning and whether the flow should aggregate the resulting files or not. These configurations are meant to improve exported data organisation and query performance. In the final step, you can set a date range filter. It’s important to note that if you intend to export data for a single month, you need to select from the 1st day of the month until the 1st day of the following month, or some data will be missing.
If you choose to map the fields using the interactive menu, dimensions such ga:contentGroupXX are not going to work as they need to be parametrised based on the indexes. To do this, you need to forge and upload the CSV file containing the mapped fields such as ga:contentGroup1.
Once the flow has been configured, you can run it and monitor it for successful completion, and then check the S3 bucket to confirm the existence of the UA files.
Transformation and Storage Layer
After Google Analytics data has been exported and made available in AWS S3, a transformation layer comes into play, converting the multi-line JSON files into a data format suitable for consumption by visualisation tools.
In our project the data is transformed into a tabular format and stored in an AWS RDS PostgreSQL database. This is because the visualisation tool, Looker Studio, includes a PostgreSQL connector. It would have been great to store the data back into S3, catalogue it, and use AWS Athena for consumption, but unfortunately Google Looker Studio does not come with an Athena connector.
The transformation layer runs in an AWS Lambda function. The logic is programmed in Python and leverages the Pandas and Psycopg2 libraries.
It is also recommended to create a S3 event trigger so that whenever a new file generated by Amazon AppFlow lands in the S3 bucket, an AWS Lamba will be automatically invoked.
The image below shows the data present in the AWS RDS PostgreSQL after being transformed and loaded by the AWS Lambda function:
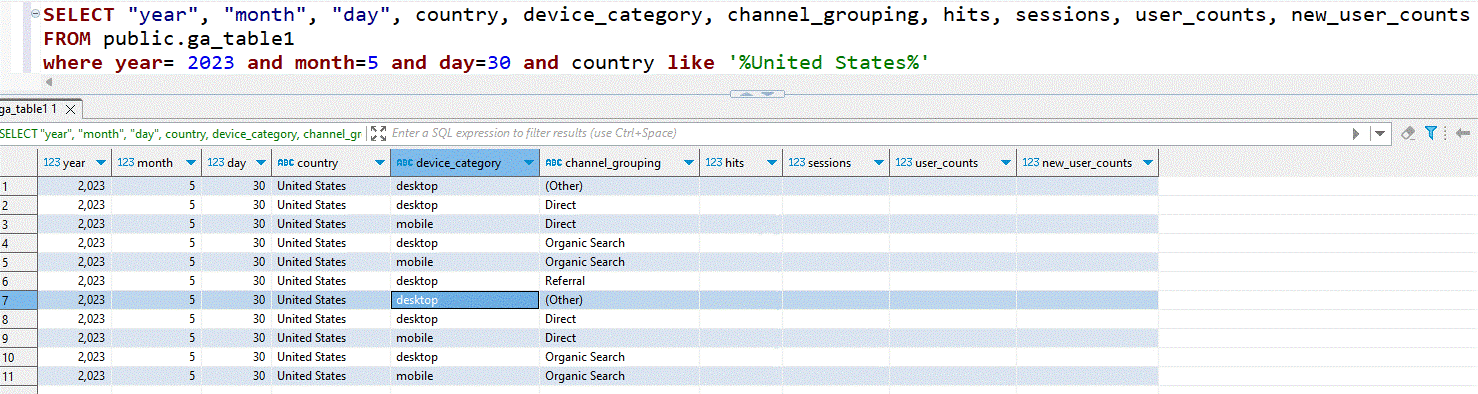
Figure 7: Google Analytics data stored in AWS RDS
Visualisation Layer
As we said before, Google Looker Studio serves as our visualisation tool. The client’s marketing department had some dashboards in Looker Studio that they wanted to keep using, and from a technical point of view we only had to change the data source from Google Analytics GA3 to PostgreSQL.
Google Looker Studio comes with a convenient “Make a Copy” feature to replace a dashboard’s data source whilst preserving styles and visuals. Use this feature to do the heavy lifting, and you’ll only need to make some minor adjustments in case of some field mismatches:
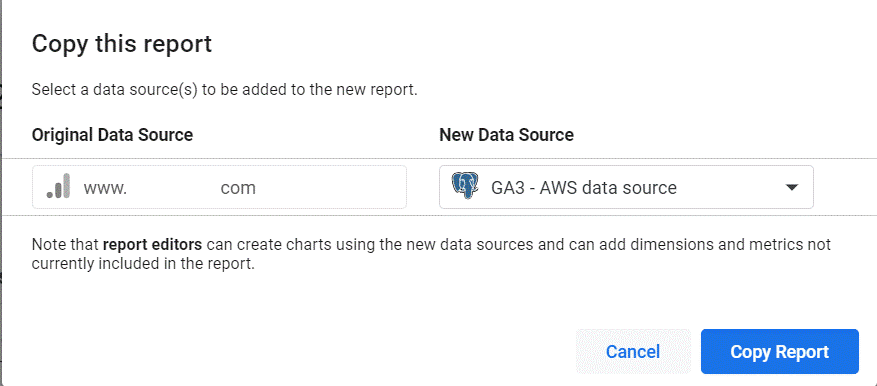
Figure 8: Replace the data source
Alternative Implementations
The solution we’ve presented is an excellent choice for certain companies, but others might opt for a different approach depending on factors such as data volume, cost, and their previous experiences with AWS services.
Whilst still using AWS as the platform for data processing and storage, alternative implementations can be explored for both the transformation and storage layers.
An alternative approach could involve the use of the AWS Glue service, which offers a viable solution for transforming data from the multi-line JSON format as well. You can choose AWS Glue over AWS Lambda if the data volume to process exceeds Lambda capabilities, or if you intend to apply PySpark transformations to store the data in a datalake and catalogue it with the AWS Glue Catalog.
Once the data has been catalogued, it can easily be consumed through AWS Athena, eliminating the need for a relation database. As previously explained, the reason behind opting for AWS RDS for PostgreSQL was due to the lack of an AWS Athena connector in Google Looker Studio.
Conclusions
This blog post has presented a solution for exporting Google Universal Analytics properties to a data platform, preventing data loss upon expiration. Our process uses AWS services to build a platform on a low budget. Alternative solutions are available, which can be tailored to the specific requirements of any company, on AWS or on other cloud providers like Azure.
We hope you’ve enjoyed today’s blog post and have learnt a lot! If your organisation needs to export Google Analytics data and you’d like some help or guidance in choosing the most suitable approach or in implementing it, don’t hesitate to contact us, and our expert consultants will provide the solution that best suits your needs.