
28 Dec 2022 Improving the Power BI Subscription to Email Solution using Power Automate
Do you have a Power BI dashboard that you regularly want to share with different people? An easy option is to share the dashboard link from Power BI Service. However, what if you want to share just one page from the dashboard, with row level security applied? We can partially solve this by using the Subscribe button in Power BI Service, which will send an email with the desired page, but this will be a screenshot from the dashboard without any filters applied, so row level security has not been applied to the image included in the email.
Imagine that you have a security company, and you use a dashboard with all the data from your clients. This dashboard has row level security roles for each client, so that each client sees their security data – and not all the data from the other clients. In this example, the Power BI subscription method won’t help, because the image from the report page would not differentiate the recipients as row level security roles.
A first approach would be to have a dashboard with the same report page duplicated as many times as there are clients, to filter each page for each client, and then to create a Power BI subscription for each page. However, this solution would be difficult to maintain because if a visual is changed in a page from the dashboard, the same change should be applied to all the other pages.
There is a better solution for this case: using a scheduled flow from Power Automate with the Export to File for Power BI Reports action followed by the Send an email action.
In this article we’ll explain how to filter a dashboard in Power BI Service using its URL, which will facilitate the creation of the Power Automate flow that improves the Power BI subscriptions to email. We’ll see in detail how to create this last flow, using a dashboard for demo purposes.
General Requirements
- Power Automate: access to standard connectors in Power Automate, which comes with any Office 365 subscription.
- Power BI Service: the report must be backed by Premium capacity (not Premium per User capacity).
- Power BI dashboard: with the table and field names from the dataset.
Sample Dashboard
In this article we’ll work with the dashboard below. The data is fictitious, and it is a dashboard created for demo purposes only. It represents oil and gas production in Brazil.
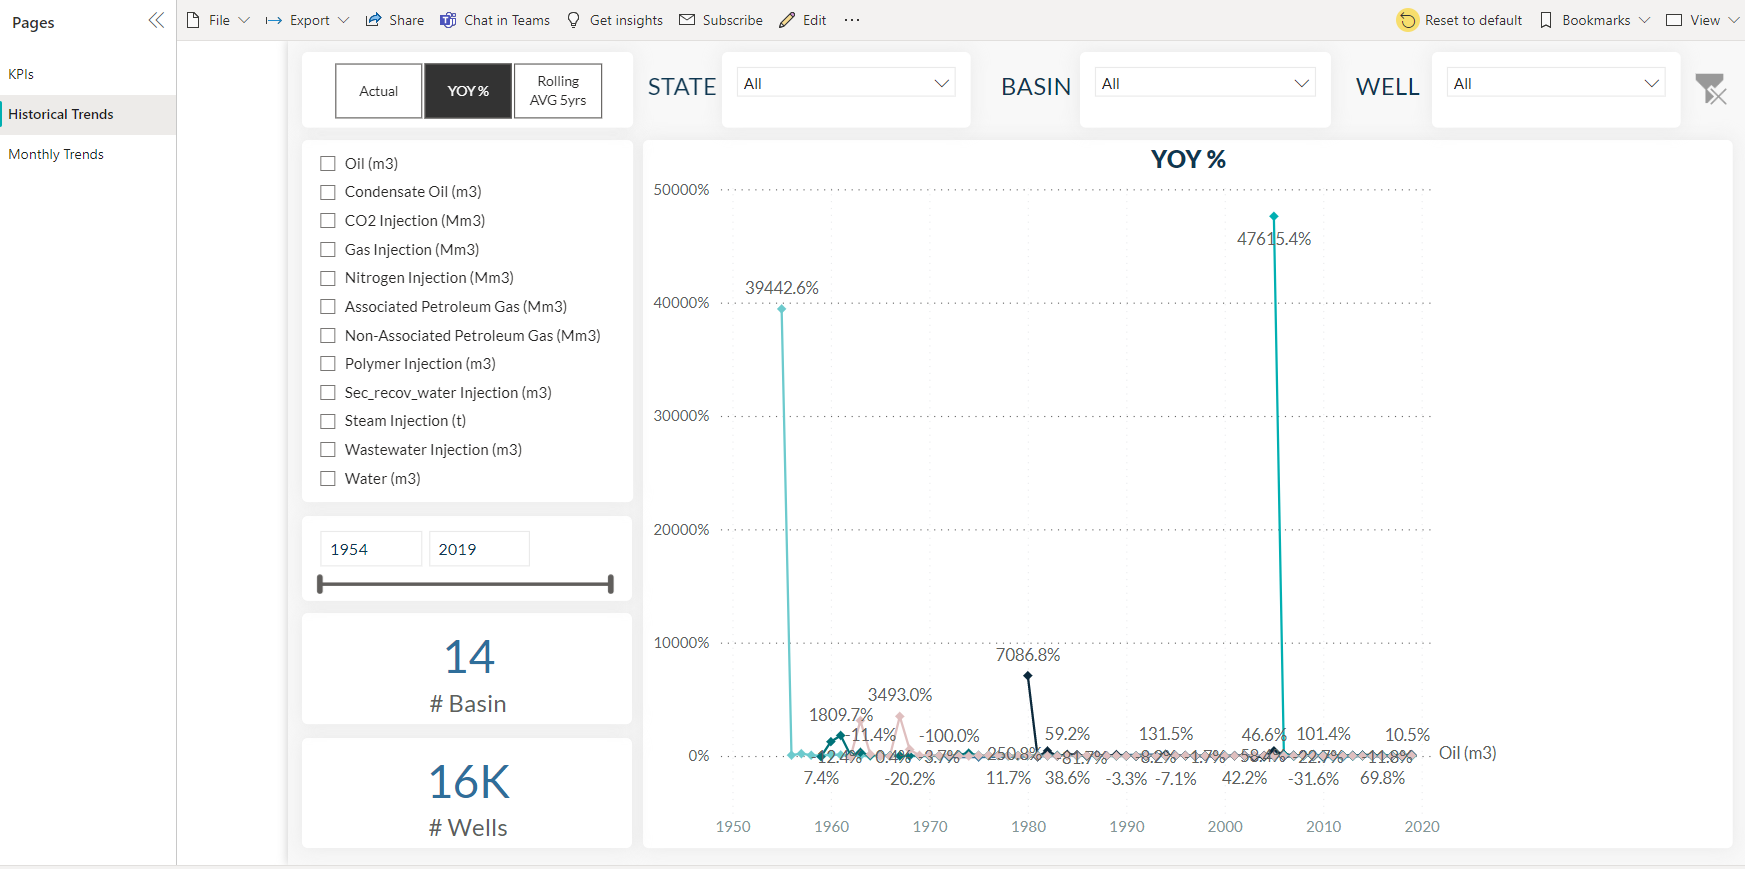
Figure 1: In this article we will use this page from the report
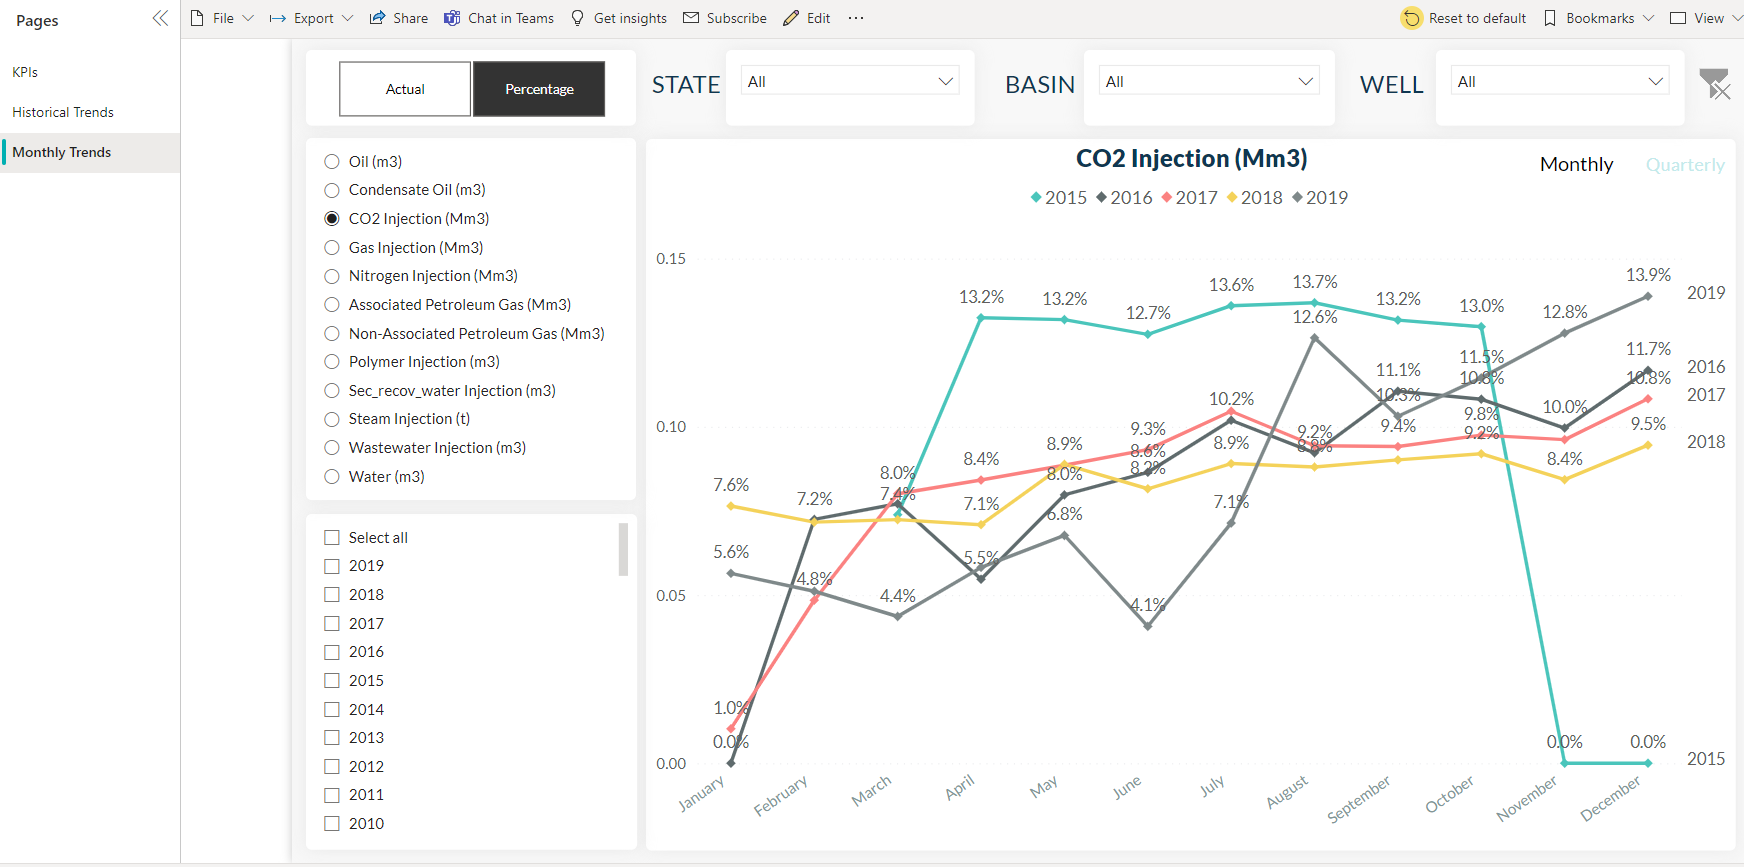
Figure 2: In this article we will also use this page from the report
The tables and fields that are going to be used are the following:
Table Name | Field Name | |
|---|---|---|
Date | Year | |
KPI Selector | KPI Name | |
Brazil Oil | BASIN_TX | |
Brazil Oil | STATE_TX |
Power BI URL Filtering
In the use case section we’ll see why it is important to know that a dashboard from Power BI Service can be filtered just by using some syntax in its URL. Let’s run through how to do it!
This is what the URL looks like:
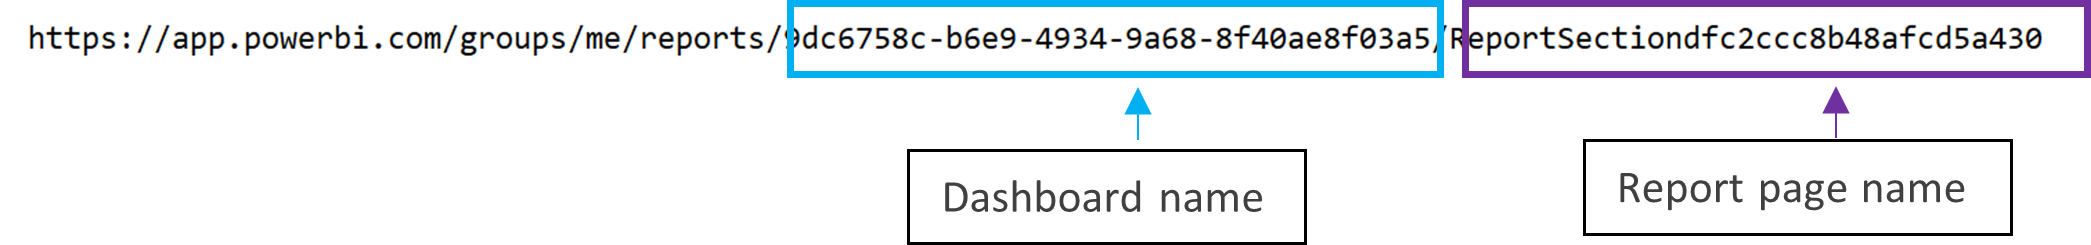
Figure 3
Syntax For Filtering
This is the syntax that has to be followed to filter the dashboard. It has to be appended to the URL.
?filter=TableName/FieldName eq value
Note that TableName and FieldName are case-sensitve, but value is not.
For example, we can filter the demo dashboard by Oil(m3)
https://app.powerbi.com/groups/me/reports/9dc6758c-b6e9-4934-9a68-8f40ae8f03a5/ReportSectiondf6547e08c92cbe5a4fe?filter=KPI_x0020_Selector/KPI_x0020_Name eq ‘Oil (m3)’
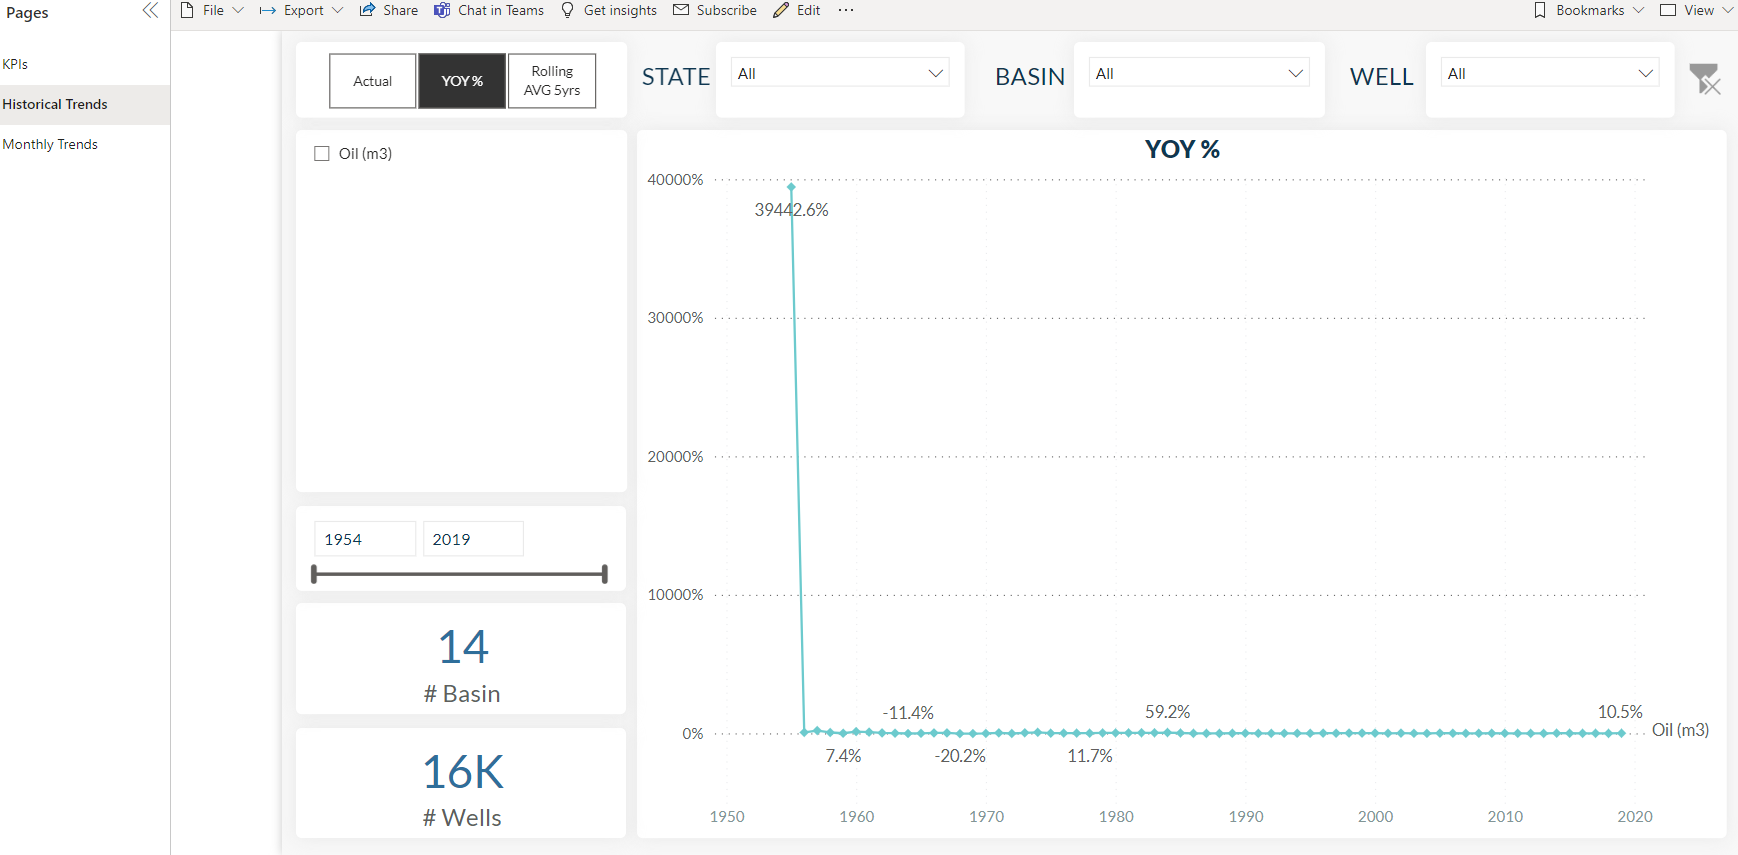
Figure 4: Historical Trends page filtered by Oil(m3)
The dashboard can also be filtered by Year:
https://app.powerbi.com/groups/me/reports/9dc6758c-b6e9-4934-9a68-8f40ae8f03a5/ReportSectiondfc2ccc8b48afcd5a430?filter=Date/Year eq 2019
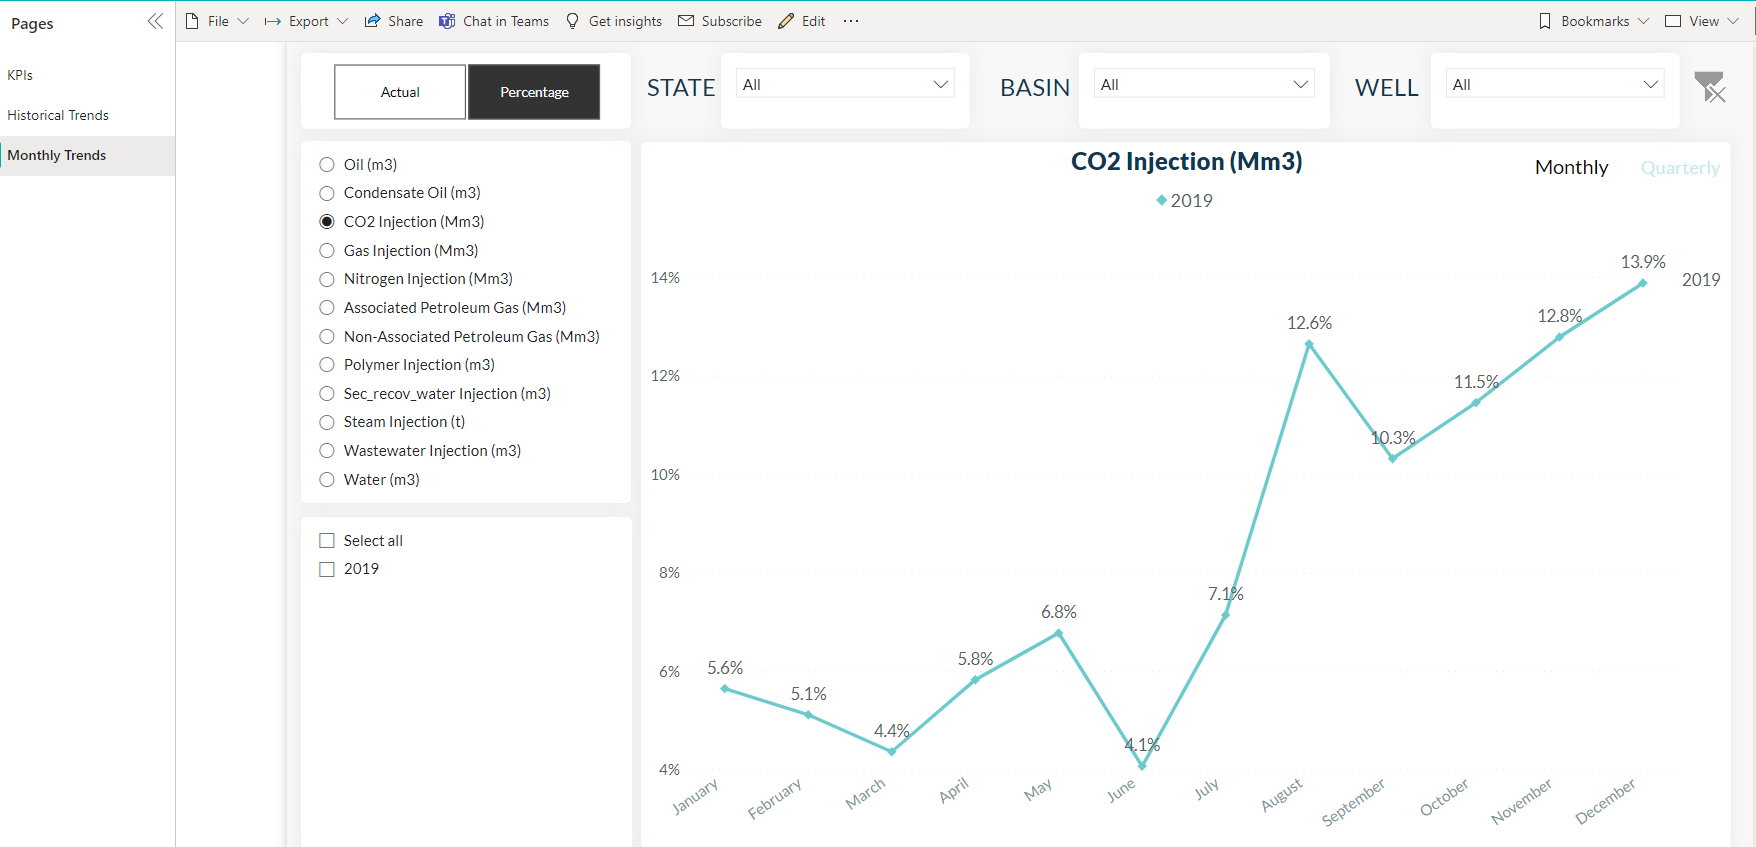
Figure 5: Monthly Trends page filtered by 2019
Depending on the field type, the value has to be formatted in a particular way, as we have seen in the examples.
- If value is a String, it must be enclosed with single quotes: ‘value‘
- If value is a Number, it does not require special formatting: value
In this article, the data type of the value cannot be Date/time, Date or Time. For more information about how to filter this data type you can consult the following web page: https://docs.microsoft.com/en-us/power-bi/collaborate-share/service-url-filters#date-data-types.
Special characters and spaces in table and column names require more formatting. They have to be prefixed with an escape code starting with an underscore and an x, then the four-digit Unicode, ending with another underscore (_xUnicode_).
Note that in the examples the space from the table name and the field name has been replaced by the Unicode _x0020_
?filter=KPI_x0020_Selector/KPI_x0020_Name eq ‘Oil (m3)’
It is also possible to filter the same dashboard by different values in a field, or by multiple fields. Power BI supports many operators that can be used in the URL, such as “and”, “in”, “eq”, “lt”, “gt”, etc. You can find the different operators below:
Operator | Definition | Example |
|---|---|---|
and | And | Brazil_x0020_Oil/BASIN_TX eq ‘Jequitinhonha’ and KPI_x0020_Selector/KPI_x0020_Name eq ‘Oil (m3)’ |
eq | Equal | Brazil_x0020_Oil/BASIN_TX eq ‘Camamu’ |
ne | Not equal | KPI_x0020_Selector/KPI_x0020_Name ne ‘Oil (m3)’ |
ge | Greater than or equal | Date/Year ge 2015 |
le | Less than or equal | Date/Year le 1983 |
gt | Greater than | Date/Year gt 2015 |
it | Less than | Date/Year lt 1983 |
in | Including | KPI_x0020_Selector/KPI_x0020_Name in (‘Oil (m3)’,’Associated Petroleum Gas (Mm3)’) |
Remember that it makes no sense to compare two strings, so “le”, “ge”, “lt”, and “gt” cannot be used with string value types.
Use Case
There is a table in the data warehouse with the recipients (those in charge of the oil and gas companies from each state) to whom the dashboard for their state has to be sent every month.
The table has two columns: the name of the state and the recipient for each state.
The dashboard has a page, Monthly Trends, that shows the monthly growth of oil production, condensate oil production, CO2 injection, gas injection, and so on. This is the page that has to be filtered by state to be sent to the required recipients, so they can control the growth from each basin and/or well in their state.
Solution With Power Automate
A (monthly) scheduled Power Automate flow has been chosen; its structure is:
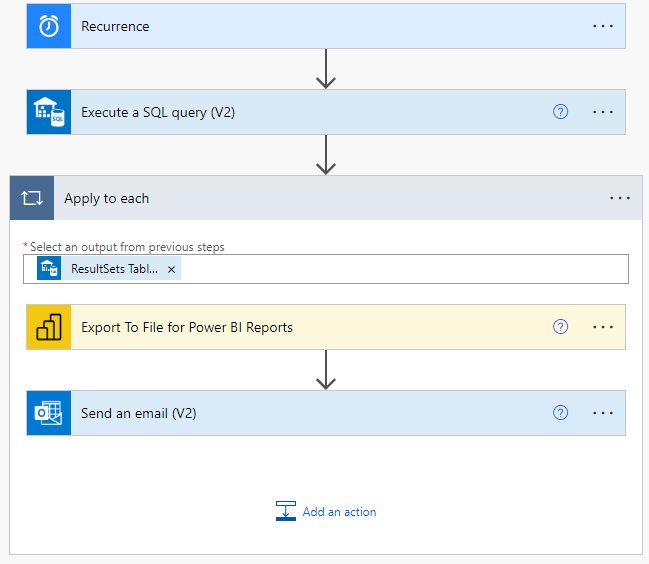
Figure 6: Power Automate flow steps
The first action of the flow, Execute a SQL query (V2), has been chosen to connect to the state-recipients table from the data warehouse. Note that this action could be changed for another that is able to get data from each row from a table (for example, some action related to Microsoft Excel). This action is a query that gets the information that is needed in the following actions (the state that will be needed to filter the dashboard in the Export To File for Power BI Reports action, and the recipient of the dashboard in the Send an email (V2) action).
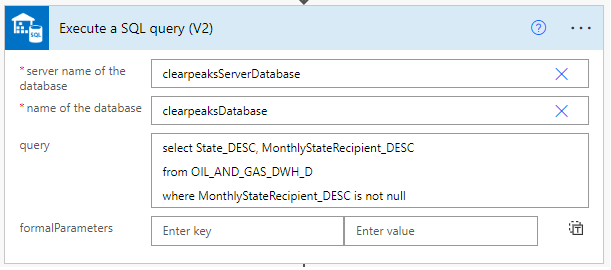
Figure 7: Query that returns the State for which each recipient will receive the dashboard
The Apply to each control is the loop that repeats the actions inside it as many times as there are rows in the table returned by the Execute a SQL query (V2).
The Export To File for Power BI Reports is in charge of exporting the dashboard, filtered for each state. Here is where what we explained in the URL filtering section comes into play: the filter has to be specified in the ReportLevelFilters Filter without the starting ?filter=. Dynamic content will be used to choose the variable of State_DESC returned by the query.
In the Pages pageName -1 we specified the report page to be exported. The export format is PNG, as Power BI subscriptions work well with this. However, the export format can also be a PDF file or a PPTX file, which can be useful if all the pages from the dashboard are to be included as an attachment in the email. In this case, no pageName will be specified and all the (filtered) dashboard will be exported.
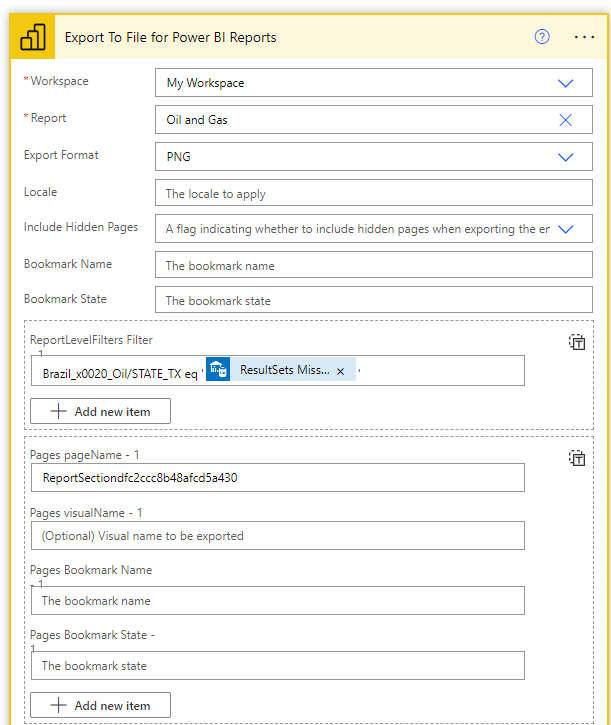
Figure 8: It has been chosen to export the Montlhy Trends page filtered by State as PNG file
The Send an email (V2) action is where the recipients, the subject and the body of the email have to be configured. The recipients go to “To”, and dynamic content is used to choose the recipients MonthlyRecipients_DESC, returned by the Execute a SQL query (V2). In the subject, the state for which the subscription is received is also included, making it clearer for the recipient.
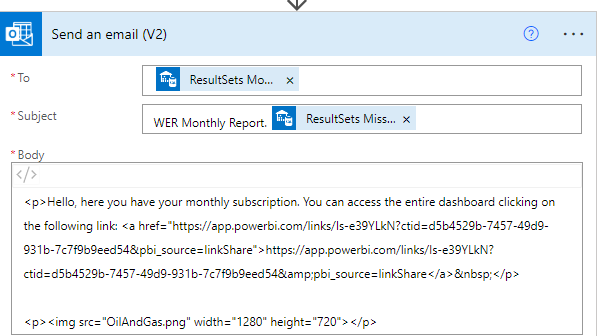
Figure 9: Information included in Send an email (V2) action
A link to the dashboard is also included in the body of the email, written in HTML so that is possible to embed the dashboard as a PNG image at the end of the body. This is not strictly necessary, as the dashboard can be included as a PDF attachment using the advanced options:
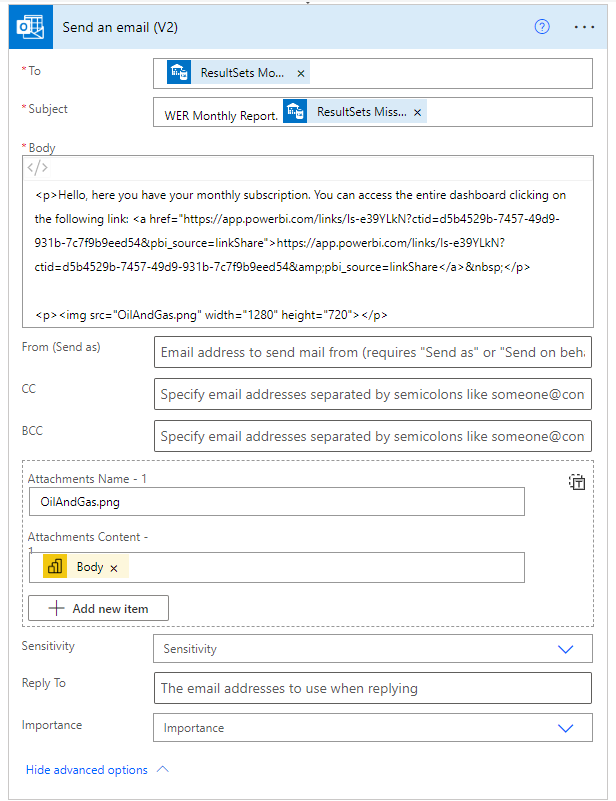
Figure 10: It is used as an attachment the file exported in the Export To File for Power BI Reports
Note that the attachment format has to match that chosen in the Export To File for Power BI Reports option, in this case PNG.
Conclusion
Power Automate allows us to do exactly the same as the Power BI subscription to emails, but solves its limitations. Filtering the URL permits us to filter the dashboard in many ways. Using the filtering syntax in the Export To File for Power BI Reports action also lets us send the filtered dashboard, not only as an embedded image, but also as an attachment. Additionally, we can send the dashboard as a PDF or a PPTX file, not an option with Power BI subscription to email.
In this use case we used a table with two columns, one with email recipients (acting as people subscribed to the Power BI dashboard) and the other with the state names used to filter the dashboard.
However, if we want the “screenshot” from the dashboard to be included in the email, filtered by multiple fields, the table could have more columns for each required filter, and then be incorporated as dynamic content in the ReportLevelFilters Filter option from the Export To File for Power BI Reports action. All this filtering of the dashboard is important because it can be used as a simulation of row level security in the dashboard image from the email (and attached image).
In conclusion, this new Power BI dashboard subscription method using Power Automate is an improvement because it preserves row level security using URL filtering, and can export the dashboard as a PNG, PDF, or PPTX.
If you have any questions about what you’ve read, Power BI or Power Automate in general, don’t hesitate to get in touch with our team of certified and experienced professionals!