04 Sep 2020 Introducing the new Tableau 2020.3
On August 11th, Tableau released their 2020.3 version, offering a lot of interesting new features that will be covered in this blog article. We will focus on two features key to this release, the improvement of relationships and Ask Data.
1. General new features
1.1. Data preparation
- Possibility to write to external databases in Tableau prep. You can create a new table, append or replace data in an existing table.
1.2. Deployment
- Possibility to automatically grant licenses and assign roles to users when they first sign in.
- Automatic checks to avoid common errors regarding permissions, credentials and base ports (currently only for Windows).
1.3. Connecting to data
- Improvements in SAP HANA connector.
- New SAP Certifications.
- Tableau Bridge improvements:
- Notifications when a new update is available.
- Access to virtual private cloud data (AWS, redshift, snowflake…)..
- New connectors in the Extension Gallery (Qubole, Dremio, SQream…)
- Support for Google BigQuery NUMERIC types.
- Possibility to connect to Presto in web authoring.
1.4. Data modelling
- Improvements in relationships.
1.5. Authoring
- New IN operator for calculations (for string, numeric, date and Boolean data types).
- New predictive modelling functions: MODEL_QUANTILE, MODEL_PERCENTILE.
- New spatial features:
- Union of files containing spatial data.
- Adding and managing third party maps from menu.
- Easier search in Data pane (by field name, type and comments).
- Possibility to create, edit or remove data or visualization filters in the browser.
- Fully accessible keyboard and screen reader relative date filters.
- Possibility to update the values in a control set depending on the values of a context filter.
1.6. Augmented Analytics
- Improvements in Ask Data.
- Possibility to add fields from multiple tables in Explain Data (as long as they are connected via relationships).
1.7. Consuming
- New “shared with me” tab on the home menu.
- Improvements to export visualizations (Excel and pdf) and the possibility to set an email subscription to receive a pdf (on a set schedule or when the data refreshes).
1.8. Data Management
- Possibility to tag stale content and change threshold.
- Warnings of data quality in Tableau Desktop.
- Possibility to include embedded files in External Assets list.
- Possibility to tag External Assets in Tableau Catalog.
1.9. Developer tools
- New Javascript APIs.
- When an image (png or pdf) is generated from a dashboard, the extensions zone image will be displayed.
2. Focus: improvements in Relationships and Ask Data
2.1. Improvements in relationships
We can now relate tables based on custom calculated fields and inequality operators. This is very useful, especially for historical data.
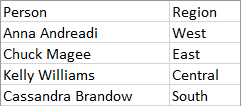
For example, with the sample superstore sales dataset in the People tab we have the following information about the person responsible for each region.
If that person changed, we would need to add start date and end date fields like this:
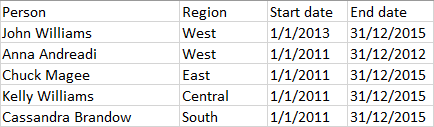
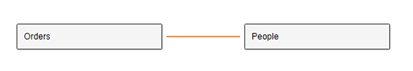
We have added a new person, John Williams, substituting Anna Andreadi for the West region at the start of 2013. Now if we wanted to join the Orders and the People tabs, we would have to do the following, which is where the inequality operators are very useful.
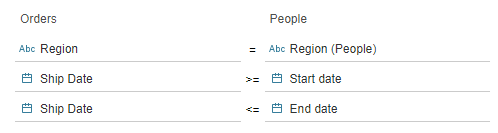
If we did not include both ship date filters, all the orders in the West would be duplicated.
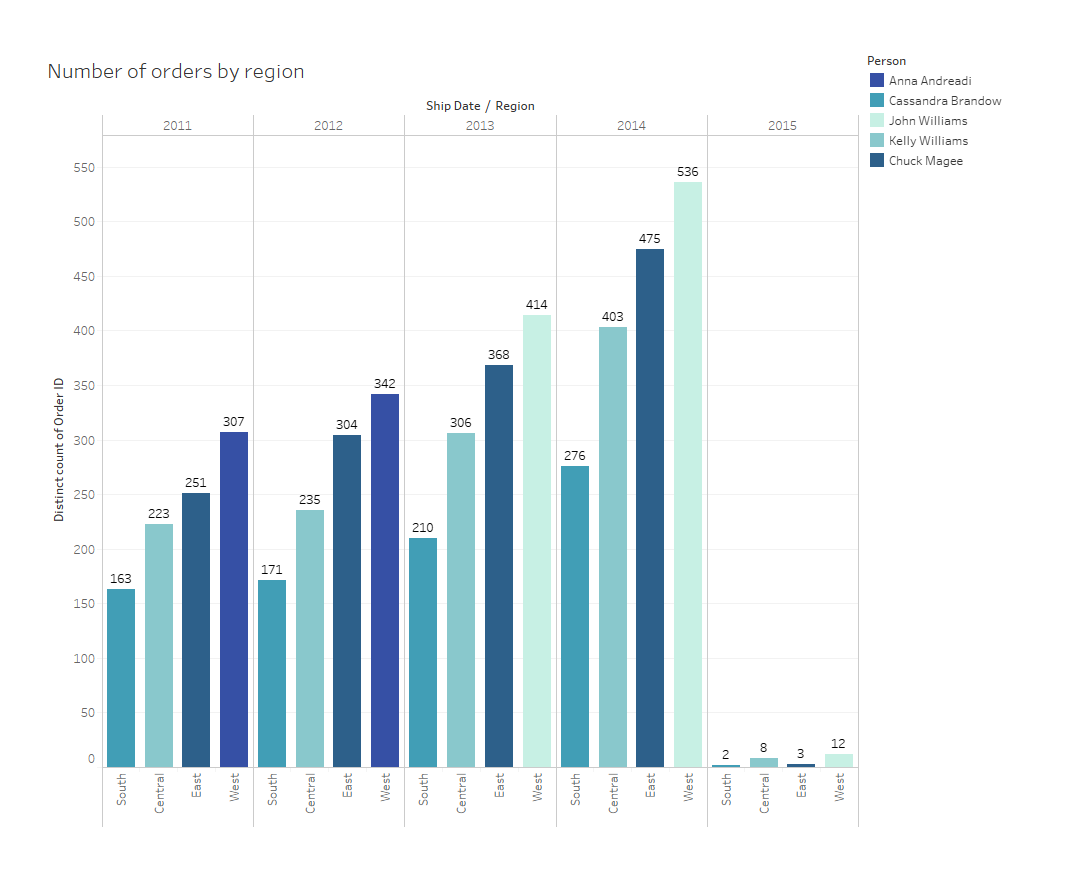
With the correct data source, we can create any visualizations we like; for example, we could build the following graph if we wanted to see the number of orders shipped each year for each region and who the supervisor was at the time.
2.2. Improvements in Ask Data
There are two improvements:
- Possibility to customize suggested questions:
We can now customize suggestions and even write the display text so that the language is more informal and understandable within your organization.
- Support for absolute date filters:
Refining absolute date filters can be a bit tricky so support is provided by Tableau; they have also created onboarding and curation resources that are accessible to Tableau Online users.
Conclusion
This new version of Tableau introduces some very interesting and helpful new features such as the possibility to write to external databases and the chance to customize the suggested questions in Ask Data. It also includes a lot of enhancements of already existing features that improve the user experience, such as the improvement of relationships that, as we have seen, is extremely handy.
At ClearPeaks we are experts in Tableau, familiar with its latest features and constantly working on enhanced visualizations. If you need more information about Tableau or about the many ways in which we can help you and your business, do not hesitate to contact us!