10 Jan 2024 Observability with Kubernetes
Nowadays, more and more companies across various industries are using Kubernetes due to its unrivalled ability to streamline container orchestration and to manage complex application ecosystems, embracing it as a fundamental technology to modernise their infrastructure and to optimise application deployment and management processes.
As we saw in our previous blog post Kubernetes for Managing Microservices, Kubernetes is a powerful tool for container orchestration as it simplifies the deployment, scaling, and management of containerised applications, enabling automatic scaling, load balancing and self-healing capabilities, auto-restarting failed containers and replacing unhealthy nodes.
Nonetheless, some difficulties may arise when we want to check the status of our Kubernetes cluster, difficulties that can be grouped into four areas:
- Scale and complexity: Clusters can comprise many nodes, containers, and services, making it difficult to track and analyse their status.
- Dynamic environment: Containers are ephemeral, and this dynamic nature makes it hard to keep track of their current state and relationships.
- Service dependencies: Applications in K8s often consist of multiple interconnected services; monitoring and understanding how these services interact can be complex.
- Performance optimisation: Analysing resource utilisation, identifying performance bottlenecks, and optimising resource allocation require visibility into cluster metrics and application behaviours.
In view of the above, observability becomes a crucial aspect of managing K8s clusters and the applications running on them. Observability means the ability to gain insights into the state of a system by monitoring its metrics, logs, and traces. Basically, it helps us to understand how applications and infrastructure are performing, and helps with troubleshooting, identifying bottlenecks, alerting, and optimising performance. Without observability, understanding the intricacies of these clusters and their running applications would be a significant challenge.
In this blog post, we will see how to monitor a local Kubernetes cluster that has a microservice application running.
Example of Microservices in K8s – Google Online Boutique
We have been working locally with an open-source project developed by Google Cloud Platform; you can access it through this link. We wanted to demonstrate observability in K8s by taking advantage of an already created microservice application, rather than creating one from scratch: this application is an online boutique demo with 11 microservices. It is a web-based e-commerce app where users can browse items, add them to their cart, and purchase them.
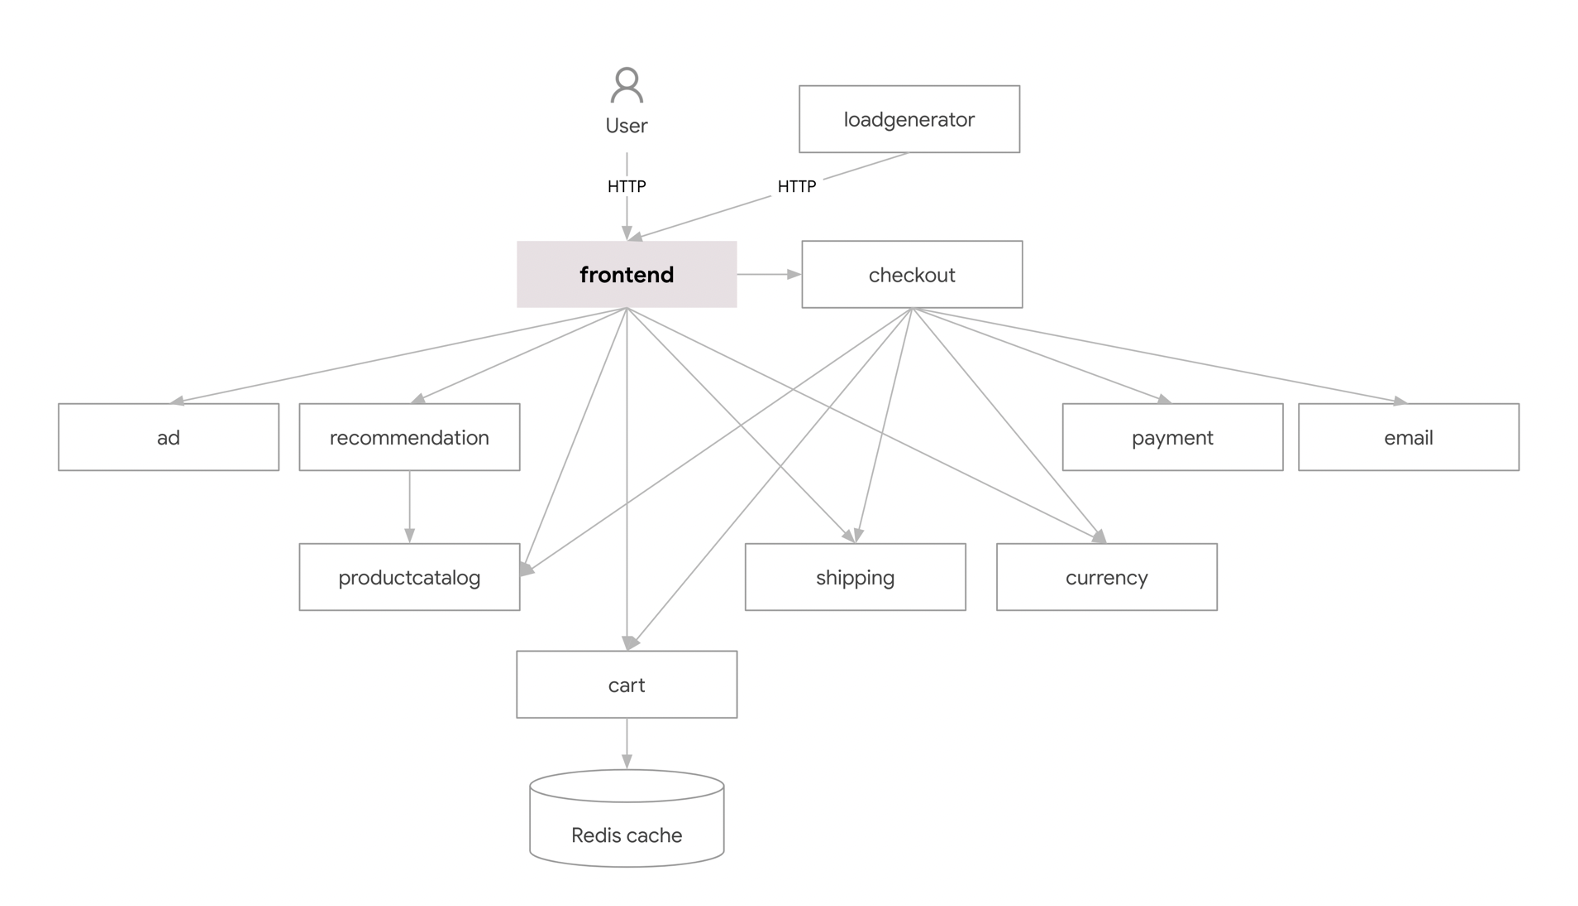
Above, a complete diagram of the application and the relationships between all the microservices inside.
Installation Guide
If you want to test this project locally, please follow this installation guide. Note that we are assuming that you have a local Kubernetes cluster installed, and if you don’t, check out our previously mentioned blog post to create your cluster from scratch!
First, you need to clone the GitHub repository executing:
`git clone https://github.com/GoogleCloudPlatform/microservices-demo.git`
Once cloned, enter the file created using
`cd <folder_name>`
Although the repository offers multiple ways to install this application, we’ll do it the easy way by using the manifest YAML file containing all the gathered services:
`kubectl apply -f ./release/kubernetes-manifests.yaml`
Check that everything is working correctly by executing
`kubectl get pods`
to make sure that all the pods are ready. You will probably need to wait a few moments and execute this command more than once before you see all the pods are ready.
Now we need to find the EXTERNAL-IP address of our application to be able to connect to the website. We can get it by executing this command:
`kubectl get service/frontend-external`
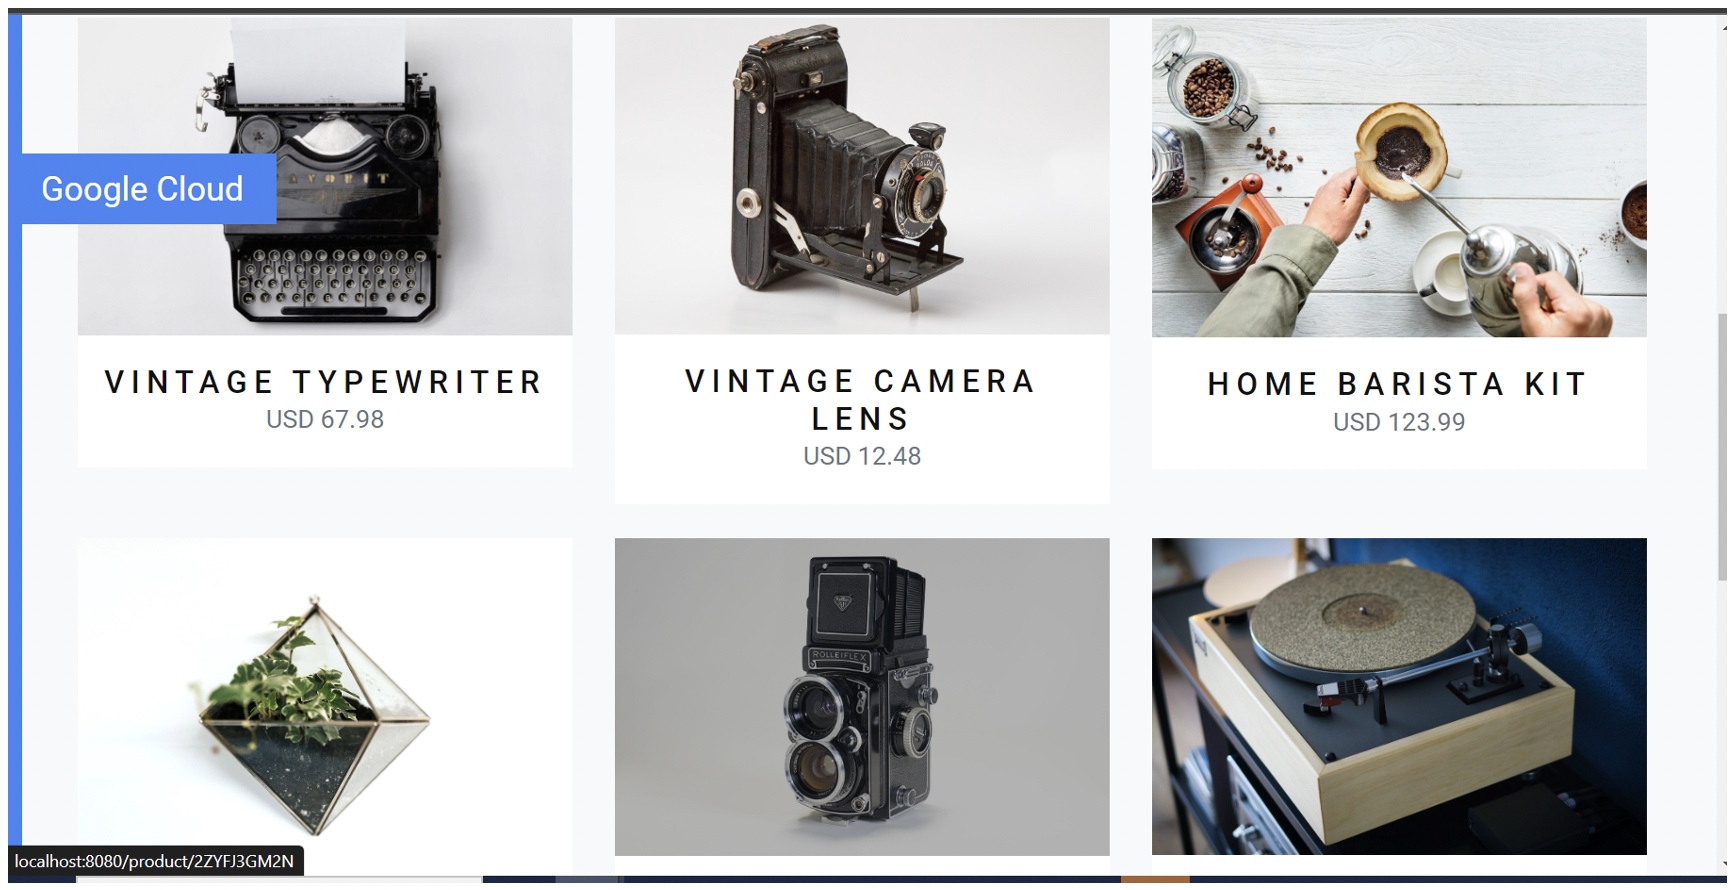
With this IP and the port associated to your application you can now access the web service in your browser: http://<EXTERNAL-IP>:<app-port>. You should see a landing page that looks like this:

If you need to change the port because another service is using it, you can do so manually by executing this command:
`kubectl patch svc <service-name> --type merge -p '{"spec":{"ports": [{"port": <desired-port>,"name":"anotherportspec"}]}}`
Kubernetes Dashboard
As we said before, it is really important to monitor your cluster closely to understand how every component is working, and in the event of a failure, to be able to detect the issue as fast as possible. We used an observability tool named Kubernetes Dashboard, a web-based Kubernetes user interface (UI) that facilitates cluster management and monitoring, allowing users to deploy containerised applications to the cluster, to troubleshoot issues, and to efficiently manage and monitor the cluster’s resources.
Using Kubernetes Dashboard, you can easily visualise the state of your cluster, inspect the resources running on it, and access important metrics and logs. It provides an intuitive way to interact with Kubernetes, making it easier for users who may not be familiar with the command-line interface to perform various operations on the cluster. The application gets the metrics of our cluster and uses them to create dashboards related to the component states. It also offers many features that offer observability, like getting every pod’s logs, restarting them, and even editing them directly from the YAML file.
Considering that Kubernetes Dashboard scrapes all the metrics from the /metrics endpoint, it is necessary to have an application to expose them there. Rather than creating a custom service that gathers metrics from the K8s API Server, we opted to use a popular addon recommended by the K8s Dashboard service. We will explain how to deploy both, Kube-state-metrics and Kubernetes Dashboard, below.
Kube-state-metrics Deployment
First, we clone the GitHub repository:
`git clone https://github.com/kubernetes/kube-state-metrics.git`
Then we create the resources to deploy the components to run metrics:
`kubectl apply -f kube-state-metrics/examples/standard/`
Once the deployment has been performed, check that everything went correctly by executing the following commands (a pod, a deployment and a service named kube-state-metrics should appear):
`kubectl get pods --all-namespaces | grep metrics`
`kubectl get deployments kube-state-metrics -n kube-system`
`kubectl get service -n kube-system | grep metrics`
Now, the service is exposing all the metrics on /metrics. We can access using port-forward for a quick check.
`kubectl port-forward svc/kube-state-metrics 30135:8080 -n kube-system`
Once executed, you should be able to access this site from your browser:
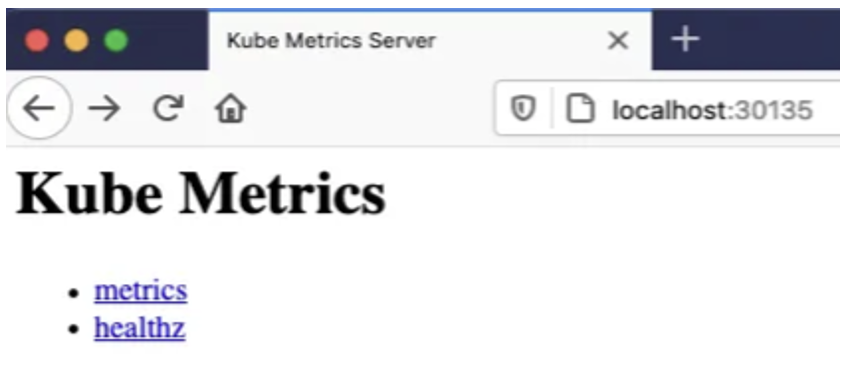
That’s it! kube-state-metrics is ready to be scraped.
Kubernetes-dashboard Deployment
We can deploy the dashboard UI directly with kubectl:
`kubectl apply -f` `https://raw.githubusercontent.com/kubernetes/dashboard/v2.7.0/aio/deploy/recommended.yaml`
Then we need to enable access to the dashboard using the proxy command:
`kubectl proxy --port=8001`
Now we can access the dashboard through this URL:
`http://localhost:8001/api/v1/namespaces/kubernetes-dashboard/services/https:kubernetes-dashboard:/proxy/`
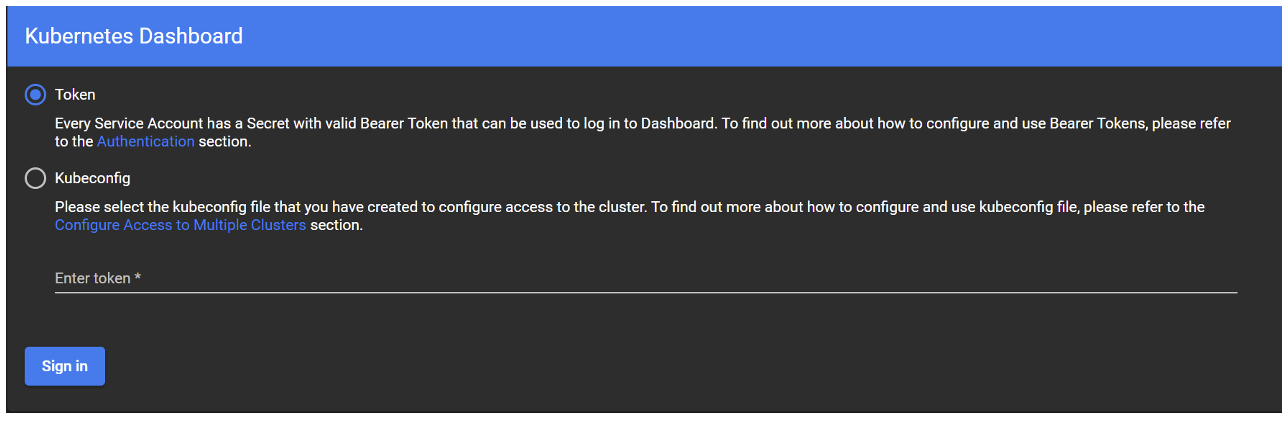
A login screen will appear, asking for either a token or the Kubeconfig file. In this blog post we are going to focus on using the token with a service account:
To obtain the token, first create a service account, bind a cluster-admin role to it, and then generate the token from it:
` kubectl create serviceaccount <svc_account_name> -n <namespace>`
Then bind the cluster-admin role to this service account, otherwise we will not be able to access the dashboard; you must create a clusterrolebinding:
`kubectl create clusterrolebinding <clusterrolebinding_name> -n <namespace> --clusterrole=cluster-admin --serviceaccount=<namespace>:<service_account_name>`
To check that the service account has the cluster-admin role, use this command:
`kubectl get rolebinding,clusterrolebinding --all-namespaces -o jsonpath='{range.items[?(@.subjects[0].name=="SERVICE_ACCOUNT_NAME")]}[{.roleRef.kind},{.roleRef.name}]{end}'
Once the service account has been created and has the required role, there are two ways to generate the token: by creating a temporal token or by attaching a secret to the service account.
The temporal token is the easiest and quickest way to access the dashboard. Simply run the following command, copy the token from the output, and introduce it into the prompt:
`kubectl -n <namespace> create token <serviceaccount> --duration=24h`
In order to attach the secret to the service account, it is necessary to create a Kubernetes secret. You can do so by creating a YAML file with the following content:
apiVersion: v1
kind: Secret
type: kubernetes.io/service-account-token
metadata:
  name: <secret_name>
  annotations:
    kubernetes.io/service-account.name: "<serviceaccount_name>"
Make sure to replace the <secret_name> and the <serviceaccount_name> with the corresponding values.
`kubectl -f <secret_filename>.yaml `
Now that our secret is ready, we must edit the serviceaccount file to add it:
`kubectl edit serviceaccount <serviceaccount_name>`
To add the secret, we just need to write its name in “secrets”:
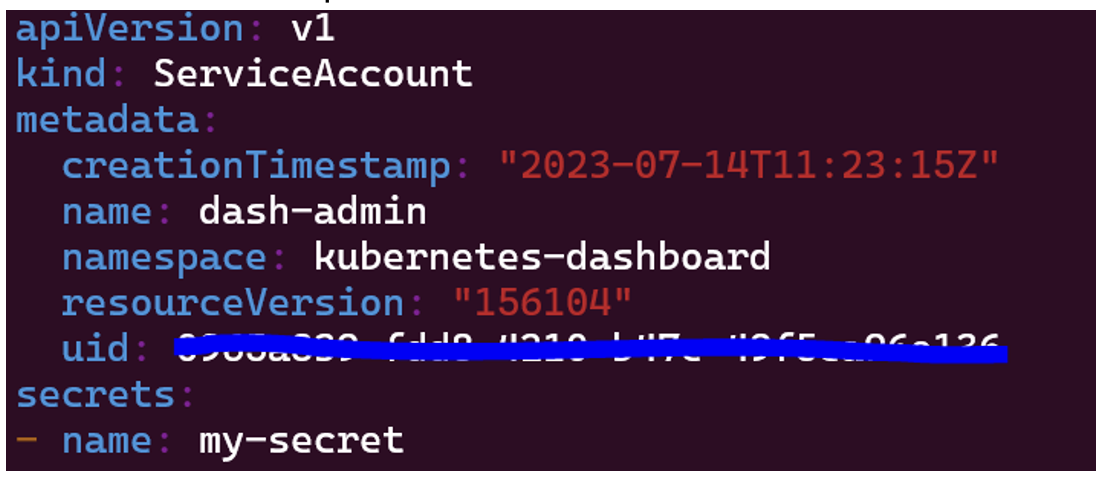
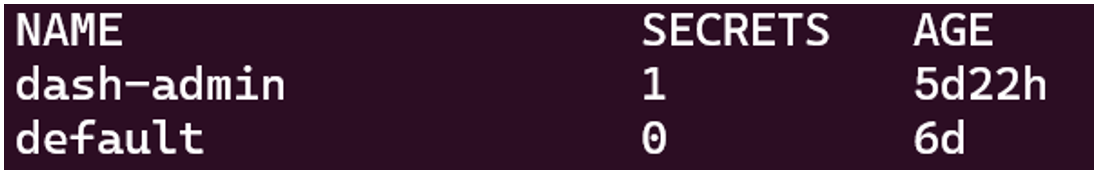
Now, if we run the
` kubectl get serviceaccounts`
command, we will see that our service account has 1 secret attached:
Once the service has been created and attached, we can get the token by executing the following command:
‘kubectl get secrets $(kubectl get serviceaccount <serviceaccount> -o jsonpath="{.secrets[0].name}") -o jsonpath="{.data.token}"’
Once we’ve completed all these steps, and after introducing the token into the prompt, a dashboard containing the information about the metrics of the K8s cluster that is running the Google online boutique should be displayed on screen:
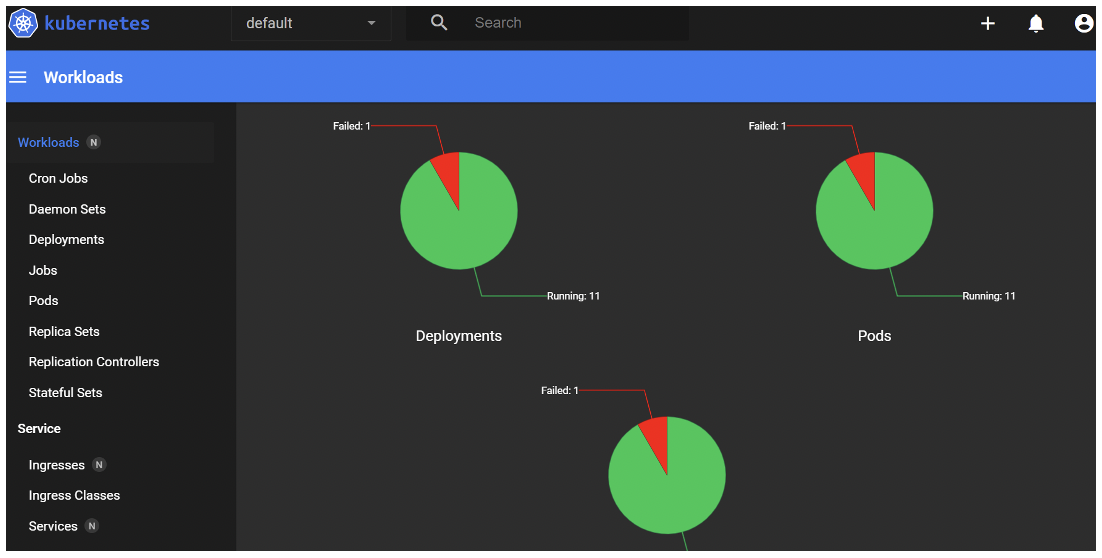
As you can see in the picture above, the dashboard offers many useful features to see what is happening inside your cluster: graphs that show the workloads, daemon sets, deployment states, pod states and logs, replica set states, and so on.
Conclusion
In this blog post, we’ve seen why observability is so crucial when working with K8s clusters: a comprehensive observability of our cluster infrastructure, metrics, and logs, offers us a better understanding of what is happening inside our cluster and how to act in the event of errors or failures.
Thanks to tools like Kubernetes Dashboard, we can visualise metrics in a way that is simple to understand. However, there are some issues around the lack of persisting data and analysing our cluster status in the past, because the K8s dashboard is deployed within the same cluster – even if it’s in a different namespace – so it is still susceptible to outages or errors. In our next blog post, we will see how this Google online boutique microservice can be deployed in a more productive system like Azure Kubernetes Service (AKS), and how to monitor it using an external observability toolset like Grafana Cloud. Read it now and keep learning!
If you’re interested in what you’ve read today, or if you have a question, feedback, or need assistance, don’t hesitate to get in touch with us. Our dedicated team is committed to providing you with the best support and ensuring your experience with our services is outstanding, so contact us today!