17 May 2018 Prepare your data for analysis with Tableau Prep
For the last couple of years, Tableau has been working on a product to make analytics more accessible to business users. With the recently launched Tableau Prep they are bringing this concept of self-service data preparation to the field.
This new Tableau product is a personal data preparation tool aimed to those users who need to clean the data in order to make their analysis. We are talking about users who normally spend hours cleaning the data in Excel, filtering, pivoting… users who don´t want to (or cannot) wait for the IT team to prepare the data for them but also would rather not spend too much time in such a tedious and time-consuming task like cleaning and preparing the data. Does this ring a bell to you? Then, keep reading!
1. Tableau Prep main features
Being a great tool for data cleansing, Tableau Prep is not meant to replace the enterprise ETL but to provide business users with a set of tools that enables them to perform their data analysis independently. Tableau Prep includes a great variety of functionalities to perform typical tasks in data cleaning. In general, it allows the user to extract data from different sources, transform that data and then output it to different type of files. All of this can be performed in a simple and intuitive way with the help of a graphic interface to build the data flows.
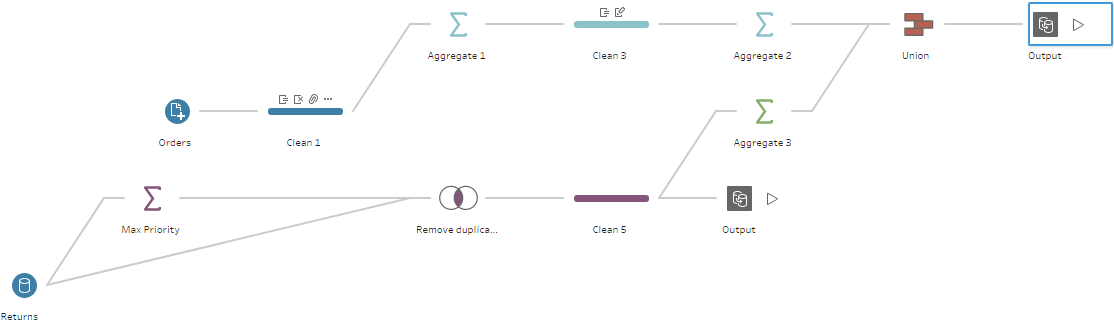
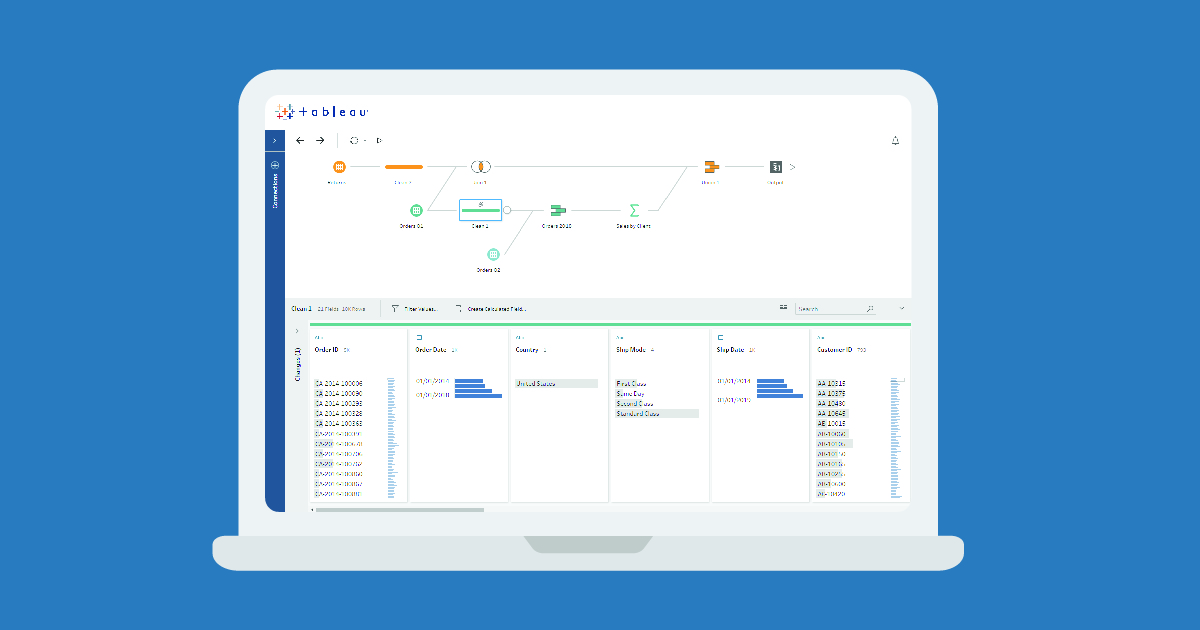
Figure 1: Example of data flow in Tableau Prep.
Going more into detail, with Tableau Prep you will be able to perform the following tasks:
1.1. Connect to data
Following the simplicity to connect to disparate data sources (already in Tableau Desktop) Tableau Prep offers a series of connections to different types of files and databases, including some of the most common on-premise databases like Oracle or Ms SQL Server, as well as cloud platforms such as Amazon Redshift or Google Cloud SQL.
1.2. Combine data with Join and Union
You´re able to easily perform joins or unions between different data sources. At any time, you can visualize the dataset that results from the combination, which allows you to quickly identify issues.
Figure 2: Union of two datasets in Tableau Prep.
1.3. Clean and modify data
Starting from basic but essential functionalities like removing or renaming fields, the ‘Clean Step’ is where we can find the main utilities to transform our data. It includes some functionalities that we already know from Tableau Desktop, so it is easy to give our data the shape and look we are looking for. Let’s look at this a bit more in detail:
- Filters
Tableau Desktop users will recognize this feature as it presents the same intuitive behaviour it has in Desktop. We can create a filter based on a new calculation or choose some of the predefined options that Tableau Prep provides, like ‘Relative Dates’ in the case of date values or ‘Range of values’ if we work with numeric fields.
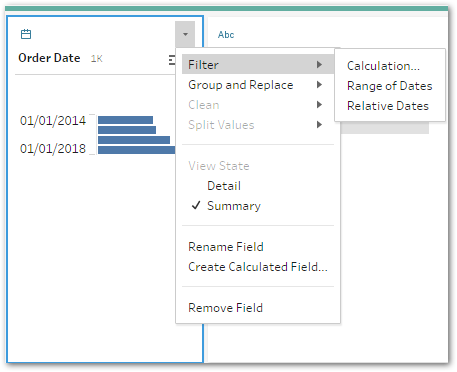
Figure 3: Options in filters.
- Split values
The ‘Split Values’ option allows us to create new text fields as a result of splitting an already existing one. We can choose between performing a ‘Custom Split’ or leaving Tableau to do all the work using the ‘Automatic Split’.
- Clean
Cleaning text fields before performing an analysis is a repetitive task that is simplified in Tableau Prep with the cleaning option. We can quickly perform actions such as changing text to uppercase or lowercase, removing letters, numbers and punctuation sings or deleting spaces.
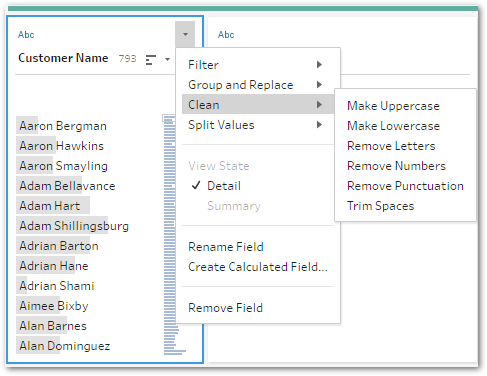
Figure 4: Different actions to clean our text fields.
- Group and replace
It is a common situation that our data contains different variations of the same values and we´ll typically want to group them under one unique category. In Tableau Prep, we can easily perform this task choosing between three possible alternatives. We´ll go into this in detail in the use case we´re presenting in the paragraph below.
- Create new fields
Tableau Prep also allows users to enhance their data by creating new calculated fields that were not present in the original dataset. We can write our own calculations using any of the fields in the dataset and choosing between a great set of functions.
1.4. Aggregate data
Another functionality available in Tableau Prep is the possibility of creating aggregations using the ‘Aggregate Data’ step. We can choose among several aggregation functions like sum, maximum, minimum, count, etc. to apply to any field in our data flow.
1.5. Save the resulting dataset
Once the data flow is defined and the data is prepared for the analysis, we can execute the flow and Tableau Prep will generate the output data. The resulting dataset can be stored as a CSV file or a Tableau Extract (traditional TDE files as well as new hyper extracts are supported) or even published to your organization’s Tableau Server or Tableau Online. In this way other users can connect to the already cleaned dataset that is ready for analysis.
2. Use case: Group and replace
Grouping similar values is a common task that sooner or later appears in the data cleaning process. Tableau Prep tries to simplify and automate this, providing three different strategies. We´ll review each of them using an example.
In this example, we have some data containing purchase orders from different clients. At the moment of purchase, the client is asked to input some personal data, including their place of residence. In this type of situation, it is common that users make typos entering the data or provide variations of the same name for some locations. Normally, this will create different categories in our data and we´ll need to change the values manually in order to unify them. Let’s see how Tableau Prep can help us with this.
We´ll work with the field City in our dataset. As you can see in the image below, there are different ways Los Angeles has been inputted. The previsualization window allows us to see this easily, with no need to dig in the data source.
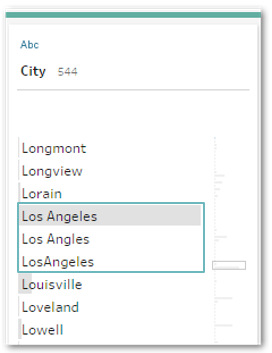
Figure 5: Different variations of the same city name.
Clicking in the arrow next to the field name will display the different operations that we can apply to it (this can be different for different types of fields). After selecting ‘Group and Replace’, we can choose between three grouping techniques: Manual selection, Pronunciation or Common characters.
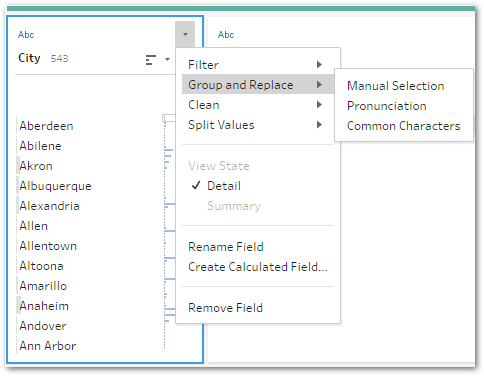
Figure 6: Options shown in the Group and Replace menu.
2.1. Group and replace: Pronunciation
This technique looks for values that are similar in pronunciation and groups them in one category. The grouped fields are identified with a paperclip icon. Clicking on any of those values we can see which values Tableau grouped together. For example, in our city category there are two different appearances of Los Angeles that were grouped under one single category. The group will be named after the most common value but we could change this by clicking on the group name and selecting “Edit Value”.
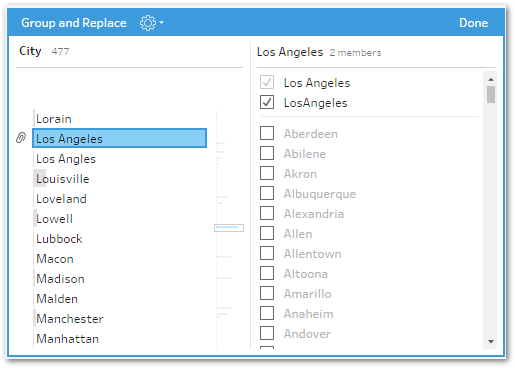
Figure 7: Results of grouping using pronunciation option.
2.2. Group and replace: Common Characters
The common characters technique will group the data in a similar fashion than the previous one, but using an algorithm based on the number of occurrences of each character. With this option, our former category ‘Los Angeles’ will group four different values. Although one of them is not correct, we have managed to include one variation more than in the first case. This is why it is always interesting to try the different techniques and see which one adjusts better to our data.
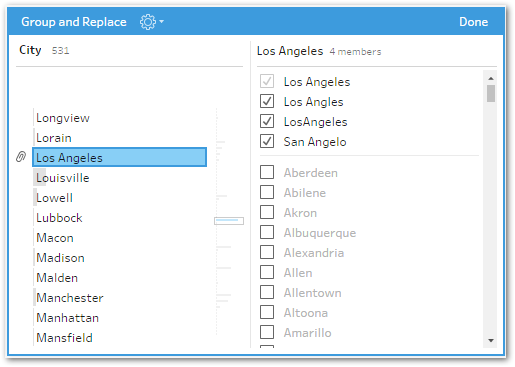
Figure 8: Results of grouping using Common Characters option.
2.3. Group and replace: Manual Selection
At any time, we can select or unselect values in the results, so they are included or removed from an existent group. We can also do this to create a new group that was not detected with the automatic grouping. For example, in the group Los Angeles, the algorithm has included the city San Angelo. We can uncheck that value to remove it from our group. We can also add the value LA manually, which was present in the data but not automatically included.
Conclusion
Cleaning and preparing data for analysis is a time-consuming task. Tableau Prep helps to simplify and automate this process giving the users more time to dedicate to the task they care more about, the analysis.
In ClearPeaks, we can help you to take your first steps with Tableau Prep.
If you already are a Tableau user, we can give you tips and tricks about creating flows so you can make the most of your data. If you are new to Tableau, we can help you get started!