30 Nov 2022 Radar Chart by ClearPeaks in Microsoft AppSource Marketplace
Our clients often ask for innovative visualisations in their projects, visualisations that aren’t in the current Power BI offering.
Recently, one of our clients asked us for a radar chart visualisation in a report. We tried the radar charts currently available in the Microsoft AppSource marketplace, but none of them had the specifications that we required, so we decided to create a brand-new radar chart from scratch.
In this article we will run through how we developed this custom visual and look at its new capabilities.
1. Radar Chart by ClearPeaks
Radar charts are useful for seeing which variables are scoring high or low within a dataset, making them ideal for displaying performance, in cases like employee skills analyses, sports players, product comparisons, etc.
The ClearPeaks Radar Chart allows you to create a chart with tons of configurations for customisation, making it highly adaptable. Our radar chart expands on the basic configurations, giving you full control of almost everything that the chart displays on the screen.
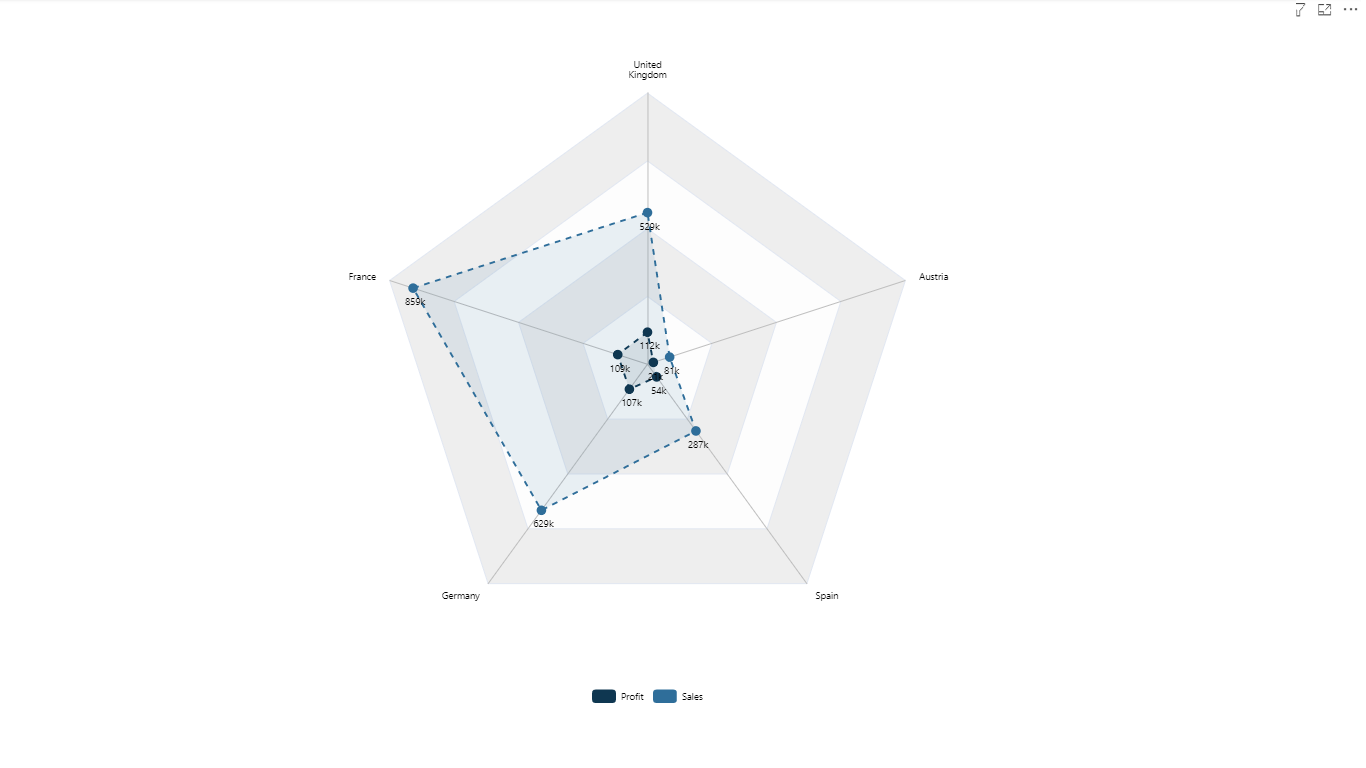
Figure 1: Radar Chart by ClearPeaks
1.1. What is New in the ClearPeaks Radar Chart?
The ClearPeaks Radar Chart was developed to allow the user to control almost all the configurations that Power BI offers. We also added some extra configurations that are not available in other versions of the radar charts presently in Microsoft AppSource.
Here you can see some of the cool features exclusive to our radar chart:
- You can display a percentage measure.
- You can split long x-axis names into two lines to offer better readability.
- You can filter with other visuals by clicking on the x-axis name, and provide feedback to display that it has been filtered.
- You can create alternate radar charts without lines, using only an icon.
- Legend animation, which guarantees an impactful visual effect: you can click on the legend to show or hide one of the multiple lines of the chart.
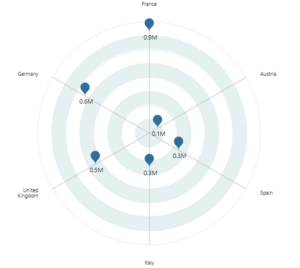
Figure 2: Alternative Radar Chart
1.2. Features
Now let’s look at some of the top features that we implemented in the ClearPeaks Radar Chart.
- Break Axis Name: With this functionality we can control how the axis name is displayed in the radar chart. We can define the number of characters an axis name must have in order to be split into two parts.

Figure 3: Alternative Radar Chart
- Measure in Percentage: This functionality allows you to display a measure as a percentage or as raw text.

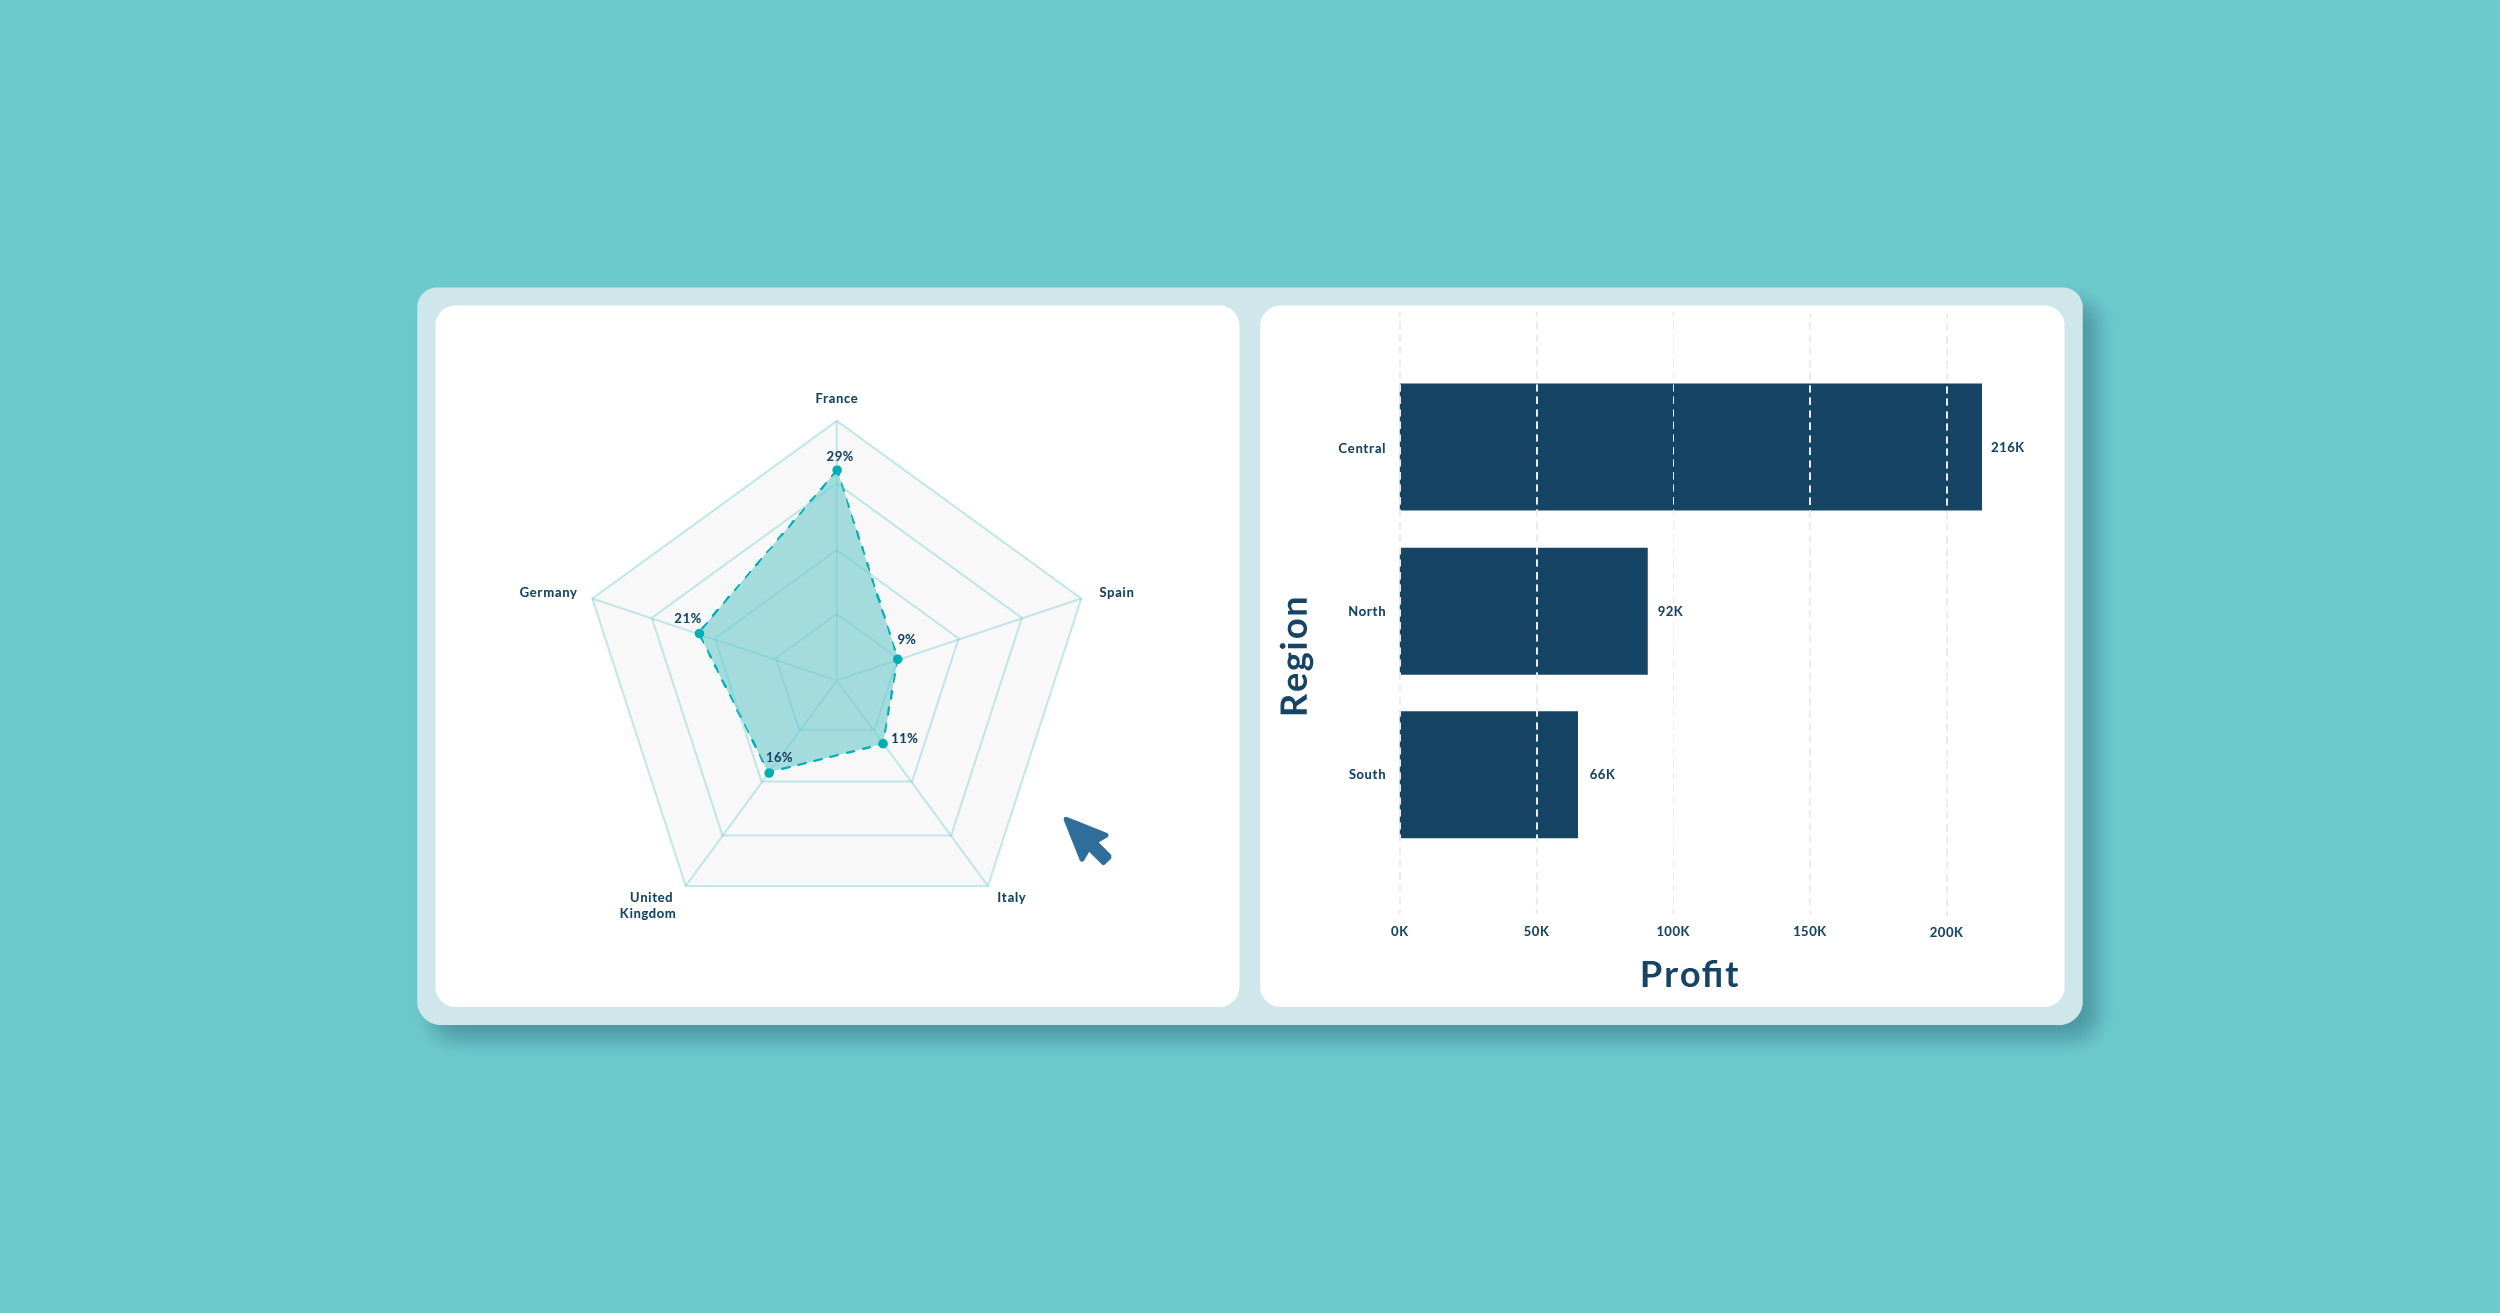
Figure 4: Percentage Radar Chart
- Filtering the dashboard using the axis name: Clicking on the axis name allows you to filter all the other visuals in the dashboard. Once the chart has been filtered it will display the selected axis with a different colour. The axis font family, font colour and height can also be customised.
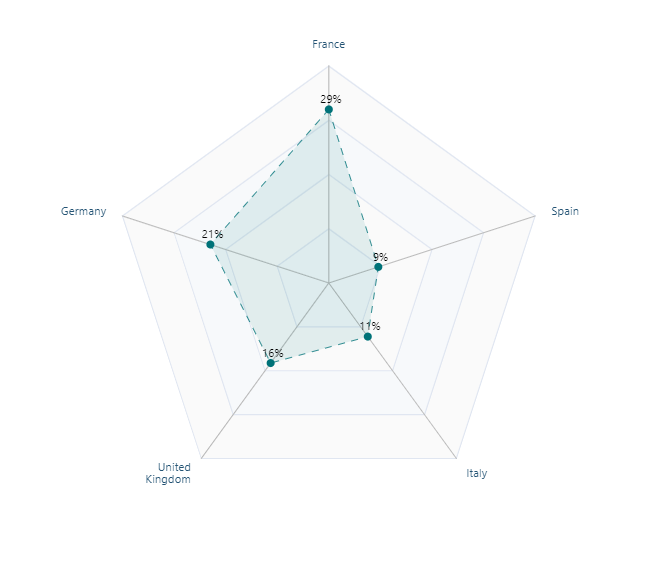
Figure 5: Filtering
- Legend animation: If the legend appears in the chart, you can click on each element to show or hide it.

Figure 6: Legend animation
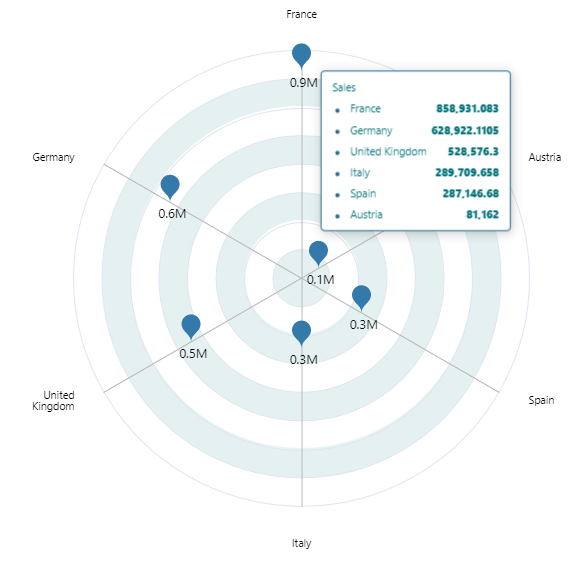
- Custom tooltip: A custom tooltip can be displayed to show all the values displayed in the radar chart; this tooltip can be fully customised too.

Figure 7: Custom tooltip
There are loads more configurations available for this custom visual – try it out yourself by downloading it from Microsoft AppSource at this link, Radar Chart by ClearPeaks.
If you want to see a demo, just click on this link to watch a YouTube video showing how this visual works.
Conclusion
This custom radar chart more than satisfied our client’s needs and we’ve also added some extra features that we’d like to share with the Power BI community.
Having developed the ClearPeaks Radar Chart, we can easily create more custom visuals and add features for both developers and clients.
If you are interested in custom visualisations to meet your particular needs, don’t hesitate to contact us, and we will be happy to give you a helping hand!