13 Dec 2018 Tableau 2018.3 new features
At the end of October Tableau launched their 2018.3 version, full of interesting and attractive new features, some of which are for dashboards, such as the navigation buttons and transparent worksheet backgrounds; one of the most anticipated is “Set Actions”.
Let’s take a look at the new features included in the 2018.3 version before examining some Set Actions practical cases.
1. Tableau 2018.3 new features
Below we can see all the new features found in Tableau 2018.3:
1.1. Install and Deploy Tableau
- Mobile layout preview on the web
- Tableau Bridge improvements
1.2. Connect to and Prepare Data
- Multiple-table storage for extracts
- Identity auto-sync with SCIM for Tableau Online
- Spatial data updates
- Secure RServe connections
1.3. Design Views and Analyse Data
- Heat map
- Transparent worksheet backgrounds
- Set Actions
- Dashboard navigation buttons
- Navigation actions
1.4. Publish Data Sources and Workbooks
- Web authoring improvements
1.5. Share and Collaborate
- New user notifications
2. Set Actions
One of the most attractive features of a dashboard is its interactivity, helping to answer questions and offering a rich user experience. Until now, Tableau dashboards were always interactive, but Set Actions has arrived on the scene to change this concept.
With past versions of Tableau we were able to apply some actions such as highlight or filter, but we could only do so to specific fields. Now we can choose where to apply these actions, defining sets and applying actions to them. Some examples of actions we can create are proportional brushing, colour scaling and customised highlight actions. Let’s review them:
2.1. Proportional brushing
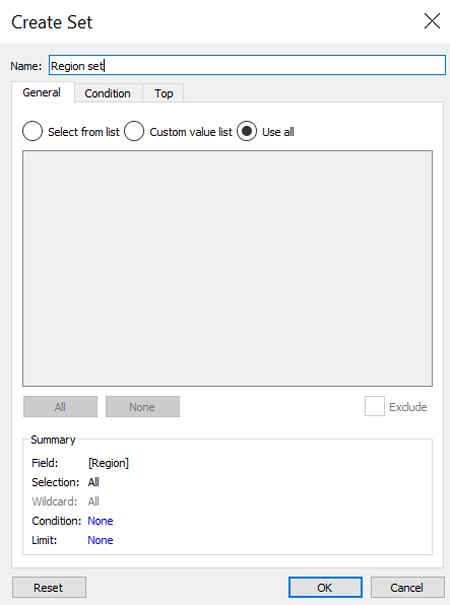
Proportional brushing is a method of interacting with data that consists of showing the proportion of a selected item in a view in relation to all items. As an example we are going to show the monthly sales from a selected region in comparison with total sales.
The first thing we have to do is to create a set:
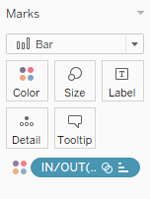
Once we’ve done that, we create the view where we want to show the proportion of the selected item (a region, in this case) and add the set to the colour shelf:
The next step is to create a dashboard with a chart containing the items that are going to be used as filters and the chart that is going to be filtered; we add the next action to the dashboard:
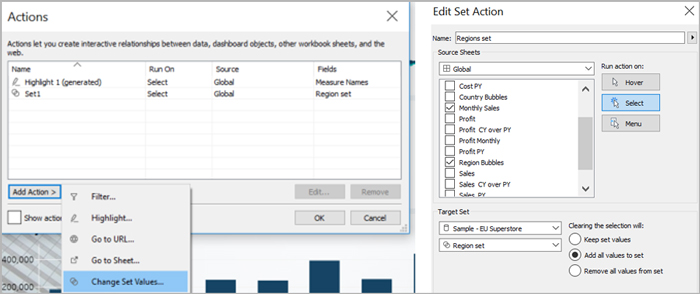
Now, when we click on a region, we’ll be able to see the proportion of sales from that particular region in the bar chart:
2.2. Colour scaling
Colour scaling can add another perspective to our visualizations. Distortions in colour intensity can appear due to outliers; if an item has a higher value than the others, colours may not provide the information we need because feedback from non-extreme values might be lost.
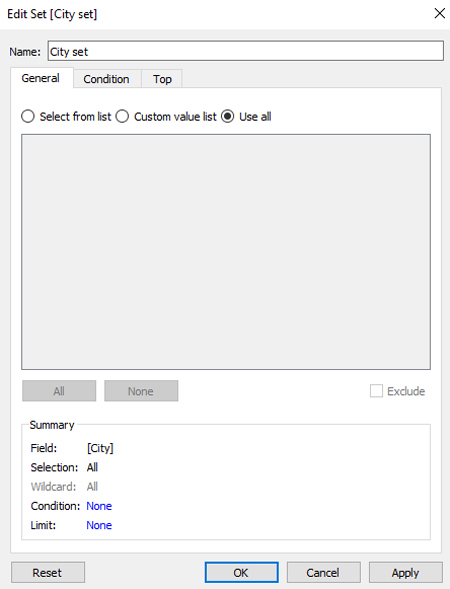
Let’s look at an example with a heat map. The first thing we need to do is to create a set in the City field:
Next we create a heat map and include it in a dashboard, and then we go to the dashboard and define the next action:
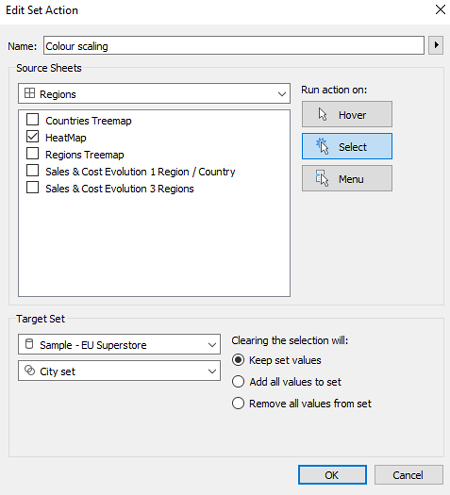
Now we can see that when we select cities, the colours are rescaled proportionally according to the selection made:
2.3. Customised highlight actions
Tableau was already offering highlight actions, but they were fixed; now, with Set Actions, we can customize these highlights. In the following example we’ll work with a dashboard related to product data.
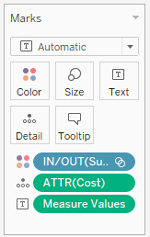
As seen above, the first thing we need is a set. In this case we create it, using the Sub-category field, and then we add it to the colour mark so the items that are not selected are less visible:
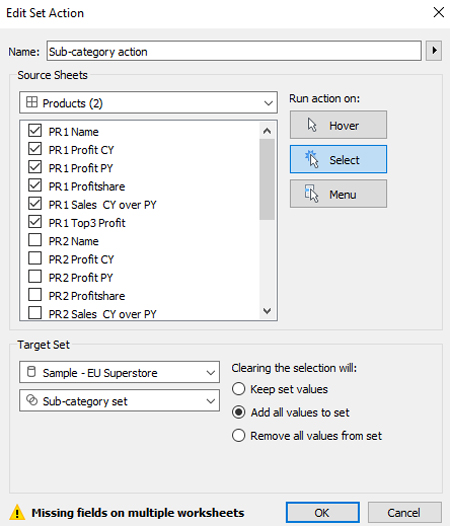
The only thing left to do now is to create the action using the created set and apply it to the charts we want to highlight:
Once created, we can proceed to test it:
Conclusions
As we have seen, Set Actions is a powerful new feature that allows us to make comparisons between sets defined in our data. In this article, however, we have seen just a few examples of what can be done – the possibilities with Set Actions are endless.
During these demos we also checked out some other new features offered in Tableau 2018.3, such as heat maps, navigation buttons and transparent backgrounds. You can find all the new features in the official Tableau website.
At ClearPeaks we are experts on Tableau, always on the ball with the latest features and enhanced visualizations. If you need more information about Tableau or about how we can help you and your business, don’t hesitate to contact us.