27 Sep 2019 Tableau 2019.3: Explain Data and Data Catalog
Recently, Tableau launched their 2019.3 version, including some useful new features; in this blog article we will review them all, focusing on the ones that we consider key for developers and end users.
We will mainly review Data Catalog and Explain Data. The former is the first useful feature that Tableau releases featuring Data Management, which is a critical aspect for a company’s data credibility. Explain Data is a powerful tool that will help the end user easily understand any data point from a visualization with a simple click.
Firstly, though, let’s look at the list of features that this Tableau 2019.3 version is offering:
1. Tableau 2019.3 features
1.1. Desktop
- Parameter actions improvements
- New language: Italian
- Explain data
- ISO-8601 calendar default
- Spatial calculations: MakePoint improvements
- Spatial calculations: Distance
- Databricks Connector
- Enhanced cross-database join control
1.2. Prep
- Google BigQuery Connector for Prep
- Custom Data Roles in Tableau Prep
- R and Python integration for Prep Builder
- Connect to published data sources
1.3. Server
- Debian 9.0+ support
- Ask Data improvements
- Spatial files for web authoring
- Set context filters on the web
- Improved content sharing
- Published embedded data sources
- New search results page
- New product language: Italian
- Encryption at Rest
- Tableau Server Management Add-on
- PDF attachment to subscriptions
- Export to Power Point improvements
- Databricks Connector
- Enhanced cross-database join control
- Tableau Catalog
- Web authoring improvements
1.4. Online
- Data Management Add-on
- Ask Data improvements
- Spatial files for web authoring
- Set context filters on the web
- Improved content sharing
- Publish embedded data sources
- New search results page
- New product language: Italian
- PDF attachment to subscriptions
- Export to PowerPoint improvements
- Enhanced cross-database join control
- Tableau Catalog
- Web Authoring improvements
1.5. Public
- Hashtags
- Parameter actions improvements
- New product language: Italian
- Explain Data
- ISO-8601 calendar default
- Web editing for Tableau Public
- Favourite from gallery
2. Key features
2.1. Explain Data
It is common when looking at data to be intrigued by certain values that are considered unreasonable or that are simply unexpected –Analysts spend a lot of time trying to figure out a good explanation for those unusual data points that are usually only explained when they accurately analyse the raw data behind the visualization. This can be tedious work which makes dashboard decision making much slower.
Tableau understood this problem and decided to introduce ‘Explain data’ which allows us to get key insights about any data point in a single click. This means that if we find a data point that we don’t understand or that we don’t consider normal, ‘Explain data’ will automatically analyse lots of possible explanations and based on an AI algorithm will return the best or more reasonable ones.
Furthermore, the feature will automatically create a detailed visualization that will help the user understand the best explanation chosen and dig in if necessary – which will help the analyst achieve much more detailed explanations of the data.
See the example below:

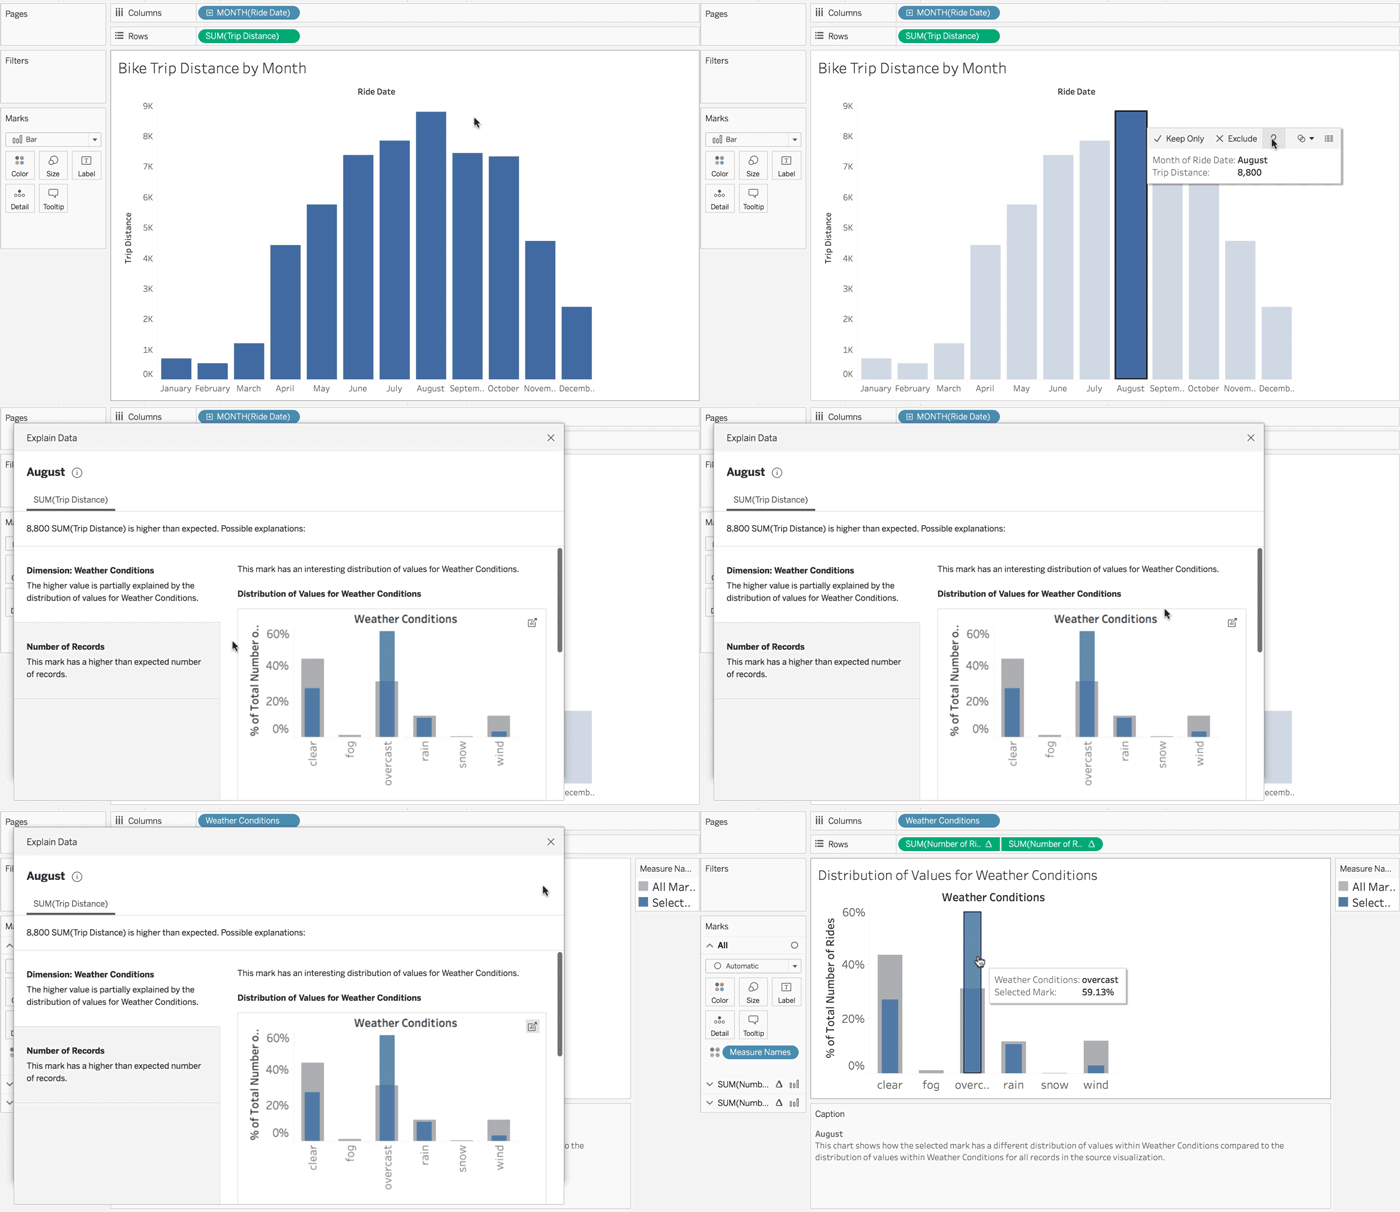
Figure 1: Source: https://www.tableau.com/about/blog/2019/9/available-today-explain-data-tableau-catalog-and-tableau-server-management-add
As an end user, we would like to understand why people have travelled more kilometres with their rental bikes in the month of August. Clicking on the explain data icon Tableau will automatically come up with several possibilities. In this case the two most likely explanations are weather conditions and number of records.
From this quick tip, we can certainly determine that the high number of miles are based on the higher number of trips during August which at the same time may be induced by the better weather.
Even if this example is quite straightforward ‘Explain data’ can be helpful in more difficult situations when the logical reason might not be the true one. It can even help to easily identify outliers that are deteriorating the quality of the visualization.
2.2. Data Catalog
Organizations collect data from several different sources. A good BI infrastructure helps organize this data rationally to effectively use it for decision making. However, it is a good data management system that will ensure the quality of the data and therefore the quality of the important decisions that are driven by it. It’s been the case for many companies that the lack of organization and management in their data led to bad decisions based on data that was wrong or not updated.
Tableau has created a “Data Catalog” exactly for this reason. Knowing exactly the story and ownership of every data source, workbook or sheet will ensure quality and will build credibility among the business users that will use it.

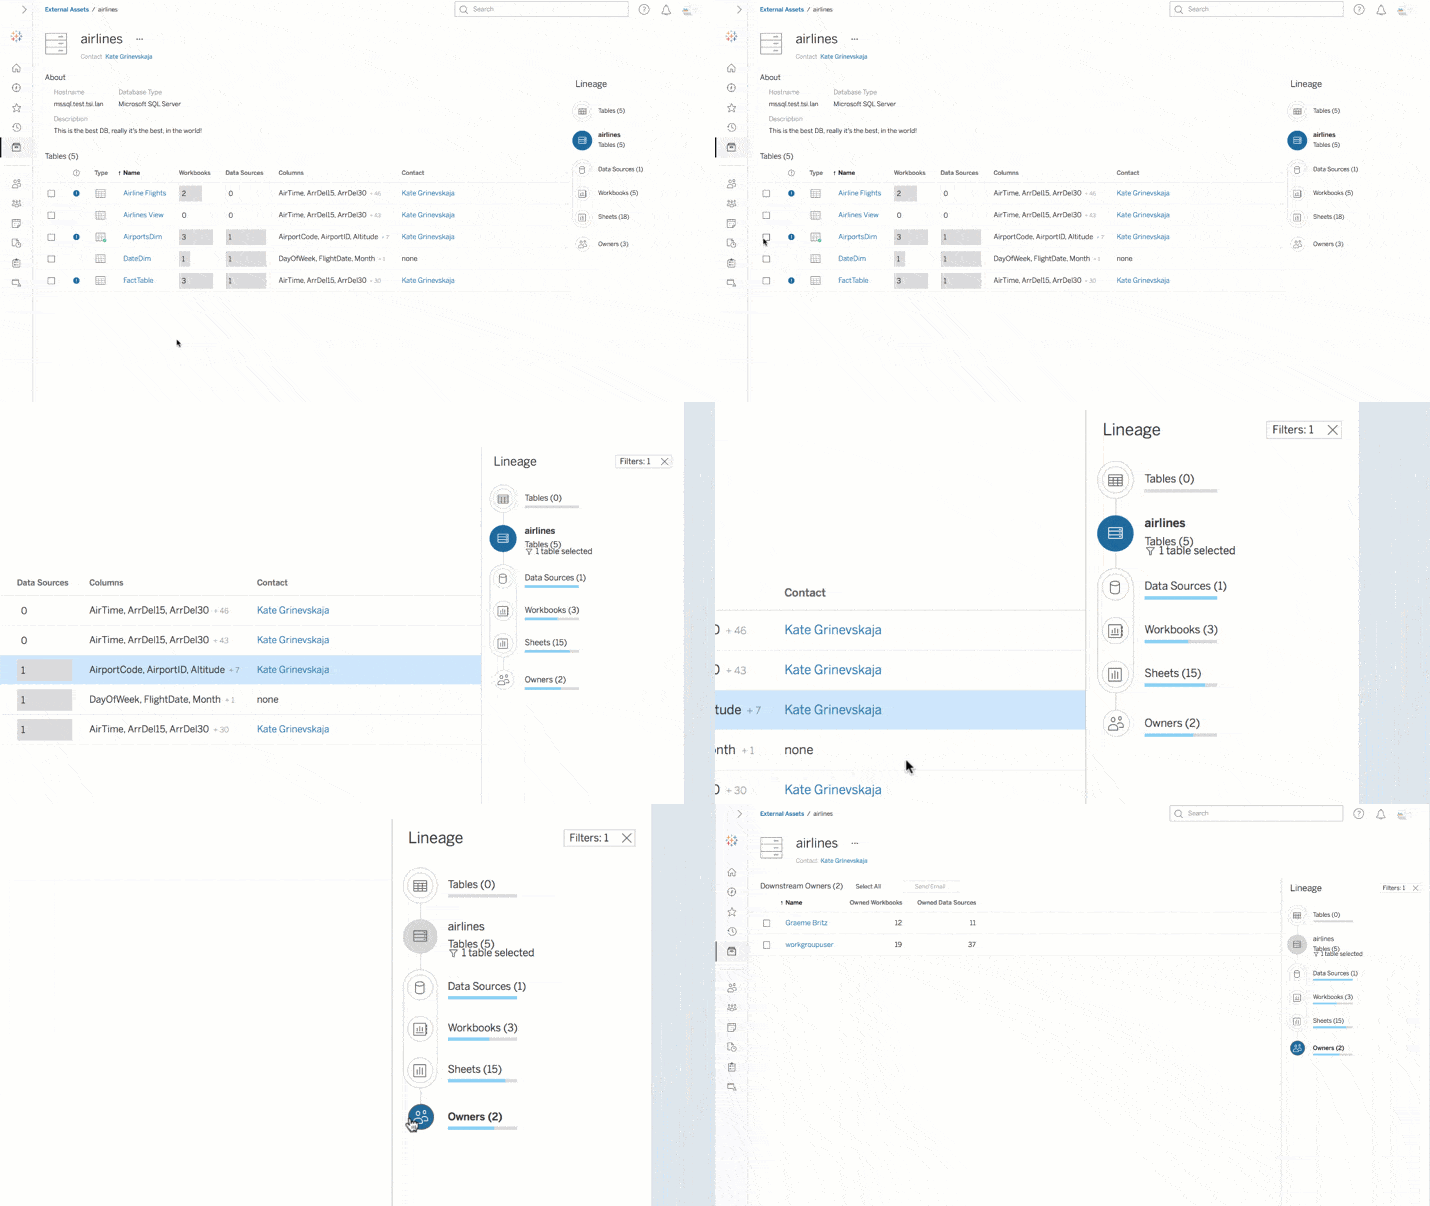
Figure 1: Source: https://www.tableau.com/products/add-ons/catalog
Data Catalog will automatically classify and structure the metadata of any new object, maintaining a central list with all the information. It also provides an intuitive UI to see all the company’s data structure with the critical information and details of each of its components. Even status can be added to each of the components (data sources, sheets, workbooks) making it easy for the end user to understand if that piece of data is up to date to solve business problems.
From ClearPeaks’ perspective, we think that Data Catalog will now become one of the critical features to have in any company’s Tableau ecosystem. It will ensure quality and therefore will be essential towards maintaining the flow of a Data driven company.
Conclusion
Both Explain Data and Data Catalog are excellent additions to what Tableau can offer to any company. Make sure to take some time to review all other new features in Tableau 2019.3 on the official Tableau website.
At ClearPeaks we are experts in Tableau, always on the ball with the latest features. If you need more information about Tableau or about how we can help you, don’t hesitate to contact us.

