25 Feb 2020 Tableau 2020.1 new features
On the 25th of February, Tableau released their 2020.1 version, offering us a lot of interesting new features; in this blog article we are going to run through them and take a special look at the new dynamic parameters and viz animations.
1. Tableau 2020.1 new features
1.1. Tableau Desktop
- Dynamic Parameters
- Viz Animations
- Spatial Function: BUFFER()
- Discover Pane Customization
1.2. Tableau Prep Builder
- Prep: LOD Calculations
- Prep: Analytic Calculations
- Prep: Visual LOD/Rank Calcs
- Prep: Initial SQL Parameters
1.3. Tableau Server
- External File Store for Tableau Server
- Run-Now Job Control
- Desktop Features on the Web
- SSL for External Services
- Content Migration Tool Enhancements
- Easy Dashboard Export
- Extract Refresh Subscription
- Slideshows in Help Content
- Tableau Catalog Enhancements
2. Key Features
2.1. Dynamic Parameters
Before this release, parameters had to be manually updated if the data they pointed to changed, but thanks to this new update, parameters can be automatically updated every time you re-open the workbook; enabling this feature is effortless.
We are going to use the Today function to show you how to configure the dynamic parameters feature in your workbooks. First, we create a calculated field with the Today function:
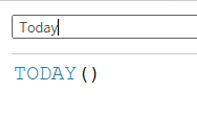
Figure 1: Creating a calculated field with the Today function
Next we create a parameter pointing to that field, assigning the “Value when workbook opens” to the field we have just created:
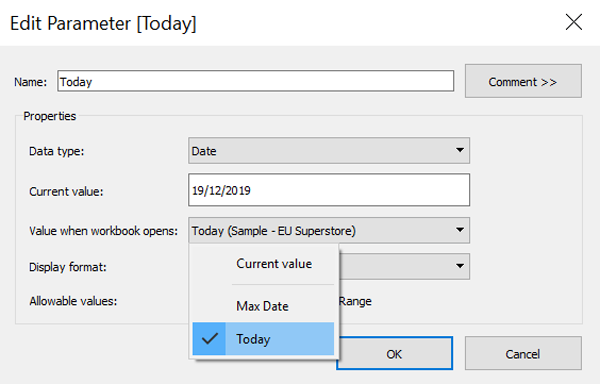
Figure 2: Creating a parameter pointing to the Today function
2.2. Viz animations
Thanks to this new feature, it’s easy to see the changes produced in our visualizations. This feature is not activated by default in existing workbooks, so if you want to take advantage of its power you have to enable it as seen in the next image:
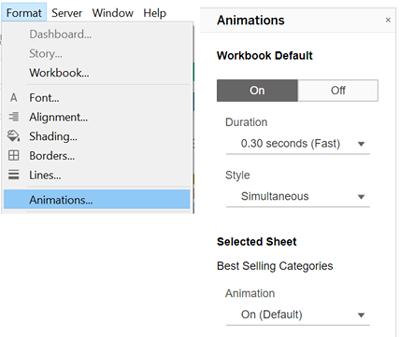
Figure 3: Enabling viz animations
Animations can be activated for the whole workbook or for each individual sheet. Once enabled, an animation will play every time we do any of the following:
- Apply or change filters
- Set a quick filter or parameter
- Sort a viz
- Change axis properties
- Apply or change filter actions
- Modify a measure via a calculation
- Swap, add, or remove measures via a pill or shelf change
- Use the Pages shelf control (including the play button)
In order to show you what this looks like, we are going to create an animated scatter plot visualization.
First, we create two paremeters with a list of strings corresponding to the fields we want to compare in the scatter viz, and two calculated fields that return the field depending on the parameter:
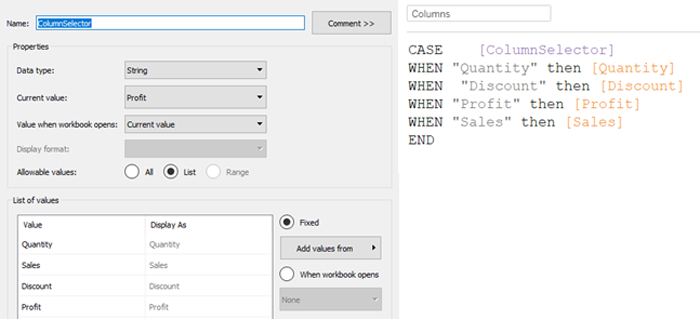
Figure 4: Create a calculated field with the fields to compare and a parameter as a selector
The next step is to create the scatter plot and to activate the animations as we have shown you before:
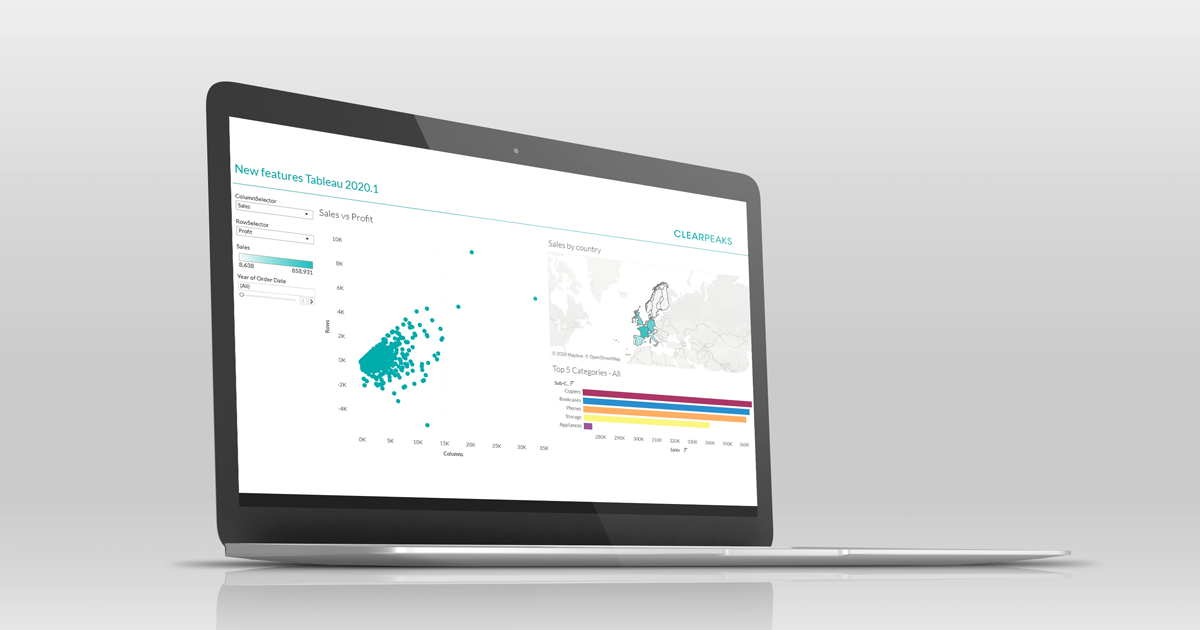
Figure 5: Dashboard with animations
Conclusion
With this Tableau update it’s much easier to animate visualizations and make them clearer; furthermore, updating parameters will no longer be a chore, thanks to the new dynamic parameters feature.
At ClearPeaks we are experts in Tableau, familiar with its latest features and constantly working on enhanced visualizations. If you need more information about Tableau or about the many ways in which we can help you and your business, do not hesitate to contact us!