• All
  • Advanced Analytics
  • AI & LLM
  • Amazon
  • Big Data & Cloud
  • ClearPeaks
  • Cloudera
  • CoolThoughts
  • Data Governance
  • Enterprise BI
  • ETL
  • Executive Analytics
  • Google
  • Informatica
  • KNIME
  • Microsoft
  • Observation Deck
  • Oracle
  • Qlik
  • Snowflake
  • Tableau
  • Visualizations
  • Web & Mobile BI Development
Sometimes because of the nature of the data in our system we need to have different types of aggregations (sum, max, last…) for one single measure. Therefore the aggregation type needs to be different depending on the dimensions (Date, Product…). One clear example of this is in dealing with stocks. Stocks have different kinds of aggregations depending on how you look at it. The aim of this article is to know how to deal with these different aggregation level measures and implementing a solution in the OBI repository to solve the issues that those measures bring.

After another successful ClearPeaks Academy training in Zurich, Switzerland, we would like to share with you our experiences and some feedback from the training itself. This training workshop covered Oracle 11g Advanced topics where Sergi Guiñon, a ClearPeaks BI consultant, introduced the technology and delved deeper by sharing his real world experiences and by giving the attendees the opportunity to have hands-on practice with it. The attendees enjoyed the combination of the theory and practical lab examples, the competency of the course and the material along with the overall assistance and knowledge of the trainer.
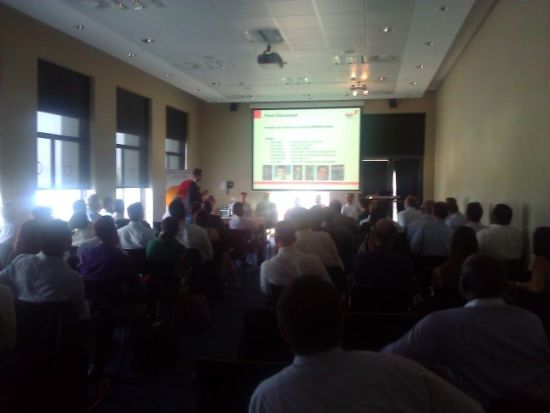
Yesterday, in Sitges (near Barcelona) Spain, began the EMEA BI & EPM Partner Community event where assitance got the latest on industry BI trends and Oracle Products from Oracle experts. It was also a good opportunity for Partners to reach out and voice their experiences and opinions to their fellow Partners.

copy WP_000099

There was a tremendous turnout of Oracle Partners and Oracle Representatives

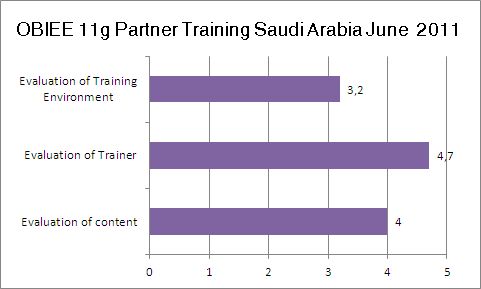
Last week, ClearPeaks held their Academy training session on Advanced OBI EE 11g  in Saudi Arabia. The attendees of the course varied from Applications Consultants, Senior Developers, Technical Consultants to BI Analysts who were trained by, Sergi Guiñon, a Consultant at ClearPeaks bringing with him hands-on knowledge and experience on real world issues. The attendees of the course were taught the features on BI with a special focus on the advanced features of 11g.  The training topics were covered through the course material and hands-on lab work, which gave the attendees the opportunity to learn and experience the technology on their own by installing, administering and developing the BI tool. The feedback was positive including comments such as useful knowledge gained and further interest into more in-depth knowledge and lab work, interest in further technical knowledge and a great first impression to the new Oracle solution. The trainees will take with them the skills and techniques to perform BI projects in their company. Have a look at the feedback provided by the training attendees:

Clipboard01Scale: 0 (poor) to 5 (excellent)

Dynamically changing the information displayed in a dashboard should be one major objective for the developers. This flexibility reduces the number of requests to be developed and increases the user experience. A common way of achieving this flexibility is by using the Column Selector view. This view allows the user to select a subject area column dynamically and to get results based on that selection (e.g. Revenue by Year/Region/Product). The Challenge Unfortunately, using the Column Selector view has some limitation. An important one is that every time a new subject column is selected, a new query is executed to refresh the data. So in the case that we need to change multiple columns, we will be executing multiple intermediate useless queries. In this blog article we will show a way of simulating the Column Selector view when we need to change multiple columns in a report. The Scenario The requirement is to be able to switch between two reports that differ only in some columns (in this case, a set of measures). The user does not want to have them in separate Dashboard Pages but in one single dashboard page, displaying one report or the other based on a “Measure Selector”.
Last week Oracle announced the release of Oracle BI Applications 7.9.6.3. Finally with this release BI Experts will enjoy the advantage to be able to build these BI Apps directly on top of Oracle Business Intelligence Release 11.1.1.5. Organizations can take advantage of the platform’s enhanced mobile features, user experience, systems management, performance, and scalability.
One of the most frequent requirements from reports in tabular form (Pivot Tables or normal Tables) is to show all possible values of a specific dimension and its related metrics.
But how to show all values if for some of them there are no data?
Being based on a SQL query, it is obvious that an OBI report shows dimension values that have information in fact tables, skipping values without any data.
For example, a Marketing report showing the number of Campaigns launched per Quarter will only display quarters having at least one campaign executed. If a quarter doesn’t have information about the report metric, the quarter will be skipped and will not appear in the end report. In this example (Figure 1), there are no campaigns launched in quarter 2 and 4.
One of the most frequent requirements from reports in tabular form (Pivot Tables or normal Tables) is to show all possible values of a specific dimension and its related metrics. But how can you show all values if for some of them there is no data? Based on a SQL query, it is obvious that an OBI report shows dimension values that have information in fact tables, skipping values without any data. For example, a Marketing report showing the number of Campaigns launched per Quarter will only display quarters having at least one campaign executed. If a quarter doesn’t have information about the report metric, the quarter will be skipped and will not appear in the end report. In this example (Figure 1), there are no campaigns launched in quarter 2 and 4.

1

Figure 1 – Normal Report

Loading new posts...
No more posts